Council on Energy, Environment and Water Integrated | International | Independent
Suggested citation: NMC and CEEW. 2025. Navsari City Action Plan for Flood Risk Management 2025: Navsari: Navsari Municipal Corporation; and New Delhi: Council on Energy, Environment and Water (CEEW)
This report puts forward the first detailed action plan for managing flood risks in Navsari City. It serves as a guide for the city administration to prepare in advance, act effectively during heavy rains, and recover quickly afterward. The plan aims to strengthen the city’s ability to adapt to changing rainfall patterns and reduce the disruption caused by flooding, laying the foundation for a safer and more resilient Navsari.
The plan was formulated by adopting a systematised approach which included the development of intensity–duration–frequency (IDF) curves by conducting rainfall trend analysis for more than 50 years. Based on that, peak discharge was estimated for different rainfall scenarios. A ward-level urban flood risk index was then computed using hazard, exposure, and vulnerability indicators to understand the relative risks across the city, followed by the mapping of flood hotspots. Based on the results obtained from the analysis undertaken, a set of clear short-, medium-, and long-term actions were recommended. These recommendations are organised across three phases–pre-monsoon, monsoon, and post-monsoon–and each action is linked to the departments responsible, ensuring that the relevant stakeholders are accountable for planning, response, and recovery at every stage.
Also read: Thane City Action Plan for Flood Risk Management 2024
India has more than 5,000 urban local bodies (ULBs) (MoHUA 2015), which together cater to over 31 per cent of the national population. Like with cities and metropolitan areas worldwide, Indian urban centres face multifaceted challenges that climate change is making increasingly complex. One growing concern is the rising frequency of high-intensity rainfall events over short periods, which significantly impacts the existing adaptive capacity (AC) of governments and communities. Vulnerable populations, especially senior citizens, children, persons with disabilities, and populations in informal settlements – often situated in hazard‑prone, low‑lying urban areas lacking formal infrastructure, adequate housing, and access to water, sanitation and hygiene (WASH) – are disproportionately impacted the most (UNDRR 2019). The social repercussions of such events intensify the risks associated with urban flooding.
With the number and intensity of urban flooding incidents increasing due to climate change, cities must take action to protect vulnerable communities by mitigating flood risks and maintaining or restoring ageing urban flood control infrastructure. A proactive and holistic approach begins with a flood risk assessment, as recommended by the 2019 National Disaster Management Plan (NDMP). Such assessments should examine hazard, exposure, and vulnerability, and be followed by the development of effective risk mitigation, preparedness, and response mechanisms (NDMA 2019). Cities may also draw on global good practice guidelines, such as the World Bank’s Urban Flood Risk Handbook (Ferguson et al. 2023).
Coastal cities are especially vulnerable to sudden and extreme storms and floods, as they are mostly located in low lying areas, and storm events combined with high tides make water evacuation difficult. Navsari in Gujarat is one such coastal city that regularly experiences recurrent floods. The city, situated at 20.94°N and 72.95°E, spans an area of approximately 43.63 sq km and is divided into 13 administrative wards.
To address these challenges, the Council on Energy, Environment and Water (CEEW) partnered with the Navsari city administration to prepare a city-level flood risk management action plan. This report presents the plan. First, it analyses historical rainfall data, which were used to update the intensity–duration–frequency (IDF) curve and estimate peak discharge. Second, it identifies hydrological, governance, social, and economic factors at the ward level that influence flood risk. Third, it maps urban flood hotspots. Fourth, it classifies wards into high and very high risk of urban flooding. Finally, it proposes recommendations to strengthen mitigation, preparedness, and response measures (Figure ES1).
Figure ES1: Key aspects of urban flood risk action plan for Navsari Municipal Corporati
on (NMC)

Source: Authors’ compilation
Navsari City’s Action Plan for Flood Risk Management (APFRM) comprises three specific components: why to take action, where to prioritise, and when to act.
Why to take action: This section involves tracing rainfall trends using historical rainfall data (1970– 2024) and preparing the IDF curve. The 24-hour maximum precipitation during these 54 years ranged from 72 mm to 417 mm, with a coefficient of variation of 42 per cent, indicating high temporal variability. Such a high variation poses a challenge for the city administration, particularly in years with extreme rainfall that can potentially cause urban flooding. Over the same period, the peak discharge was 4.27 cubic metres per second (cumecs) per sq km for a two-year return period and 7.12 cumecs per sq km for a ten-year return period (Figure ES2). However, the primary concern for Navsari is the absence of data on the carrying capacity of its existing drainage network and the inadequate coverage of the stormwater network. Four of the thirteen wards (wards 4, 5, 9, and 13) lack a dedicated stormwater network. This highlights the need to inventorise the carrying capacity of stormwater network drains, while also upgrading the drainage network by expanding the network and maintaining the existing network.
Figure ES2: Peak discharge estimation for areas under the NMC for different scenarios

Source: Authors’ analysis using IMD gridded rainfall data
Note: Q (max) refers to the period of 1995–1999, when the maximum discharge was observed, and Q (latest) peak discharge refers to the period of 2020–2024.
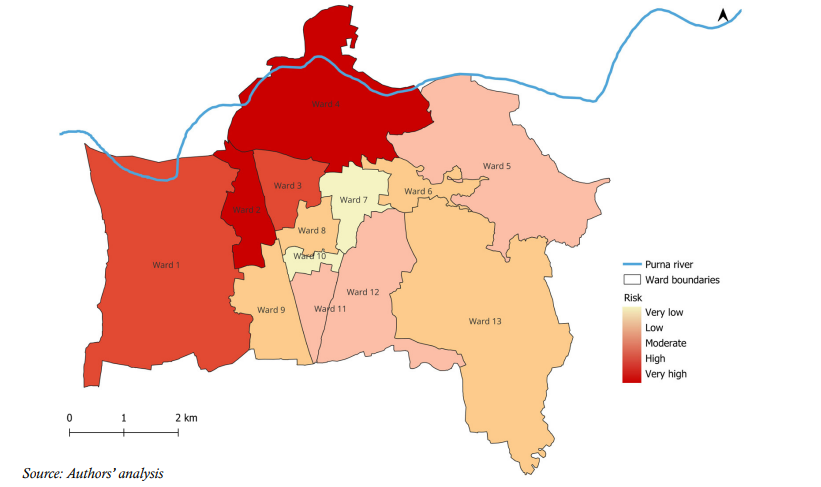
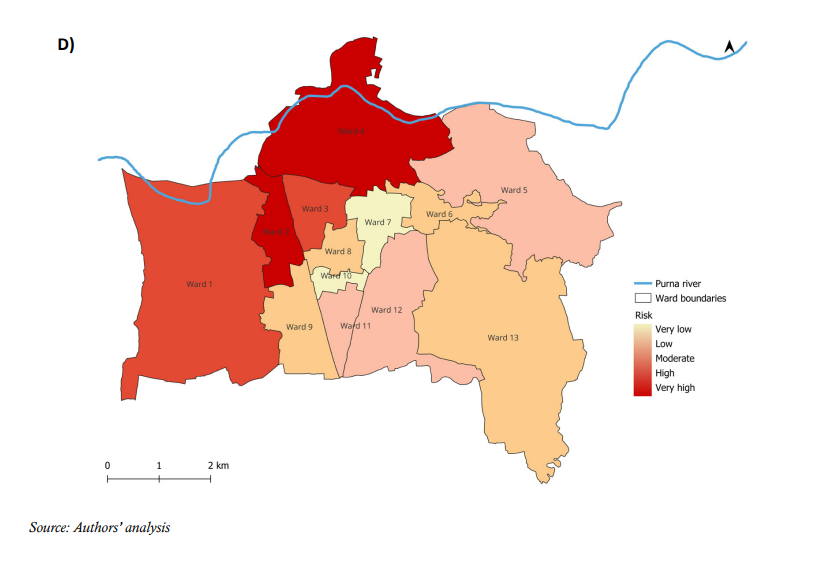
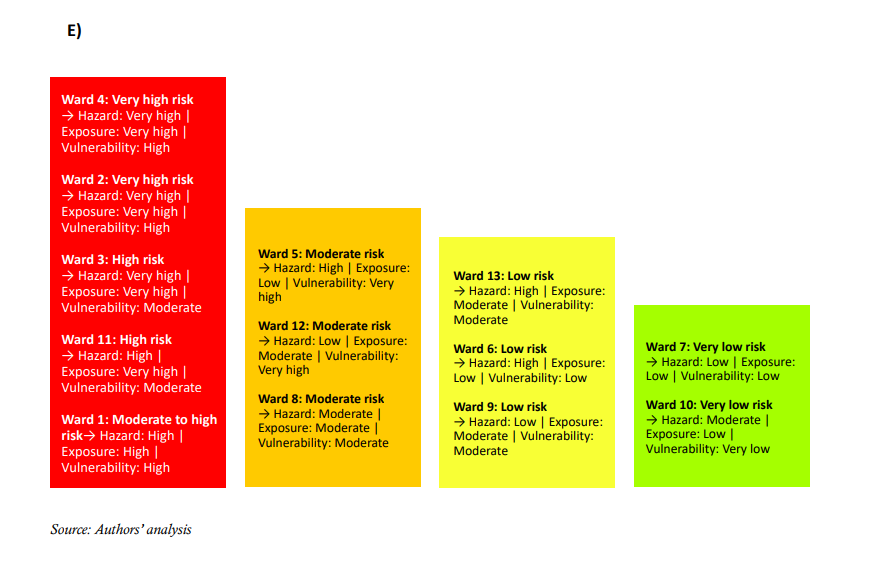
Where to prioritise action: The urban flood risk index, developed and computed for Navsari (Figure ES3), identifies wards 4 and 2 as being at a very high risk of urban flooding. Wards 3 and 11 fall into the high-risk category, while ward 1 is classified as moderate to high risk, with its index value closer to the high-risk range. Wards 5, 12, and 8 fall into the moderate-risk category. Wards 13, 6, and 9 are categorised as low risk, while wards 7 and 10 face very low risk. The composite index–based risk assessment provides guidance to decision-makers to prioritise interventions and identify the most relevant stakeholders and types of interventions required in each administrative block.
Figure ES3: Urban flood risk index for Navsari Municipal Corporation across different ward
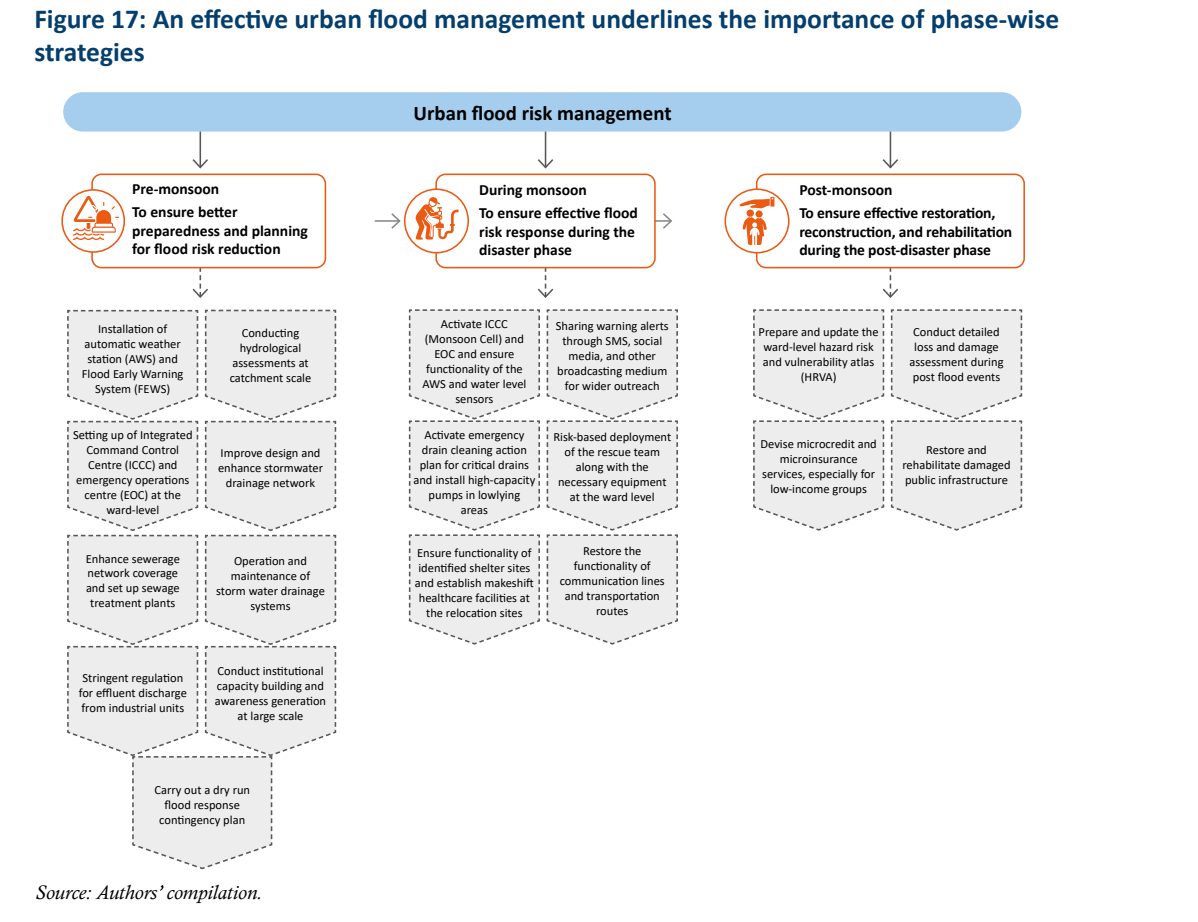
Who will (and how to) take action: Stakeholder involvement is crucial for validating the findings of the urban flood risk assessment, ensuring its uptake, and facilitating efficient coordination for implementation. The APFRM outlines a set of actionable recommendations for the NMC, which, once implemented, can play a pivotal role in mitigating the urban flood risks and strengthening citylevel adaptation. The plan proposes a three-phase approach for the city administration, consisting of the pre-monsoon (December–May), monsoon (June-September), and post-monsoon (October– November) phases (Figure ES4). The pre-monsoon phase focuses on ensuring better preparedness and planning, the monsoon phase focuses on effective flood risk response, and the post-monsoon phase focuses on effective restoration, reconstruction, and rehabilitation post-disaster. For each phase, the plan provides a timeline for implementation and assigns responsibility to relevant departments, distinguishing between nodal and supporting roles.
Figure ES4: An effective urban flood management underlines the importance of phasewise strategies

Source: Authors’ compilation
The Navsari APFRM provides a comprehensive framework by integrating scientific assessments with local governance and socio-economic conditions, and formulating ward-level risk profiles. With its three-phase strategy and clear departmental responsibilities, the plan equips the city administration to manage urban floods and build long-term resilience in Navsari effectively.
Before 2005, flood disaster management in India primarily focused on riverine floods, which largely affected rural areas. In recent times, however, many Indian cities have experienced floods with increasing frequency. For some cities, flood peaks have risen by 1.8 to 8 times and flood volumes by up to 6 times, primarily due to higher levels of built-up area (NDMA 2019). As a result, flooding occurs very quickly. Although the nature of urban flooding differs significantly from that of rural areas, in the absence of a dedicated urban flood management strategy, it is often treated through the same lens as riverine floods.
The 2005 Mumbai floods marked a turning point. In 24 hours, the city received 944 mm of rainfall, a 100-year high, which brought it to a complete standstill. Nearly 500 lives were lost, and economic damages amounted to INR 28 billion (USD 322 million)(Singh 2018). The magnitude of the destruction resulting from these urban floods made the authorities realise that the causes of urban flooding are significantly different, requiring targeted strategies. In response, the National Disaster Management Authority (NDMA) released the National Guidelines for the Management of Urban Flooding in 2010 to enhance urban flood disaster management efforts and strengthen the national vision of transitioning towards a more proactive, pre-disaster preparedness and mitigation-centric approach.
In recent years, the recurrence of flooding events has increased in Indian cities. Notable examples include the floods in Hyderabad in 2020 and 2021, Chennai in November 2021, Bengaluru and Ahmedabad in 2022, parts of Delhi in July 2023 and June 2024, and Nagpur in September 2023 (Singh 2022). This rising urban flood risk is driven by changing precipitation patterns linked to climate change and by rapid, unplanned urbanisation. Built-up areas in cities have expanded dramatically, resulting in the creation of concrete jungles with extensive networks of impervious surfaces. Such developments lead to increased surface run-off, which results in frequent floods in very short periods during storm events. Encroachment on natural drainage lines, vegetation landscapes, floodplains, lakes, and other water bodies in urban areas has further reduced the capacity of natural green and blue systems to retain water, thereby compounding flood risks. For instance, in Bengaluru, the proportion of built-up area increased from 8 per cent in 1973 to 93 per cent in 2020 (Ramachandra et al. 2016). Due to this concretisation, 98 per cent of lakes in the city have been encroached upon. Moreover, drainage infrastructure bottlenecks, combined with issues in their operation and maintenance, are further making cities vulnerable to flooding. Addressing these challenges requires an optimum mix of adaptation strategies, including water-sensitive urban planning, localised forecasting, monitoring, and early warning systems. Furthermore, strengthening institutional capacity and developing effective awareness strategies are crucial for long-term resilience to urban floods.
According to an analysis by the Council on Energy, Environment and Water, 64 per cent of Indian tehsils have experienced an increase of 1 to 15 days in the frequency of heavy rainfall days, particularly in Maharashtra, Tamil Nadu, Gujarat, and Karnataka (CEEW 2023). The consequences for urban systems are severe, ranging from localised flooding to disruptions in essential services such as water supply and healthcare. Over the past two decades, floods have caused the most significant loss of life and property among natural disasters in India. Today, a single flood event can result in damages of INR 8,700 crore (approximately USD 1 billion), with such incidents becoming increasingly frequent (Kumar 2022).
In this context, the flood risk management plan developed with the Navsari Municipal Corporation (NMC) analyses trends in rainfall intensity, frequency, and duration; identifies factors that have the potential to cause or accentuate urban flood risk; computes a ward-level risk index, and presents strategies to mitigate impacts.
Navsari district, carved out of Valsad in 1997, spans approximately 2,211 sq km, making it the 31st largest district in Gujarat. Located along the coastal plains of southeastern Gujarat, it lies near the Purna River and stretches to the Arabian Sea. The district comprises six talukas: Navsari, Jalalpore, Gandevi, Chikhli, Vansda, and Khergam. Its geographical area is classified into three zones: the west coast region, characterised by rocky, shallow lands with pit mounds, and areas with medium to black soils. Irrigation is supported by canals, tubewells, open wells, and lift irrigation. Key crops include paddy, legumes such as pigeon pea (toor dal), black gram (urad dal), vegetables, and fodder (Digital India n.d.b).
The NMC, covering an estimated 43.63 sq km1, was established in January 2025 after the former municipality was upgraded. It governs the city of Navsari, the semi-urban town of Adipur, and six nearby villages. The NMC is responsible for property tax collection, water supply, sanitation, waste management, urban planning, birth and death registration, and public health services. The corporation was established to enhance urban governance and improve civic service delivery across its expanded jurisdiction. At the same time, the state’s urban development department redefined ward boundaries, with NMC now divided into 13 wards.
Navsari lies on coastal plains near the Arabian Sea, with the Purna River cutting across its northern end. Its elevation ranges from 5 to 28 m above mean sea level, and its soil is predominantly black clayey to loamy. The climate is hot and humid, with summer temperatures ranging from 35°C to 41°C. The city receives an average annual rainfall of 1,500 mm, most of which falls between June and September. Humidity levels range from 35 to 85 per cent, peaking during the monsoon and remaining moderate to low for the rest of the year, giving the city a predominantly humid seasonal character (Digital India n.d.a). The NMC is divided into 13 administrative wards, namely - ward 1, ward 2, ward 3, ward 4, ward 5, ward 6, ward 7, ward 8, ward 9, ward 10, ward 11, ward 12, and ward 13.
Figure 1: Map of Navsari district highlighting the area of NMC
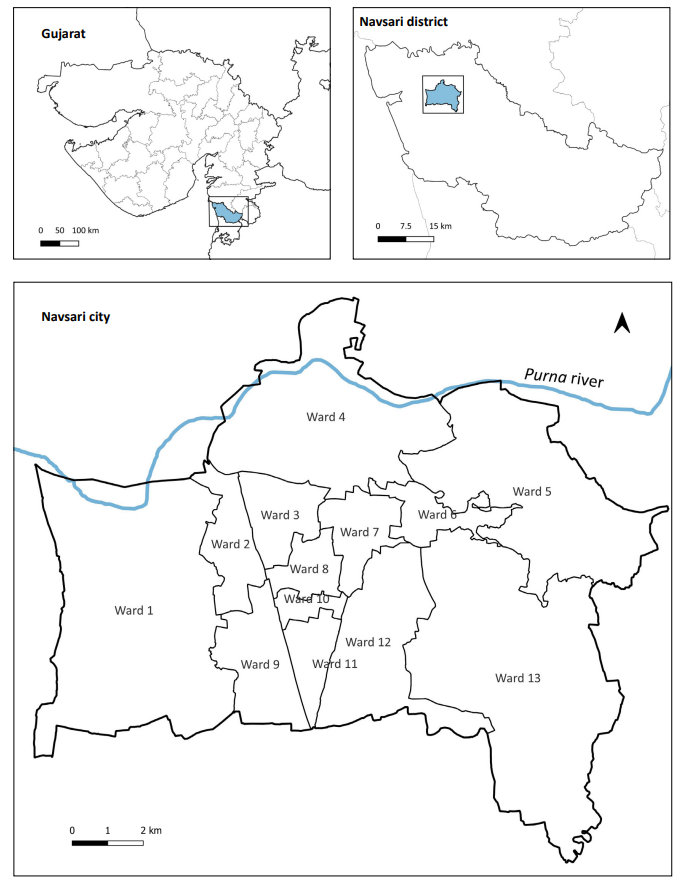
Source: Authors’ compilation
Urban floods occur when a city receives excessive volumes of water due to heavy rainfall, rapid snowmelt, storm surges caused by cyclones or tsunamis, or other causes. This water submerges parts or even the entirety of a city, overwhelming infrastructure and preventing drainage.
Causes of urban flooding
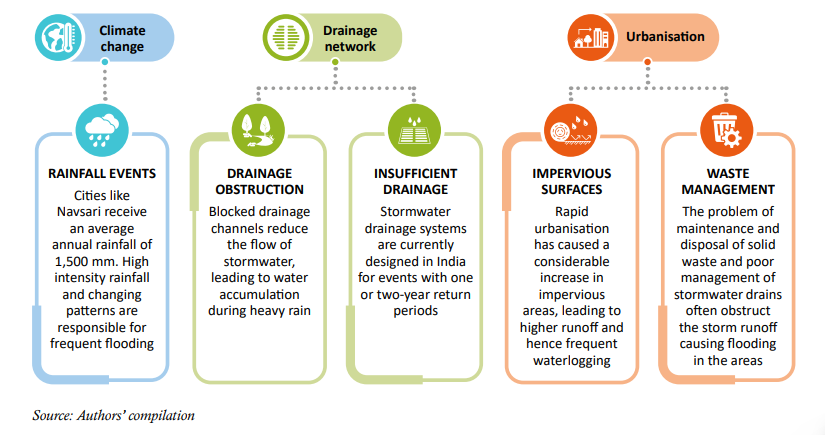
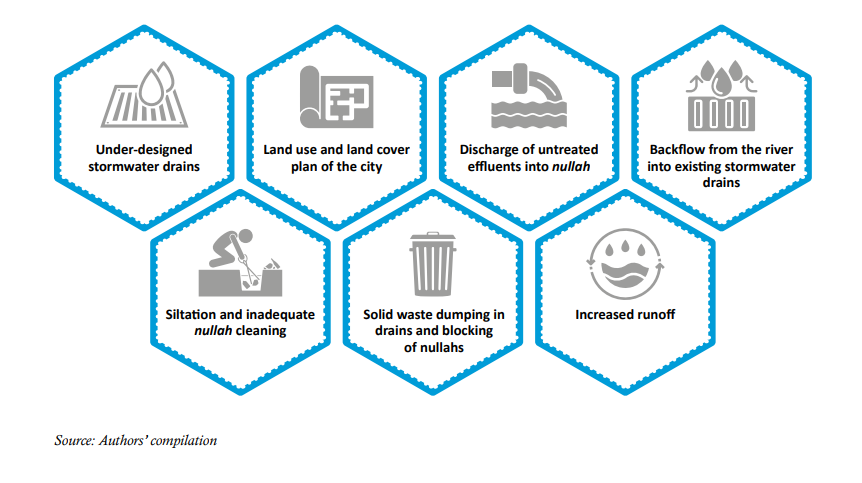
Urban flooding worldwide is a result of a combination of natural and anthropogenic factors (Figure 2), making it a complex challenge to manage. The Intergovernmental Panel on Climate Change (IPCC) highlights the dire consequences of human-induced climate change for the Indian subcontinent, including increased dry spells, a 20 per cent intensification of extreme rainfall, and an exponential surge in heatwaves and cyclonic events. These climate extremes have contributed directly to the growing frequency of flood hazards.
Insufficient drainage infrastructure in urban areas exacerbates flooding during storm events. The climate change–driven intensification of precipitation patterns is leading to more frequent and heavy downpour events that overwhelm the existing urban drainage systems (Wang, Li, and Zhang 2021). Ageing and poor maintenance of the existing drainage system further reduce the capacity of drains to manage rainwater efficiently (Andaroodi et al. 2020). The status of the drainage system in India is provided in Annexure 1.
Figure 2: Urban flooding is caused by multiple interlinked factors
3.2 Status of the stormwater drainage system in Navsari
The NMC reports a total of 180 km of stormwater drains across the municipal area. However, ward-level records maintained by the drainage department account for only 8.9 km and indicate that no separate stormwater drainage exists in four wards. This suggests either the absence of records or inadequate infrastructure in those areas. Since the detailed distribution of the complete 180-km network is unavailable at the ward level, the existing length was proportionally allocated across the nine wards where data exists. The remaining four wards were considered to have no separate stormwater drainage infrastructure, reflecting the current data gaps. These include wards 4, 5, 9, and 13 (Table 1).
| Ward | Stormwater network length (Original, km) | Stormwater network length (Re-scaled, km) |
|---|---|---|
| Ward 1 | 0.66 | 13 |
| Ward 2 | 0.65 | 13 |
| Ward 3 | 0.47 | 10 |
| Ward 4 | 0 | 0 |
| Ward 5 | 0 | 0 |
| Ward 6 | 0.55 | 11 |
| Ward 7 | 1.15 | 23 |
| Ward 8 | 2.03 | 41 |
| Ward 9 | 0 | 0 |
| Ward 10 | 0.66 | 13 |
| Ward 11 | 0.19 | 4 |
| Ward 12 | 2.58 | 52 |
| Ward 13 | 0 | 0 |
| Total | 8.95 | 180 |
Source: Navsari Municipal Corporation. Data in column “Stormwater network length (Original, km)”. Received from the Drainage Department, Navsari Municipal Corporation, 2015-2024.
Note: To achieve a fair ward-wise distribution of the 180 km of stormwater drains reported by the NMC, we employed a simple two-step method. First, in the initial data shared by the drainage department, any ward with a reported length of less than 1 km was rounded up to the nearest whole number (for example, 0.6 km was rounded up to 1 km). This was done to avoid minimal values from skewing the overall proportion. Then, to ensure that the total matched the full 180 km essentially reported by NMC, we scaled the original ward-wise values using the original ward length, multiplied by 180 km (the total stormwater drain length), divided by the sum of all the original ward lengths available in the ward-wise dataset. This approach helped us proportionally distribute the total length across the wards in a balanced manner. Importantly, wards that originally had 0 km of drains were left unchanged and kept as is. This was done to reflect the absence of reported infrastructure, rather than making assumptions where no data existed.
Furthermore, the total drain length of 180 km yields a city-wide average drainage density of just 4.13 km per sq km. In contrast, the estimated natural drainage density across the municipal area, based on catchment characteristics such as natural streams, terrain slope, and existing surface flow patterns, is approximately 4.9 km per sq km. This indicates that natural drainage density is about 18.7 per cent higher than the constructed stormwater drainage density, underscoring a shortfall in engineered capacity to at least align with the area’s hydrological behaviour (Figures 3 and 4).
Figure 3: Catchment characteristics influencing urban drainage patterns include A) slope, B) natural streams, and C) drainage density
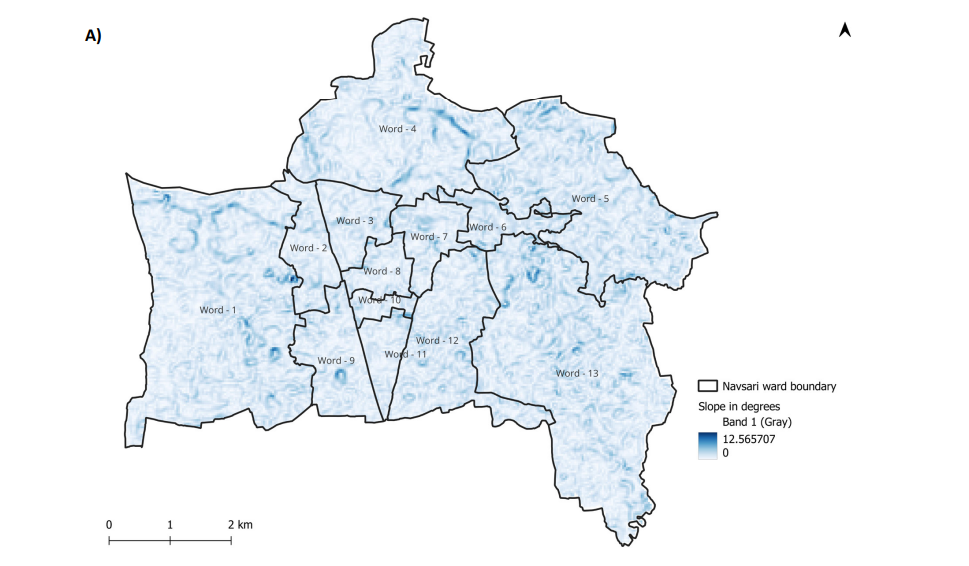
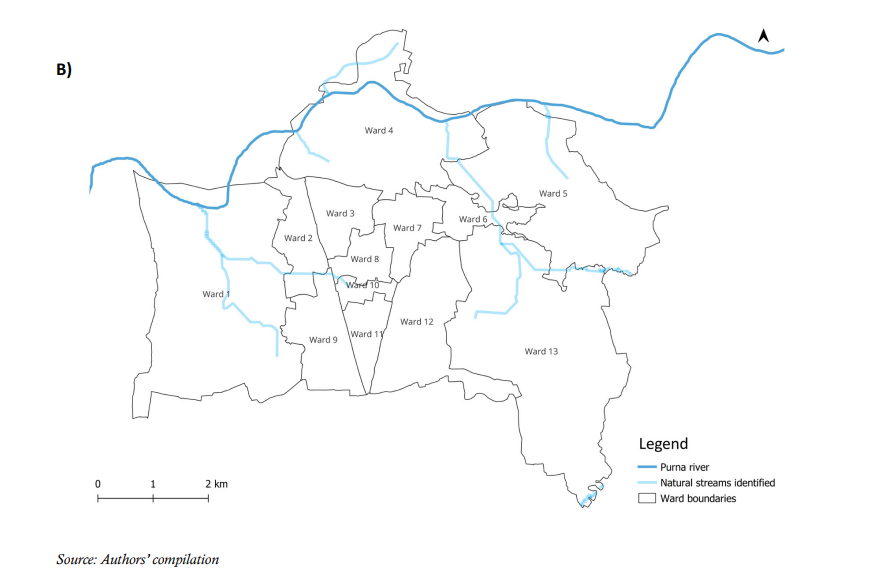
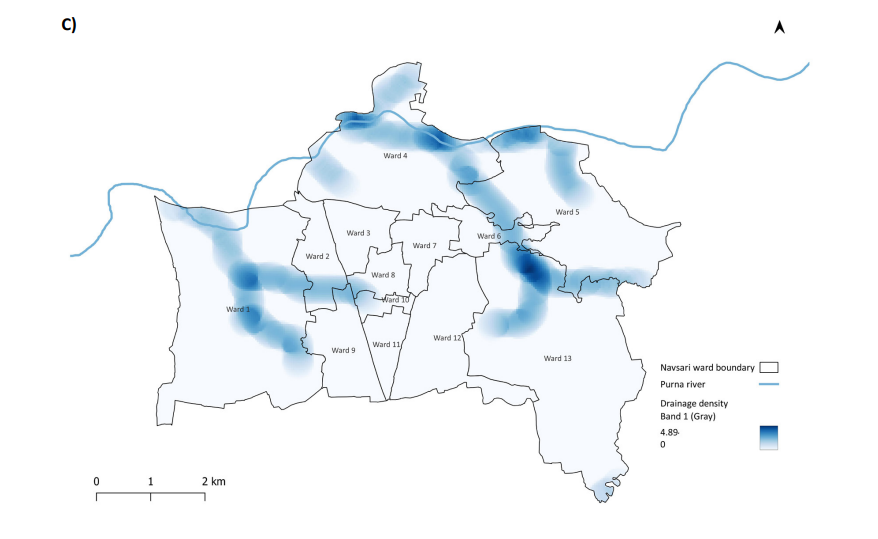
Figure 4: Emerging pressures revealed on the stormwater drainage network within NMC
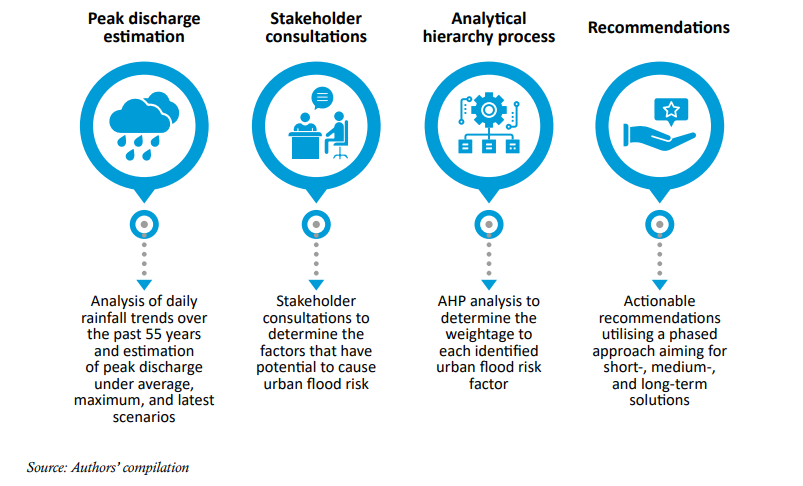
First, a detailed analysis was performed to understand the past and current rainfall patterns in Navsari, accompanied by an IDF analysis of Navsari. The IDF analysis and peak discharge were estimated for a 55-year period (1970–2024), which helped to understand Navsari’s hydrological and drainage dynamics, including inundation mapping. This was followed by the development of an urban flood risk index using the IPCC AR5 assessment framework. Finally, we identified the hotspot regions for urban floods and made recommendations with short-, medium-, and long-term targets (Figure 5).
Figure 5: A four-step approach was adopted to develop the urban flood management plan
Intensity duration frequency (IDF)
To understand the rainfall trends, occurrence of storm events, and flood discharge in NMC, an IDF analysis was undertaken using the methodology presented by Kumar et al. (2022); the details are provided in Annexure 2.
Flood inundation mapping
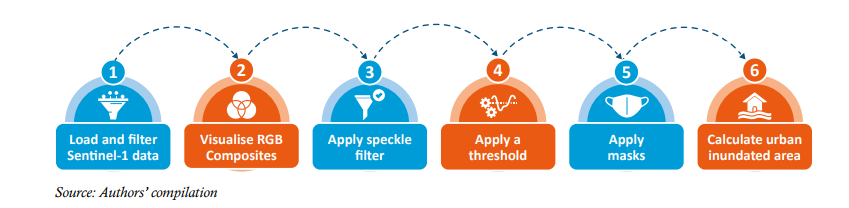
Reliable flood extent data at high spatial resolution remains a critical gap in many regions, particularly for post-event assessments. To address this, we adopted the United Nations Platform for Space-based Information for Disaster Management and Emergency Response (UN-SPIDER) recommended practices, utilising Google Earth Engine (GEE) in conjunction with Sentinel-1 Synthetic Aperture Radar (SAR) data to map flood inundation (UN-SPIDER 2023). This approach has been validated in other contexts – for example, during the 2024 Chiang Rai flood, where change detection between pre- and post-flood SAR images achieved over 93 per cent accuracy in delineating flooded areas (Thammaboribal et al. 2025).
The steps we followed for flood inundation mapping are illustrated in Figure 6. A threshold of –20 decibels (dB) was applied to Sentinel-1 data to detect flooded areas. This value is slightly lower than the typical backscatter of dry land before flooding (–15 dB), which is automatically stored in the GEE platform.
Figure 6: Flood inundation mapping carried out through a series of systematic steps
Development and computation of ward-level urban flood risk index
To assess the ‘where to prioritise action’ component of Navsari’s APFRM, a ward-level urban flood risk index was developed. The index estimates the extent of risk associated with urban floods for each ward based on the computed scores.
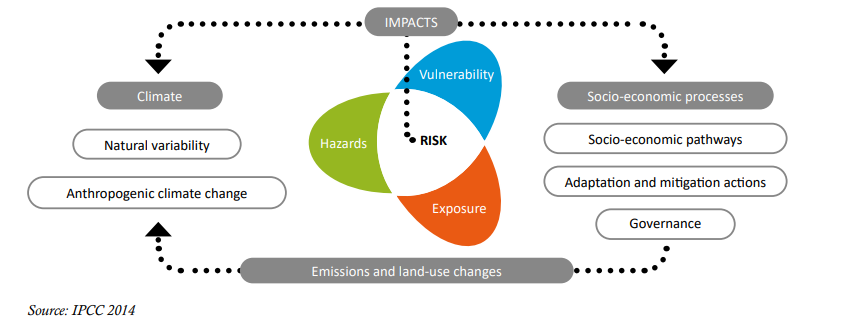
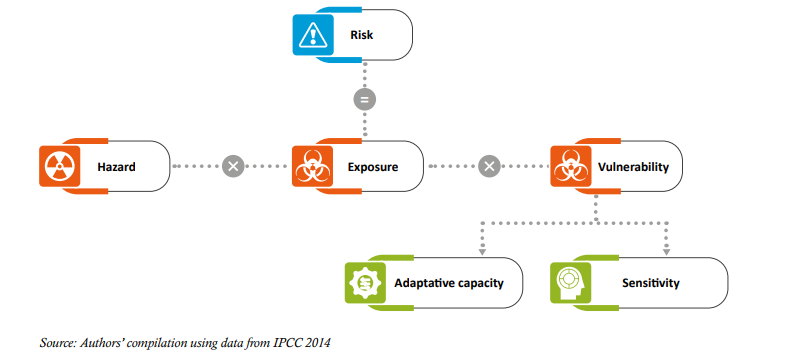
The methodology for developing this index follows the framework of the IPCC Fifth Assessment Report (AR5), which defines risk as the interaction of three components: hazard, exposure, and vulnerability (Figure 7). ‘Risk’ is understood as “the potential for adverse consequences for human or ecological systems, recognising the diversity of values and objectives associated with such systems. In the context of climate change, risks can arise from the potential impacts of climate change and human responses to climate change. Relevant adverse consequences include those on lives, livelihoods, health and wellbeing, economic, social and cultural assets and investments, infrastructure, services (including ecosystem services), ecosystems and species” (IPCC 2014). The components of risk are explained in Annexure 3.
The computation of the ward-level urban flood risk index followed a series of steps (Figure 8). Indicators were first selected under each component, informed by a detailed literature review and broad-based stakeholder consultations. Ward-level data for these indicators were then collected. The indicators were normalised using maxima–minima method to ensure comparability, after which they were reclassified based on their relation (direct or indirect) to the outcome. A detailed list of indicators under hazard, vulnerability, and exposure, along with their relationship to risk, is provided in Annexure 4. Indicators that could not be considered, or for which assumptions were made due to the absence of data or information, are listed in Annexure 4.1.
Figure 7: Components and sub-components of risk as outlined in the IPCC’s AR5 framework
Following this, the Analytical Hierarchy Process (AHP) was employed to assign weights to each indicator (Figure 8). The detailed process and assigned weights are presented in Annexure 5. Composite risk scores were then computed for each ward using the risk equation and classified into five categories: very high, high, medium, low, and very low (Figure 9).
Figure 8: Computing the urban flood risk index via a seven-step process
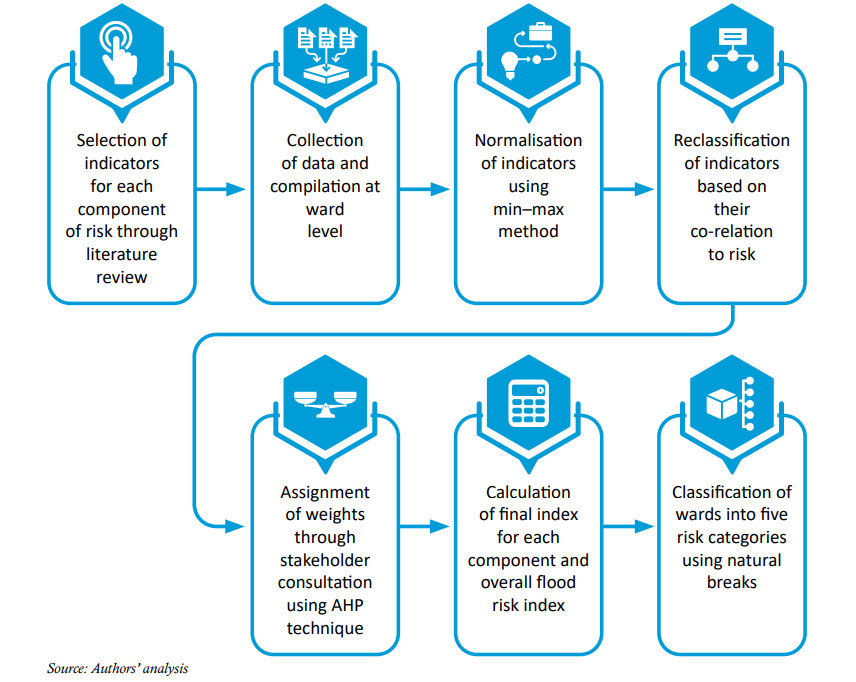
Figure 9: Consultation workshop and meeting with NMC officials
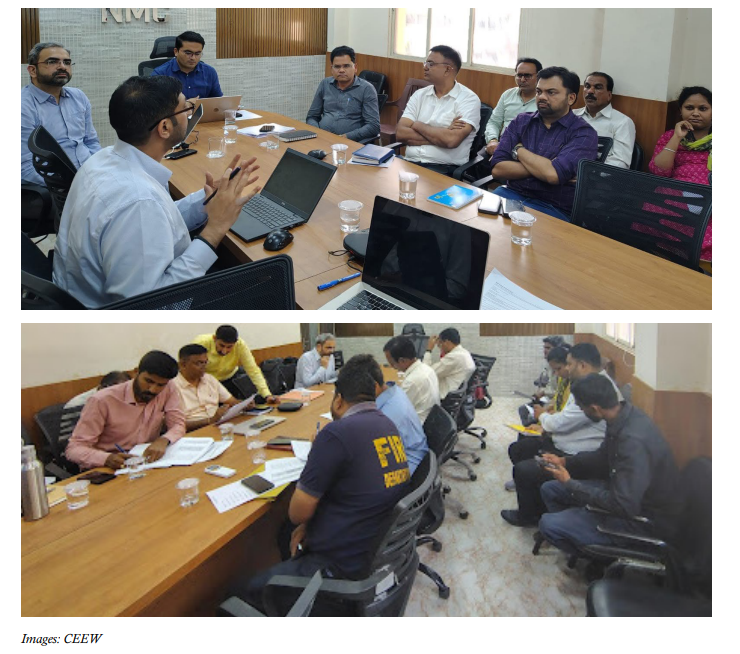
Figure 10: Risk assessment equation
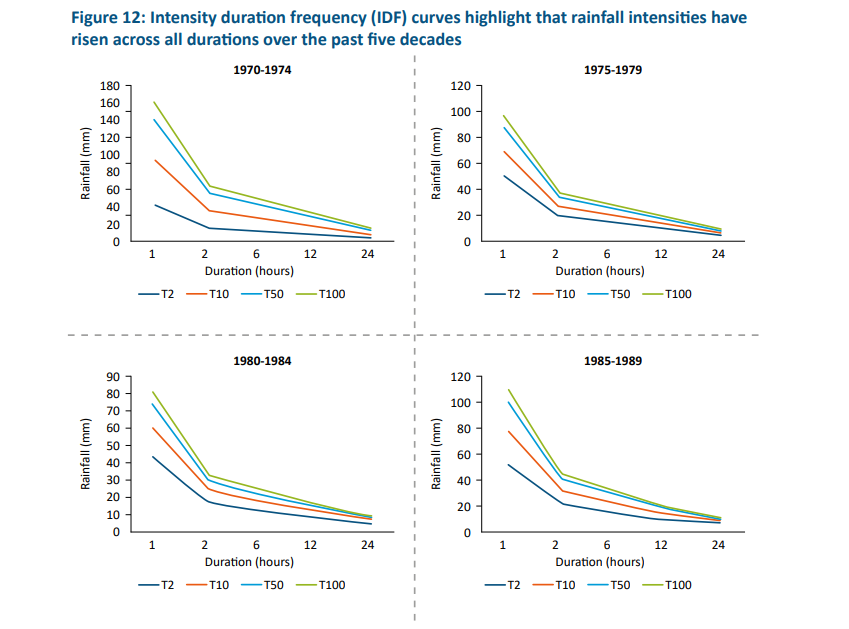
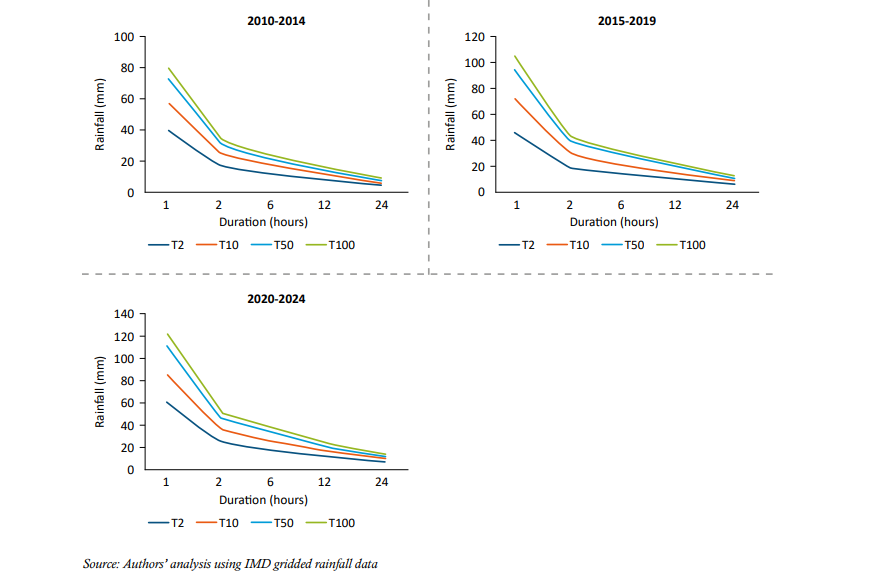
Intensity–duration–frequency curves
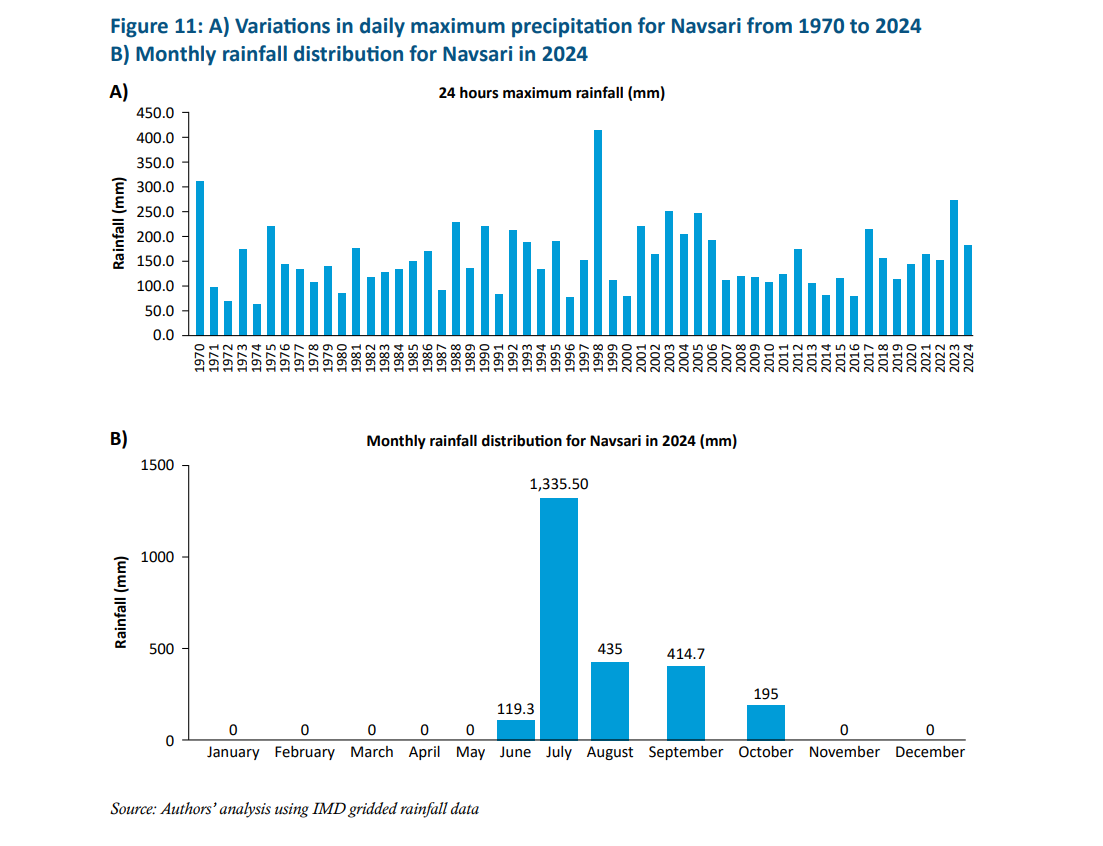
Rainfall in Navsari shows high inter-annual variability. Between 1970 and 2024, the maximum one day rainfall ranged from 72 mm to 417 mm (Figure 11). The variability in daily maximum rainfall, as indicated by the coefficient of variation in rainfall, was estimated to be 42 per cent of daily rainfall. In July 2024, Navsari recorded a total rainfall of 1,335 mm, which is 43 per cent above the normal July average of 561 mm. About 48 per cent of this total fell within a consecutive five-day period, with daily rainfall amounts of 124.92 mm, 102.35 mm, 184.95 mm, 93.09 mm, and 118.22 mm. For a low-lying coastal city, such variability in rainfall is substantial. Hence, there is a need to better prepare for such extreme events.
The IDF curves for the analysed period are presented in Figure 12. The IDF curve was prepared for 1970–2024 as a whole and for five-year blocks of daily maximum rainfall. On average, rainfall intensity was about 51 mm/hr for a one-hour duration with a two-year return period, and 85 mm/ hr for a one-hour duration with a ten-year return period.
Figure 12 shows that each five-year block displays different behaviour, with some periods recording lower rainfall intensities and others markedly higher. The maximum rainfall intensity was 58.74 mm/hr for a one-hour duration with a two-year return period in 1995–1999. For the same block, the one-hour intensity with a ten-year return period reached 126.53 mm/hr. This reflects the impact of the 1998 historical flood caused by Cyclone 03A (Joint Typhoon Warning Center 1998).
For the last five years of the analysis (2020–2024), rainfall intensity was 61.53 mm/hr for a one hour duration with a two-year return period, and 88.72 mm/hr for a one-hour duration with a ten-year return period.
Over the past 50 years, rainfall intensities for short and moderate durations have shown a consistent upward trend in every alternate year, indicating that even frequently occurring rainfall events have become more severe. For instance, the one-hour intensity rose from 44.18 mm in 1970–1974 to 61.53 mm in 2020–2024 – an increase of 17.35 mm. Similarly, the two-hour value increased from 18.55 mm to 25.84 mm, the six-hour value from 13.38 mm to 18.64 mm, the twelve-hour value from 8.43 mm to 11.74 mm, and the twenty-four-hour value from 5.31 mm to 7.40 mm.
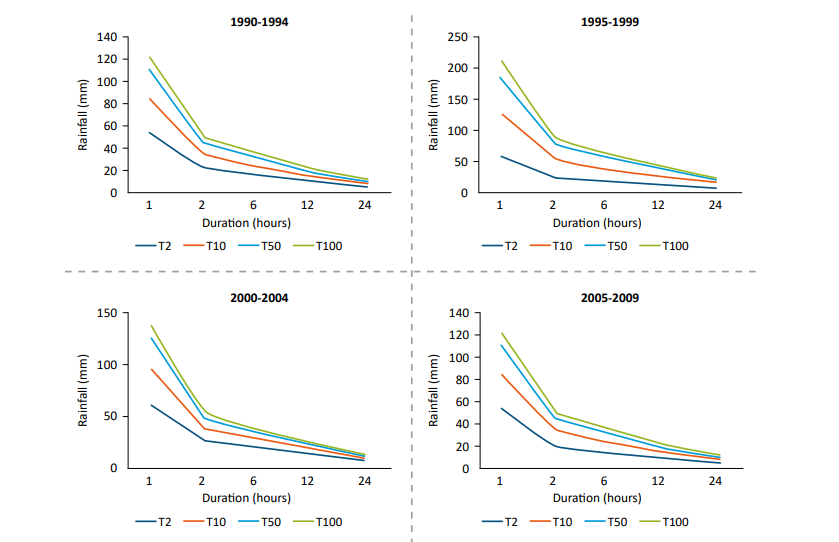
Peak discharge estimation
Following the IDF analysis, peak discharge was estimated to understand the amount of discharge generated during different events and return periods.
The concentration time was estimated as 1.97 hours (approximated to 2 hours), which is the time needed for water to flow from the most remote point in a watershed to its outlet. Based on this, the rainfall intensity corresponding to 2 hours and a return period of 2, 10, 50, and 100 years was considered for estimating the peak flood flow from the total area. For estimation, the entire area under the NMC was considered a watershed. The coefficient of runoff was considered to be 0.72.
The estimated peak discharge for the entire NMC area was about 185 cubic metres per second (cumecs) for a storm with a two-year return period and about 308 cumecs for a storm with a ten year return period. To provide a more nuanced understanding, peak discharge per unit area (in sq km) was compared for different scenarios:
Results are presented in Figure 13 and Table 2.
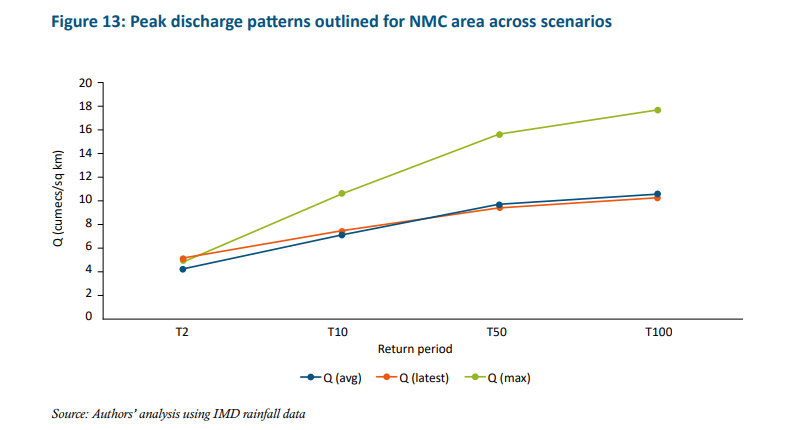
Table 2: Scenario-wise peak discharge per sq km derived for the area within Navsari Municipal Corporation
| Return period | Q (max) 1995-1999 | Q (average) 1970-2024 | Q (latest) 2020-2024 |
|---|---|---|---|
| T2 | 4.93 | 4.27 | 5.17 |
| T10 | 10.63 | 7.12 | 7.45 |
| T50 | 15.63 | 9.61 | 9.46 |
| T100 | 17.74 | 10.66 | 10.30 |
Source: Authors’ analysis using IMD gridded rainfall data
The existing stormwater drain capacity of Navsari remains uncertain, as the city’s recent transition from nagar palika to a municipal corporation necessitates restructuring and detailed capacity audits. As indicated in Table 4, the drainage system needs to be upgraded to accommodate at least a 10-year return period scenario from Q (max), ensuring resilience under both average conditions and latest discharge (Q) trends. For upgrading and expanding the existing stormwater drainage system, we recommend adopting a capacity of 10 cumecs per sq km, which corresponds to the peak discharge in the Q (max) scenario expected once every 10 years.
Extent of flood inundation in Navsari Municipal Corporation
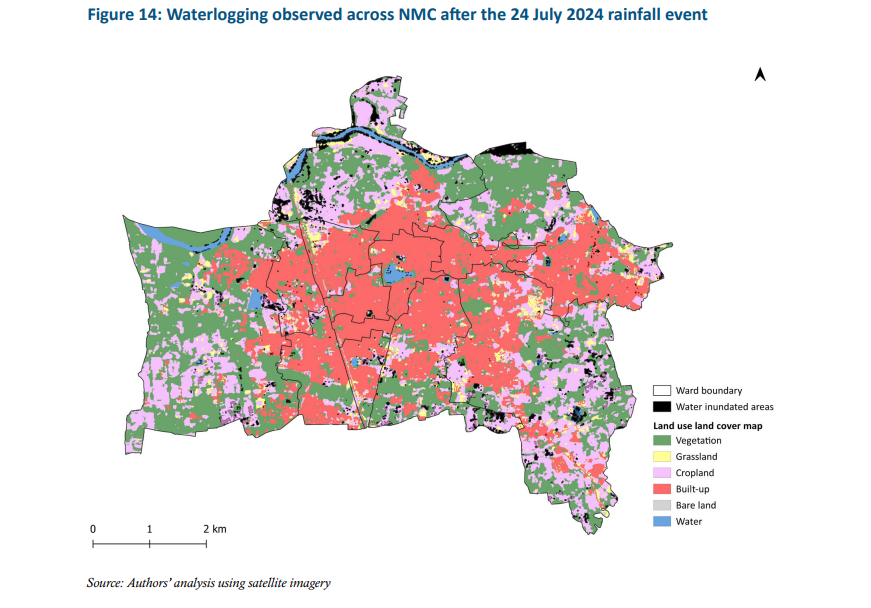
The total inundated area within NMC was estimated using the highest rainfall events of the past two years, for which data were available. Additionally, the major flood event of 24 July 2024 was mapped, during which, nearly 20 per cent of the total NMC area – about 8.725 sq km – was flooded (Figure 14).
In this event, ward 4 recorded the highest flood inundation extent at 4.6 sq km, accounting for 52 per cent of the total inundated area, followed by ward 13 with 1.6 sq km, representing around 20 per cent of the total.
Urban flood risk index
The urban flood risk index was computed at the administrative ward level for NMC. Based on scores, five categories were created using natural breaks: very high, high, medium, low, and very low risk. The range of values from 0 to 1 was classified as follows: very low (0–0.18) and very high (0.57–1). The risk maps and the sub-indices maps are presented in Figure 15.
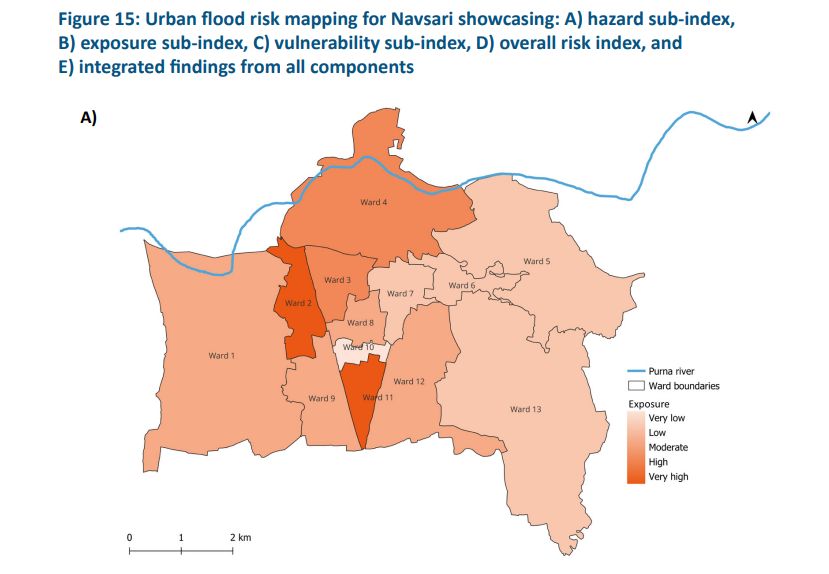
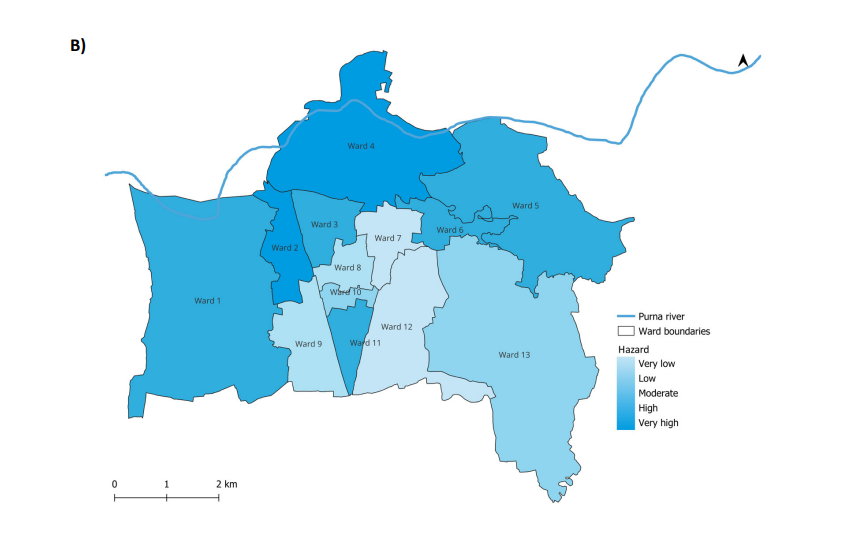
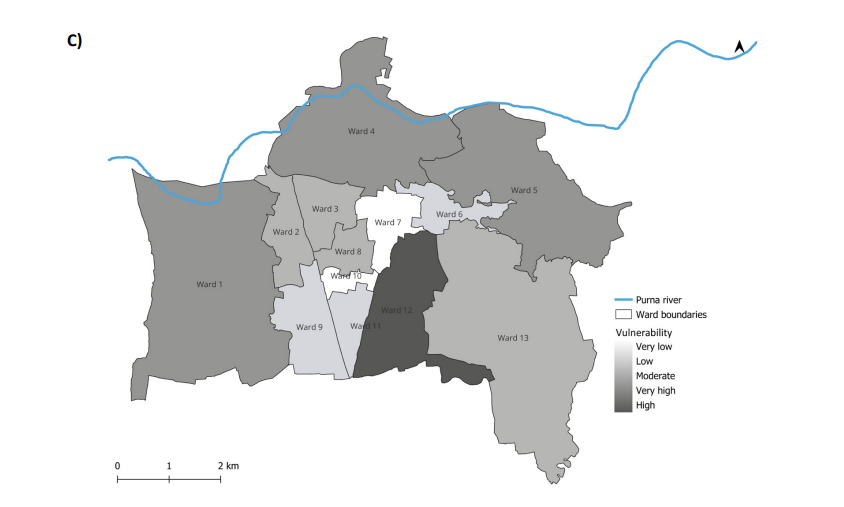
The computations reveal that wards 2 and 4 fall into the very-high-risk category, followed by wards 3 and 11, which are classified as high risk. Ward 1 is classified as moderate to high risk, with a risk score closer to the high-risk category. This is followed by wards 5, 12, and 8. Wards 6, 9, and 13 are in the low-risk category, while wards 7 and 10 exhibit very low risk. Ward-level urban flood risk profiling will enable NMC to prioritise interventions, identify the relevant stakeholders, and determine the types of interventions required for effective flood management.
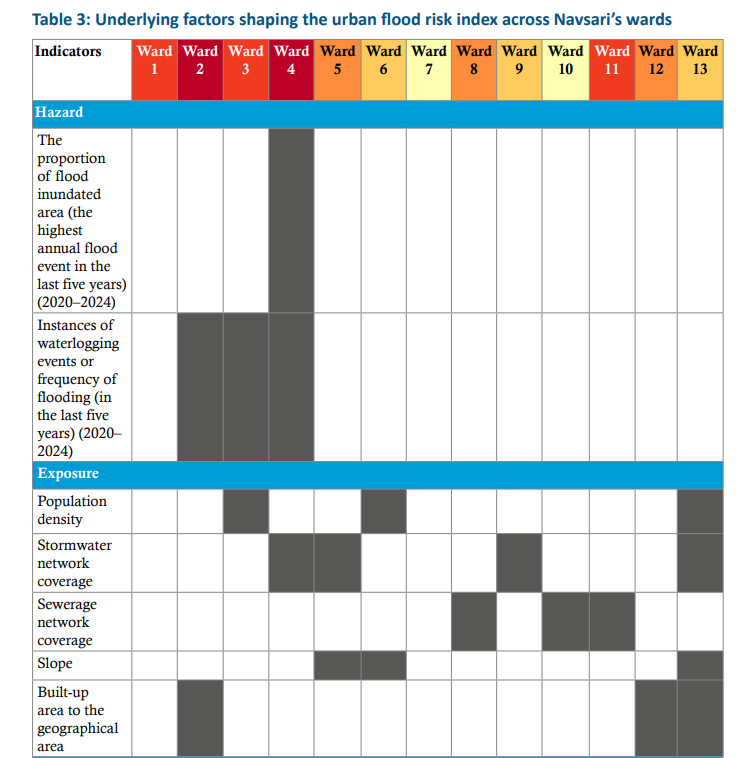
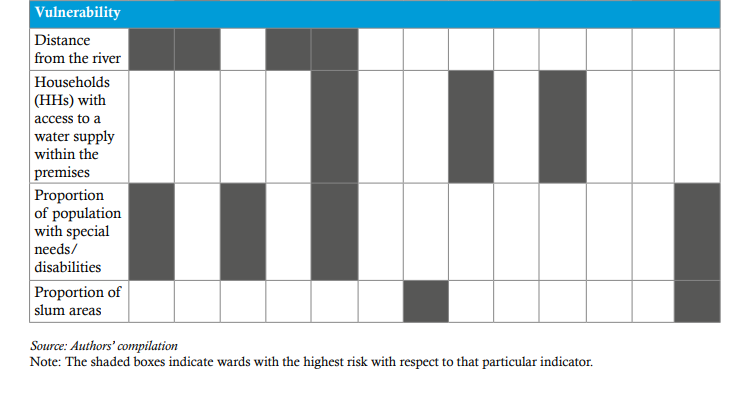
Further, we identified the factors (indicators) responsible for high hazard, exposure, and vulnerability scores for each ward (see Table 3). Hazard levels across wards are primarily determined by the proportion of the area affected by flood inundation. Exposure is closely linked to the absence of upgraded and functional stormwater drainage systems, which increases the likelihood of water accumulation during extreme rainfall. Meanwhile, vulnerability is compounded by several systemic gaps, such as the lack of hazard, risk, and vulnerability assessments (HRVA); limited rainfall monitoring due to missing gauges; the absence of Integrated Command and Control Centres (ICCCs) and emergency operations centres (EOCs), as well as insufficient or under-capacitated emergency shelters. This information provides NMC with the necessary data to identify potential causes of urban flood risks in wards and implement targeted actions to enhance urban flood resilience.
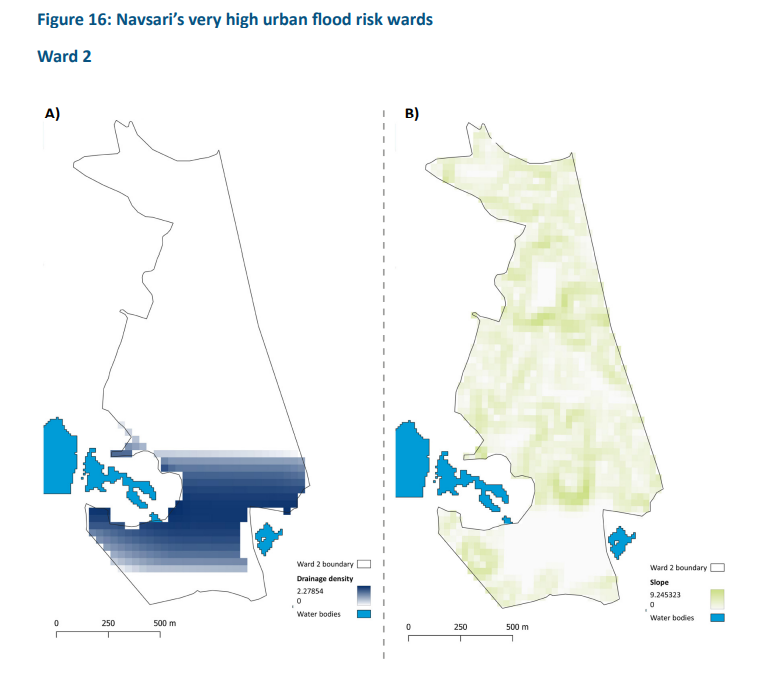
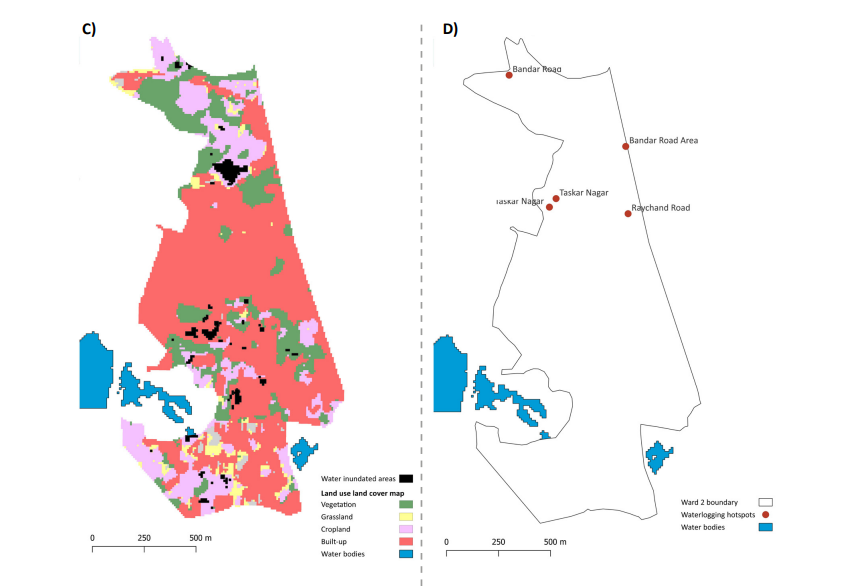
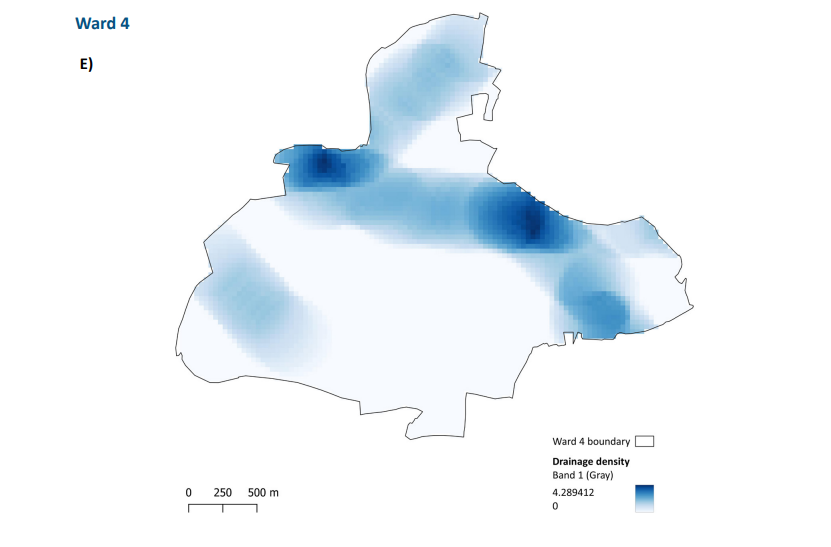
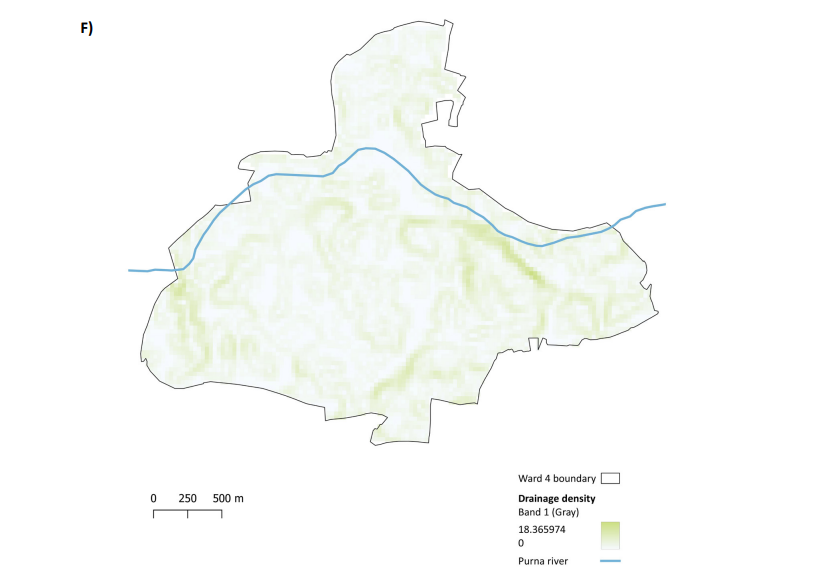
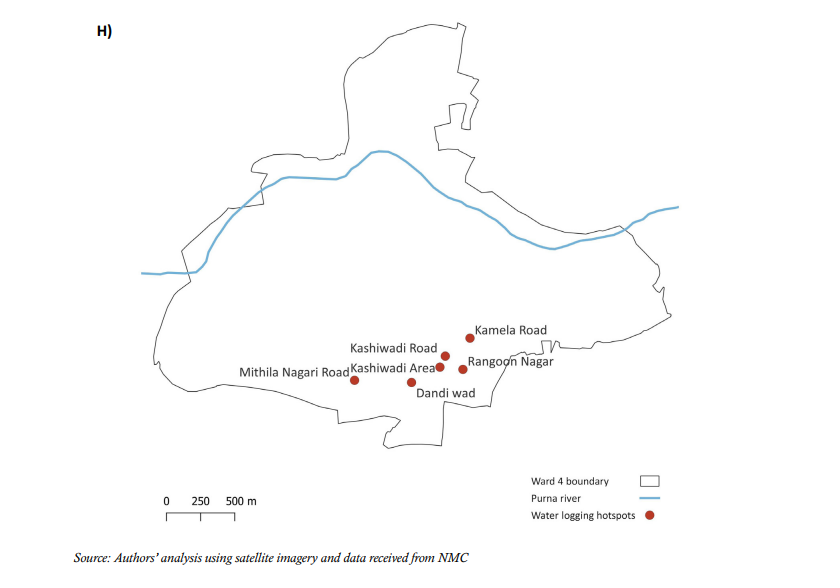
Hotspot analysis
Hotspot analysis was conducted for wards classified as very high flood risk, namely, wards 2 and 4. Waterlogging hotspots were identified using historical flood event data provided by NMC officials. To examine the factors contributing to these hotspots, several maps were generated. These include: natural drainage density; slope; waterlogged/water-innundated areas; water logging hotspots for ward 2 (A-D) and ward 4 (E-H) (Figure 16).
Each spatial layer provides distinct insights. Slope maps identify areas where water is likely to stagnate due to flat terrain, drainage density maps highlight natural flow paths that may cause water buildup, and SAR-based inundation maps depict flooding extents recorded during past events. When combined, these maps enable officials to understand the causes of recurrent flooding in certain areas and guide interventions such as drainage upgrades, desilting, or preventive works (Nardi et al. 2006; Schumann et al. 2009; Zhou et al. 2019a). The analysis could be further strengthened by overlaying stormwater drainage infrastructure, as constructed drainage systems with sufficient capacity are critical to reducing urban flood risk in identified hotspots. These networks function as water-carrying channels that divert excess runoff from an area, underscoring the importance of maintaining an updated repository of such data.

This section of the action plan presents a set of actionable recommendations, which, once implemented, can play a pivotal role in strategising risk mitigation and adaptation at the ward level. The plan follows a three-phase approach, with recommendations specific to each phase. The pre-monsoon phase (December–May) emphasises better planning and preparedness for flood risk reduction. The monsoon phase (June–September) emphasises the importance of an effective flood risk response during a disaster. The post-monsoon phase (October–November) underscores the importance of ensuring effective restoration, reconstruction, and rehabilitation following a disaster.
Each recommendation elaborates on the existing situation within the city, the standards or design guidelines for the interventions, the spatial prioritisation of the interventions, responsibility allocation, and the expected impact of the suggested intervention over the short term (0–2 years), medium term (3–5 years), and long term (more than 5 years).
Phase 1: Pre-monsoon phase
This phase is crucial for preparedness and planning purposes. Both structural and non-structural measures must be implemented to mitigate and adapt to flood risks effectively. The details are presented in Table 4.
| Ensure better planning and preparedness for flood risk reduction | |||
|---|---|---|---|
| Suggested intervention | Current status, standards, and spatial prioritisation for action | Suggested timeline for implementation and responsibility allocation | Likely impacts |
| Install automatic weather stations (AWS) and flood early warning systems (FEWS) | Existing situation None Design guidelines/standard
Spatial prioritisation
|
Time-bound implementation Short to medium term Nodal department Municipal commissioner office |
|
| Conduct hydrological assessments at the catchment scale | Existing situation None Design guidelines/standard
|
Time-bound implementation Short to medium term Nodal department Drainage department Supporting department
|
|
| Suggested intervention | Current status, standards, and spatial prioritisation for action | Suggested timeline for implementation and responsibility allocation | Likely impacts |
|---|---|---|---|
| Spatial prioritisation All wards across the components of risk. |
|||
| Set up an integrated command control centre (ICCC) at the city level and an emergency operation centre (EOC) at the ward level | Existing situation There is no dedicated ICCC at the city level; the corporation depends on data and information received from the district disaster management authority. Spatial prioritisation An ICCC needs to be established at the city level, and an EOC at the ward level, in suitable locations. |
Time-bound implementation Short to medium term Nodal department Municipal commissioner office Supporting department
|
|
| Improve design and enhance the stormwater drainage network | Existing situation
Design guidelines/standard The design capacity should consider a runoff coefficient of up to C = 0.95 and the estimated peak flood flow volume for at least every alternate year. Spatial prioritisation
|
Time-bound implementation Medium to long term Nodal department Drainage department Supporting department
|
|
| Proper operation and maintenance of stormwater drainage systems | Existing situation
|
| Ensure better planning and preparedness for flood risk reduction | |||
|---|---|---|---|
| Suggested intervention | Current status, standards, and spatial prioritisation for action | Suggested timeline for implementation and responsibility allocation | Likely impacts |
Design guidelines/standard
Spatial prioritisation
|
Time-bound implementation Short to medium term Nodal department Drainage department |
|
|
| Enhance sewerage network coverage and set up sewage treatment plants | Existing situation
Spatial prioritisation
|
Time-bound implementation Medium to long term Nodal department Drainage department |
|
| Ensure better planning and preparedness for flood risk reduction | |||
|---|---|---|---|
| Suggested intervention | Current status, standards, and spatial prioritisation for action | Suggested timeline for implementation and responsibility allocation | Likely impacts |
| Ensure industrial units' compliance with the effluent discharge standards | Existing situation
Spatial prioritisation Coordinate with Gujarat Industrial Development Corporation (GIDC) and GPCB and conduct regular audits to ensure compliance with effluent discharge regulations. |
Time-bound implementation Short term Nodal department Regional office (Navsari), Gujarat Pollution Control Board |
|
| Conduct institutional capacity building and awareness generation at a large scale | Existing situation
Spatial prioritisation
|
Time-bound implementation Short to medium term Nodal department Municipal commissioner office Supporting department
|
This will enable the NMC to test emergency preparedness, identify operational gaps, and ensure swift, coordinated actions during actual flood events, thereby minimising response time and potential losses. |
| Ensure better planning and preparedness for flood risk reduction | |||
|---|---|---|---|
| Suggested intervention | Current status, standards, and spatial prioritisation for action | Suggested timeline for implementation and responsibility allocation | Likely impacts |
|
|||
| Carry out a dry run of the flood response contingency plan | Existing situation This is yet to be mainstreamed. Spatial prioritisation Conduct regular or periodic pre-monsoon mock drills involving all relevant stakeholders for better preparedness, planning, and response during the disaster phase. |
Time-bound implementation Short to medium term Nodal department Municipal commissioner office |
|
Source: Author’s analysis using information from NDMA. 2019. National Disaster Management Plan. New Delhi: National Disaster Management Authority, NDMA. 2010. National Disaster Management Guidelines: Management of Urban Flooding. New Delhi: National Disaster Management Authority and consultation with NMC departments.
6.2 Phase 2: Monsoon phase
In the monsoon phase (June–September), prompt action is required for effective flood response. The details are presented in Table 5.
Table 5: Adopting multi-pronged strategy is a key for effective flood response during the monsoon phase
| Ensure effective flood risk response during the monsoon phase | |||
|---|---|---|---|
| Suggested intervention | Current status, standards, and spatial prioritisation for action | Likely timeline for implementation and responsibility allocation | Potential impacts |
| Activate ICCC (monsoon cell) and EOC, and ensure functionality of the AWS and water-level sensors | Existing situation - None Spatial prioritisation Active command control at the city level and EOC at ward levels. |
Time-bound implementation Short term Nodal department Municipal commissioner office Supporting department IT cell |
This will bring city-level flood forecasting and alert systems into mission mode, ensuring a coordinated response and the timely deployment of response and relief measures. |
| Share warning alerts through SMS, social media, and other broadcasting media for wider outreach | Existing situation - None Spatial prioritisation Embed ICCC with social media and other broadcast mediums such as SMS alerts and community radio for wider outreach, in line with the ‘Dos and Don’ts’ guidelines. |
Time-bound implementation Short term Nodal department ICCC under the municipal commissioner office |
This would enhance community preparedness and enables timely evacuation and risk reduction, especially in very-high-risk and high-risk wards. |
| Ensure effective flood risk response during the monsoon phase | |||
|---|---|---|---|
| Suggested intervention | Current status, standards, and spatial prioritisation for action | Likely timeline for implementation and responsibility allocation | Potential impacts |
| Activate emergency drain cleaning action plan for critical drains and install high-capacity pumps in low-lying areas | Existing situation The engineering department is responsible for gutter and pothole cleaning under the Monsoon Action Plan. Design guidelines/standard
Spatial prioritisation
|
Time-bound implementation Short term Nodal department Drainage department Supporting department
|
|
| Risk-based deployment of the rescue team, along with the necessary equipment, at the ward level | Existing situation The fire department is mandated to ensure the functionality of boats, assign staff, and demarcate waterlogging hotspots with ropes under the Monsoon Action Plan. Spatial prioritisation
|
Time-bound implementation Short term Nodal department Fire and emergency services Supporting department
|
|
| Ensure effective flood risk response during the monsoon phase | |||
|---|---|---|---|
| Suggested intervention | Current status, standards, and spatial prioritisation for action | Likely timeline for implementation and responsibility allocation | Potential impacts |
|
|||
| Ensure the functionality of the identified shelter sites and establish makeshift healthcare facilities at relocation sites | Existing situation The drainage department is responsible for maintaining schools and other critical infrastructure under the Monsoon Action Plan. Spatial prioritisation
|
Time-bound implementation Short term Nodal department District disaster management authority (DDMA) Supporting department
|
|
| Restore the functionality of communication lines and transportation routes | Existing situation The light department is mandated to survey and maintain electric poles and growing trees near schools and flood-prone areas under the Monsoon Action Plan. Spatial prioritisation
|
Time-bound implementation Short term Nodal department
|
This will ensure the immediate restoration of key mobility corridors, particularly roads to hospitals, railway stations, and relief centres. |
Source: Authors’ analysis using information from NDMA. 2019. National Disaster Management Plan. New Delhi: National Disaster Management Authority, NDMA. 2010. National Disaster Management Guidelines: Management of Urban Flooding. New Delhi: National Disaster Management Authority, and consultation with NMC departments.
6.3 Phase 3: Post-monsoon phase
In this phase, the focus is on recovery, rehabilitation, and reconstruction to restore affected communities and improve resilience. The details are presented in Table 6.
Table 6: Post-monsoon efforts should prioritise strategic restoration, reconstruction, and rehabilitation planning
| Ensure effective restoration, reconstruction, and rehabilitation during the post-monsoon phase | |||
|---|---|---|---|
| Suggested intervention | Current status, standards, and spatial prioritisation for action | Likely timeline for implementation and responsibility allocation | Potential impacts |
| Prepare and update the ward-level hazard risk and vulnerability atlas (HRVA) | Existing situation NMC updates the City Disaster Management Plan annually. Design guidelines/standard Risk assessment based on the IPCC AR5 framework. Spatial prioritisation
|
Time-bound implementation Short term Nodal department Municipal commissioner office |
|
| Conduct a detailed loss and damage assessment during post-flood events | Existing situation This is yet to be mainstreamed. Design guidelines/standard The values of the indicators adopted in the risk assessment framework (hazard, exposure, and vulnerability), which are based on past flooding events, can guide the development of the baseline for the loss and damage assessment. Spatial prioritisation
|
Time-bound implementation Short to medium Nodal department Revenue department Supporting department
|
|
| Ensure effective restoration, reconstruction, and rehabilitation during the post-monsoon phase | |||
|---|---|---|---|
| Suggested intervention | Current status, standards, and spatial prioritisation for action | Likely timeline for implementation and responsibility allocation | Potential impacts |
| Devise microcredit and micro-insurance services, especially for low-income groups | Existing situation This is yet to be mainstreamed. Spatial prioritisation
|
Time-bound implementation Medium to long term Nodal department Revenue department Supporting department
|
|
| Restore and rehabilitate damaged public infrastructure | Existing situation This is yet to be mainstreamed. Spatial prioritisation
|
Time-bound implementation Short to medium term Nodal department Public works department Supporting department
|
|
Source: Authors’ analysis using information from NDMA. 2019. National Disaster Management Plan. New Delhi: National Disaster Management Authority, NDMA. 2010. National Disaster Management Guidelines: Management of Urban Flooding. New Delhi: National Disaster Management Authority, and consultation with NMC departments
6.4 Cost estimation of structural intervention for flood risk management
The interventions recommended across each phase of the flood risk management plan are categorised into hard and soft measures. Efforts have been made to quantify specific complex interventions and provide tentative cost estimates (Table 7) to support the NMC in assessing the level of investment likely required for implementing key recommendations in the plan.
Table 7: Effective flood risk management plan underlines the need for dedicated investment plan
| Intervention | Phase of intervention | Duration | Present unit cost | Estimated present cost (Requirement based on recommendations) |
Assumptions (if any) |
|---|---|---|---|---|---|
| Installation of automatic weather stations (AWS) and flood early warning systems (FEWS) | Pre-monsoon | Short to medium term | Automatic weather station (AWS) INR 8–10 lakh |
Automatic weather stations (AWS) INR 64 lakh–1 crore |
Automatic weather stations (AWS)
|
| Intervention | Phase of intervention | Duration | Present unit cost | Estimated present cost (Requirement based on recommendations) |
Assumptions (if any) |
|---|---|---|---|---|---|
| Flood early warning system (FEWS) INR 88,000–1 Lakhs |
Flood early warning system (FEWS) INR 4,40,000–5 lakhs |
Flood early warning systems (FEWS)
|
|||
| Improve design and enhance the stormwater drainage network | Pre-monsoon | Medium to long term | Cost of laying down the drainage line INR 15,000–18,000 per metre |
Total cost of laying down the drainage network INR 315–378 crore (approx) Assumption and calculation Total drainage network = Total road length = 390 km (approx) Existing drainage network = 180 km Remaining = 390-180 = 210 km Unit cost = INR 2,350–2,950 per metre Total estimated cost = (210*10^3*2, 350) to (210*10^3*2, 950) |
Pipe specification is suggested to handle the peak discharge (Q) of 10 cumecs per sq km (Section 5.2) for a 1.82-degree average slope. The following assumptions were considered for laying down the drainage line. Pipe diameter: 1,400 mm Material: RCC NP3 (reinforced cement concrete, non-pressure class 3): Standard for underground stormwater/sewer drains Depth of trench: 1.5 to 2.0 m (moderate depth typical for city drainage) Bedding material: Sand bedding Location type: Urban area (includes bituminous road cutting and restoration) |
| Intervention | Phase of intervention | Duration | Present unit cost | Estimated present cost (Requirement based on recommendations) |
Assumptions (if any) |
|---|---|---|---|---|---|
| Includes: Excavation, pipe cost, laying, jointing, backfilling, and road reinstatement |
|||||
| Enhance sewerage network coverage and set up a sewage treatment plant | Pre-monsoon | Capital expenditure (CAPEX) INR 1.56 crore per MLD Operation and maintenance (O&M) cost INR 18–20 lakh per MLD per year |
Capital expenditure (CAPEX) INR 10 crore Operation and maintenance (O&M) cost INR 5.2–5.8 crore per year |
Capital expenditure (CAPEX)
|
Source: Authors’ analysis using data and information from NMCG. 2010. “Sewage Treatment in Class I Towns: Recommendations and Guidelines.” New Delhi: National Mission of Clean Ganga (NMCG), Ministry of Jal Shakti (MoJS), GWSSB. 2022. “Schedule of Rates 2022-23.” Gandhinagar, Gujarat: Gujarat Water Supply and Sewerage Board, Mumbai live. 2024. “60 New Automatic Weather Stations Installed across Mumbai - Here’s All You Need to Know.” Mumbai Live. April 2024.
This section reviews funding provisions in existing national missions, explores various public private partnership (PPP) models essential for developing flood-resilient infrastructure, and outlines a framework for integrating climate and disaster risk to build resilient PPP infrastructure.
Funding provision for flood risk management
Ongoing programmes of the Indian government that can fund flood-resilient infrastructure projects include Atal Mission for Rejuvenation and Urban Transformation 2.0 (AMRUT 2.0), Flood Management and the Border Area Programme (Table 8). Additionally, we recommend incorporating flood-proofing measures in all critical infrastructure projects and mainstreaming them into state level programmes to ensure adequate budgetary allocations at the ULB level. We also recommend the creation of special-purpose vehicles for the development of flood-resilient infrastructure. ULBs should also explore PPP-based financial models to implement flood-resilient infrastructure projects, which can enable effective risk sharing, distributed responsibility, and optimum utilisation of limited financial resources.
Table 8: Fund allocation and fund-sharing arrangements of national schemes for flood risk response and mitigation
| Schemes | Objectives and targets (if any) | Fund allocation | Fund sharing arrangement (centre: state) |
|---|---|---|---|
| Flood Management and Border Area Programme (FMBAP) | FMBAP enables the state/UT governments to provide a reasonable degree of protection against floods/ erosion by adopting structural measures in critical flood-/ erosion-prone areas. |
|
60:40 |
| Schemes | Objectives and targets (if any) | Fund allocation | Fund sharing arrangement (centre: state) |
|---|---|---|---|
| AMRUT 2.0 |
|
|
25:75 (except for projects under PPP mode) |
| 15th Finance Commission |
|
SDRMF
|
For both SDRF and SDMF, 75:25 |
Source: Authors’ analysis using data from MoHUA. 2021. “Atal Mission for Rejuvenation and Urban Transformation 2.0 AMRUT 2.0 Making Cities Water Secure Operational Guidelines.” New Delhi: Ministry of Housing and Urban Affairs (MoHUA), Government of India (GoI); NDMA. 2021. “National Disaster Risk Management Fund (NDRMF) and State Disaster Risk Management Fund (SDRMF).” Disaster Management Division, Ministry of Home Affairs, Government of India.
Financial models
Alongside conventional funding mechanisms, innovative financing tools for flood-resilient infrastructure projects can be highly beneficial. The National Green Credit Programme (MoEFCC 2023) offers credits for voluntarily adopting environmentally friendly practices, including wastewater treatment and reuse. The private sector can also be approached to invest in the projects under their corporate social responsibility (CSR) obligations. For instance, Hindustan Zinc Limited (HZL) contributed to Udaipur’s water management by establishing a 60 MLD STP as part of its CSR obligation. The treated used water (TUW) from this plant is mainly reused in HZL’s industries.
Other innovative financial models are also crucial for effective implementation. The hybrid annuity model (HAM), introduced by the National Mission for Clean Ganga (NMCG), encourages private sector investment in used water treatment infrastructure. Under this model, government payback is linked to the plant’s performance in terms of adherence to pre-defined key performance indicators. Similarly, different PPP models can be leveraged by ULBs to develop flood-resilient infrastructure, such as TUW reuse projects, stormwater drainage infrastructure, and hydrological observation and flood forecasting systems. The PPP models can also be utilised to flood-proof critical infrastructure, including transport, healthcare, urban housing, allied infrastructure, and other urban systems. Table 9 provides various PPP models, highlighting the roles and responsibilities of public and private sector, risk-sharing arrangements, and their tentative applications in flood-resilient infrastructure.
Table 9: Catalogue of public–private partnership (PPP) models that can be leveraged for developing flood-resilient infrastructure with active private-sector participation
| PPP model | Role of the public sector | Role of the private sector | Risk-sharing arrangement | Applicability in flood risk management |
|---|---|---|---|---|
| Service contract |
|
|
Public sector:
|
Short-term services like:
|
| O&M contract |
|
|
Public sector:
|
Medium-term contracts for:
|
| DBFOT (Design–Build–Finance–Operate–Transfer) |
|
|
Public sector:
|
End-to-end delivery of extensive flood infrastructure, such as:
|
| BOT (Build–Operate–Transfer) HAM (Hybrid Annuity Model) |
|
|
Public sector:
|
Suitable for flood control infrastructure and flood proofing of critical assets, where partial public funding is feasible |
| DBFOO (Design–Build–Finance–Own–Operate) |
|
|
Public sector:
|
Emerging AI and machine learning models for digital flood monitoring systems and flood-risk analytics platforms, where ownership may remain private |
Source: Authors’ analysis using information from Department of Economic Affairs. 2023. “Reference Guide for PPP Project Appraisal.” New Delhi: Infrastructure Finance Secretariat, Ministry of Finance, Government of India.
The PPP model mentioned in Table 9 falls under different PPP categories, depending on the extent of private-sector participation and the sharing of risk, obligation, and ownership (ROO) between the public and private sectors.
Figure 17: Categorisation of PPP models based on the extent of private-sector participation
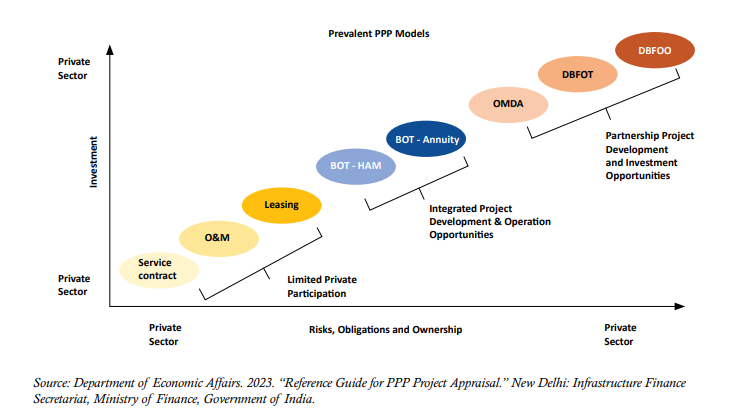
This would serve as a reference for NMC to enter PPP arrangements for flood-resilient infrastructure projects, depending on their local context and the ability to share ROOs.
The Navsari City Action Plan for Flood Risk Management is the first of its kind for the city. While a comprehensive assessment was undertaken to recommend flood management interventions, specific nuances require further detailing and should be considered in future revisions of the plan. These include:
The action plan adopts a three phase framework consisting of pre-monsoon (preparedness and planning), monsoon (response), and post-monsoon (recovery and rehabilitation) stages. Within this structure, specific actions are assigned to nodal departments with clear responsibilities and support from allied agencies. The plan also integrates cost estimates and identifies potential funding sources, including central schemes and public-private partnership models, to enable sustained implementation.
The plan suggests leveraging ongoing government programmes such as AMRUT 2.0 and the flood management and border area programme, along with allocations under the 15th Finance Commission’s disaster risk funds. In addition, public-private partnership models such as hybrid annuity, design-build-finance-operate, and service contracts are recommended to mobilise private sector investment in flood-resilient infrastructure and early warning systems.
The key takeaway is that Navsari now has a clear, evidence-based roadmap that shows which areas are most at risk, what actions need to be taken, and who should take responsibility. It turns scattered efforts into a structured approach, giving the city a practical way forward to handle floods more effectively in the years ahead.
The Indian Subcontinent and the Water CycleFrom Monsoon to Ocean

Water, Nature, Progress: Solutions for a New India
India and the GulfA New Strategy for Water, Energy, Food, and Ecosystem Security
Scaling Climate-smart Micro-irrigation in Gujarat