Council on Energy, Environment and Water Integrated | International | Independent
Suggested citation: Kale, Ajinkya and Akanksha Tyagi. 2025. How Much Does It Cost to Recycle a Solar Module in India? New Delhi: Council on Energy, Environment and Water.
India’s rapidly increasing solar waste is emerging as a critical challenge for its waste management system. Simultaneously, the country’s expanding solar manufacturing sector is increasing demand for raw materials, most of which are imported. Adopting a circular economy strategy through solar module recycling can address twin issues of reducing waste and import dependence. Currently, commercial module recycling is limited in the country. A comprehensive financial assessment of this sector is crucial to evaluate the associated costs and identify potential revenue opportunities for recyclers.
The study proposes targeted actions for policymakers, technology providers, and cell and module producers to establish a cost-effective, reliable and robust recycling industry, thereby creating a circular solar industry.
India is projected to generate approximately 11,221 kilotonnes (kt) of cumulative solar PV module waste by 2047 (Tyagi et al. 2025). Such high volumes of waste pose a significant challenge for waste management in the country. At the same time, India is rapidly expanding its solar manufacturing ecosystem including modules, cells, wafers, and polysilicon. This in turn increases the demand for raw materials, most of which are currently imported. A circular economy approach, which involves recycling solar PV modules, can help address these twin issues of waste management and rising material demand. A study by the Council on Energy, Environment and Water (CEEW) shows that recycling solar module waste can address approximately 60 per cent of the demand for silicon, 50 per cent for aluminium, 44 per cent for copper, 40 per cent for glass, 38 per cent for silver, 15 per cent for tellurium, and 13 per cent for cadmium by 2047 (Tyagi et al. 2025). This would reduce the dependence on material imports and support domestic production for raw materials required for solar PV manufacturing.
However, the commercial recycling of solar PV modules is still in its early stages worldwide, with only a few recyclers operating in countries such as Germany, Italy, France, Japan, South Korea, Australia, and the United States of America (USA). The main challenges include the lack of local markets for secondary materials, problems associated with reverse logistics, and the limited potential of current recycling technologies, leading to high costs and low revenues (IEA PVPS 2022).
In India, the Ministry of New and Renewable Energy (MNRE) has launched an innovation challenge to support the development and demonstration of various circular strategies (MNRE 2025). Furthermore, numerous research and development initiatives in recycling technologies, led by multiple research institutions and industry players, are ongoing (Prasad et al. 2023, First Solar 2025). These institutes have developed technologies capable of recovering minerals such as silicon, silver, and copper from solar modules (D. C. Sah 2022, D. C. Sah 2023).
First Solar, a leading manufacturer of thin-film solar Methodology modules, has established an in-house recycling facility at its manufacturing plant in Chennai, India, with an annual processing capacity of 9,514 tonnes.
While these developments serve to establish a solar module recycling industry in India, the industry’s growth remains constrained. One of the primary obstacles is a lack of robust assessments in India of the financial requirements and potential returns of operating a commercial-scale recycling plant. Having a clear understanding of the costs and revenues can empower stakeholders to make informed decisions and support the growth of this emerging industry.
This study presents a first-of-its-kind financial analysis of solar module recycling in India, including a detailed assessment of the various costs and financial benefits. The assessment is designed to support the government and private sector in developing effective policy and market instruments to promote the recycling of PV modules. The findings can also aid in designing suitable incentives for the solar module recycling market to support private-sector players in developing workable business models. Ultimately, this comprehensive and comparative assessment aims to inform research and investment in scaling up efficient recycling technologies.
The recycling cost–benefit assessment is divided into three parts. We first estimate non-recurring costs1 , or the initial investment, followed by recurring2 or operational costs, and finally, the benefits from the sale of recovered materials. The assessment draws on granular solar waste generation profiles, infrastructure requirements, and the recovery rates of various recycling technologies to estimate the costs incurred and the financial benefits that can be accrued from recycling solar modules.
We modelled two recycling pathways for the cost–benefit assessment. Each pathway employs different recycling techniques, resulting in the recovery of distinct materials.
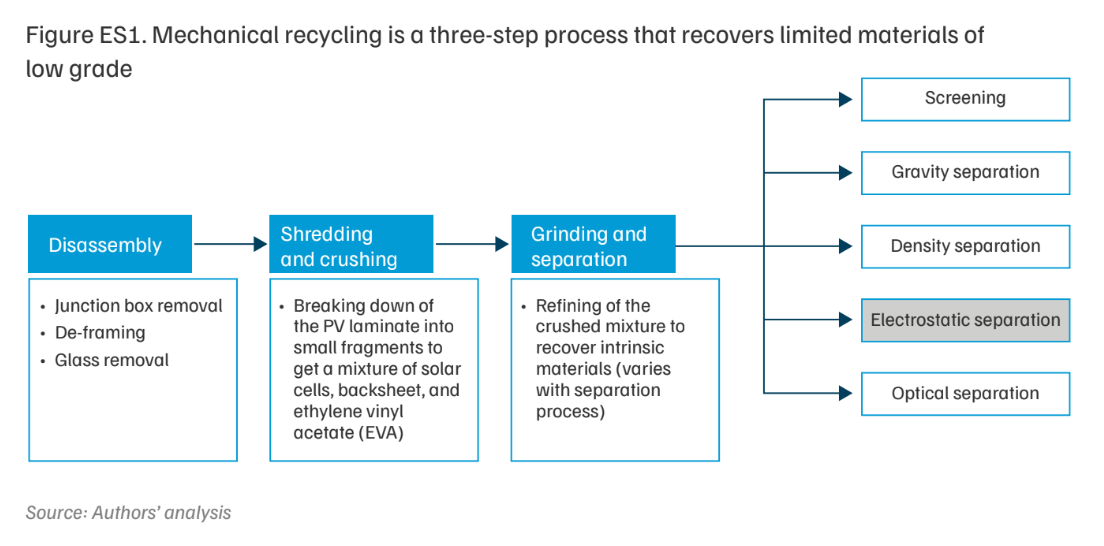
Pathway 1 (P1)–mechanical recycling: In this pathway, mechanical operations are used to recover materials from solar modules (Figure ES1). Various methods are available to separate the refined mixture after the grinding process. For this study, we consider electrostatic separation for the separation and recovery of individual materials (highlighted in Figure ES1). P1 is able to recover aluminium, glass, copper and silicon. However, silver is not recovered by this process.
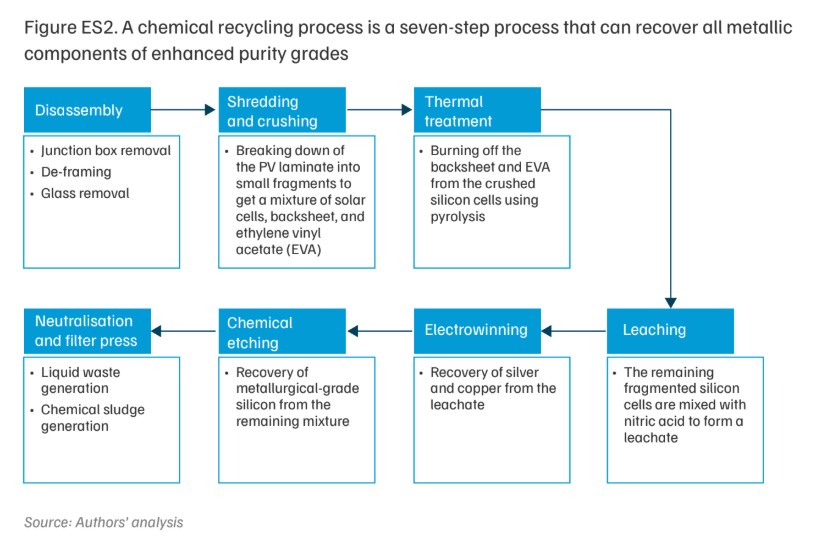
Pathway 2 (P2)–chemical recycling: This pathway involves the use of mechanical and chemical recycling processes to recover materials from solar modules (Figure ES2). P2 is able to recover all major materials from the module including silver (Table A1).
Insights from the financial analysis are used to recommend which recycling technologies to prioritise, which materials to recover, and which support mechanisms to invest in to create a viable recycling model.
Assessing the costs and benefits of solar module recycling is essential for developing a circular solar industry. All stakeholders must collaborate to establish a recycling industry that is robust, sustainable, and economically viable. We recommend the following actions for key stakeholders.
Policymakers should undertake the following measures:
The Ministry of Environment, Forest and Climate Change (MoEF&CC) should lead this effort in consultation with solar cell and module producers as well as recyclers.
Technology providers should undertake the following measures:
Solar cell and module producers should undertake the following measures:
Recycling discarded solar modules is imperative for both environmental and economic reasons. With its ambitious deployment targets, India is projected to generate about 11,221 kilotonnes (kt) of solar waste by 2047 (Tyagi et al. 2025). India regulates solar waste under the E-Waste (Management) Rules, 2022. The rules mandate that solar cell and module producers store their waste until 2034– 2035, as per guidelines issued by the Central Pollution Control Board (CPCB) (MoEF&CC 2022). There is no obligation for producers or recyclers to collect, refurbish, recycle, or recover the stored waste. Box 1 provides an overview of the E-Waste (Management) Rules, 2022.
The Ministry of Environment, Forest and Climate Change (MoEF&CC) brought solar waste into the ambit of the Electronic Waste (Management) Rules in 2022 (MoEF&CC 2022). These rules have been in effect across India since 1 April 2023. According to the rules, every manufacturer and producer of solar photovoltaic (PV) modules, panels, or cells must store the solar waste generated until 2034–2035. They must also register on the Extended Producer Responsibility (EPR) Portal for E-Waste Management and comply with the standard operating procedures and guidelines provided by the CPCB.
In September 2024, the MoEF&CC released the Environmental Compensation (EC) Guidelines under the E-Waste (Management) Rules, 2022 (CPCB 2024a). These guidelines impose EC in case of non-compliance by registered producers, recyclers, and refurbishers of e-waste. The rules recognise four end products of recycling e-waste (key metals) for generating and trading EPR certificates. These metals are classified into three groups: precious metals (gold), non-ferrous metals (copper and aluminium), and ferrous metals (iron). Further, for solar PV modules and cells, the average percentage composition of key metals by weight is 13 per cent aluminium and 1 per cent iron (CPCB 2024b). Although solar modules also contain copper, at present, EPR certificates can only be exchanged for aluminium and iron recovered from solar cells and modules.
The lowest and highest prices for exchanging EPR certificates are equivalent to 30 per cent and 100 per cent of the EC, respectively. The EC is determined in two ways, as per the guidelines–by the end product or by the electrical and electronic equipment (EEE) category. The exchange prices of EPR certificates, as per the end products for all four metals, are provided in Table A. Table B provides the exchange prices of EPR certificates for the EEE item category, which includes consumer electrical and electronics, and photovoltaic panels (CEEW14).
According to the guidance document for the generation and transfer of EPR certificates, these EPR certificates are generated by the CPCB through the EPR portal for registered recyclers (CPCB 2024c). The quantity eligible for generation depends on the amount of e-waste recycled. Recyclers must upload details of the e-waste collected and recycled, as well as the key metals produced and sold, to the EPR Portal for E-Waste Management to generate the required EPR certificates. Recyclers can then sell these certificates to producers to fulfil their EPR obligations. Currently, EPR targets do not apply to waste generated from solar PV modules, panels, or cells; therefore, manufacturers have no EPR obligations (MoEF&CC 2022).
In June 2025, the CPCB also issued Draft Guidelines for Storage and Handling of Waste Solar Photovoltaic Modules or Panels or Cells under E-Waste (Management) Rules, 2022 (CPCB 2025). They provide guidance on transporting, handling, and storing solar waste and its components, consumables, parts, and spares in an environmentally safe and sound manner.
Table A. EPR certificate cost as per the end product (key metal) recovered
| Gold (INR/gm) | Copper (INR/kg) | Aluminium (available for solar) (INR/kg) | Iron (available for solar) (INR/kg) | |
|---|---|---|---|---|
| Lowest | 772 | 562 | 30 | 136 |
| Highest | 2,575 | 1,875 | 101 | 456 |
Source: Authors’ compilation from CPCB 2024a
Table B. EPR certificate cost as per EEE item category–CEEW
| EPR certificate cost (INR/kg) | |
|---|---|
| Lowest | 22 |
| Highest | 74 |
Source: Authors’ compilation from CPCB 2024a
Recycling solar modules can strengthen domestic industries and national energy security. As of 2023, China dominated the manufacturing of all components of the solar PV value chain, including polysilicon (83 per cent), wafers (97 per cent), cells (84 per cent), and modules (77 per cent) (Wood Mackenzie 2024). Supply chain shocks arising from such concentration can impact domestic solar companies and derail the clean energy transition (ETC 2023). India has already identified silicon, copper, cadmium, and tellurium as critical minerals for domestic manufacturing (MoM 2023). Recycling and recovering these metals from solar modules improve their local availability and strengthens supply chains essential for a resilient domestic manufacturing industry. At the same time, recycling helps offset future demand for these materials and reduces reliance on virgin sources. Demand for virgin silicon and copper for use in solar PV cell and module manufacturing is set to rise rapidly in the coming years (Figure 1) (IEA 2023). A study by the Council on Energy, Environment and Water (CEEW) shows that recycling solar module waste could cover approximately 60 per cent of the demand for silicon, 50 per cent for aluminium, 44 per cent for copper, 40 per cent for glass, 38 per cent for silver, 15 per cent for tellurium, and 13 per cent for cadmium by 2047 (Tyagi et al. 2025).
Recycling, along with other circular strategies, also advances the climate agenda by supporting the attainment of various Sustainable Development Goals (SDGs) (Schröder and Barrie 2024). Actions such as using recycled materials (such as aluminium and glass) in new modules, reducing the use of critical and toxic materials, and repairing modules to extend their useful life contribute to SDG 12 (Responsible Consumption and Production), SDG 11 (Sustainable Cities and Communities), SDG 9 (Industry, Innovation and Infrastructure), and SDG 8 (Decent Work and Economic Growth). The G20 has also recognised the role of a circular economy in meeting climate goals and has committed to “enhance environmentally sound waste management, substantially reduce waste generation by 2030, and highlight the importance of zero waste initiatives” (G20 2023, p. 13). India launched the Resource Efficiency and Circular Economy Industry Coalition (RECEIC) in July 2023 to drive concrete action on resource management through technological cooperation, financial support, and impact partnerships (MoEF&CC-BCG 2023). The coalition has already taken actionable steps, such as publishing a compendium of circular economy business models in December 2024 (FICCI 2024) and announcing a call for awards on resource efficiency and the circular economy (RECEIC 2024).
As solar energy continues to expand and is poised to become the most dominant global renewable energy source by 2029, a circular economy approach will further enhance the sustainability of the solar industry and contribute to India’s clean energy transition (IEA 2024). Recycling represents a low-hanging entry point for building this economy.
Figure 1. Between 2022 and 2050, the demand for silicon is projected to increase by 71%, and for copper by 147%
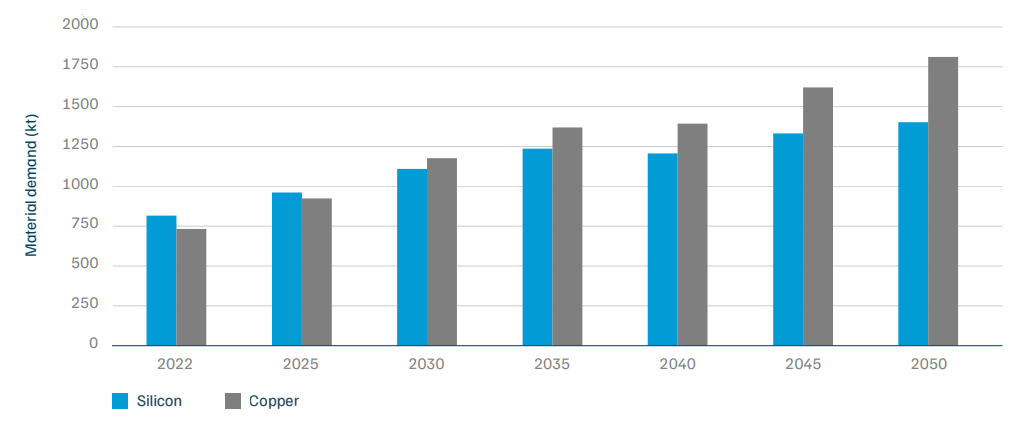
Source: Authors’ analysis of IEA. 2023. “Critical Minerals Data Explorer.” International Energy Agency.
Despite its numerous advantages, commercial recycling of solar waste has yet to become mainstream, both domestically and globally. The barriers include highly distributed volumes of solar waste, reverse logistics challenges, the limited potential of available recycling technologies to recover individual materials (particularly high-purity materials at high recovery rates), and the absence of markets for secondary materials.
To promote the sector, governments worldwide are providing fiscal and non-fiscal incentives to recyclers to overcome barriers to module recycling. For example, the Government of New South Wales, Australia, established a fund of AUD 10 million under its Circular Solar Grant Program to support the effective waste management of solar modules and lithium-ion batteries (NSW EPA 2021). The Australian Renewable Energy Agency also allocated AUD 2.92 million for two projects focused on developing solar PV recycling technologies (ARENA 2020a, 2020b). In the United States of America (USA), the Office of Energy Efficiency and Renewable Energy initiated the Solar Energy Technology Recycling Research, Development, and Demonstration Program, funded at USD 20 million, to support the development of innovative recycling technologies (US DOE 2023). Similarly, the European Union (EU) has funded the QUASAR project, which aims to recycle and recover silicon, silver, polymers, and glass with recovery rates of 70–90 per cent (CORDIS 2023). In India, the government has launched a USD 170 million (INR 1,500 crore) incentive scheme to promote the recycling and recovery of critical minerals from multiple waste streams, including e-waste (MoM 2025).
In principle, the design of any support mechanism for module recycling must be informed by a detailed understanding of the costs incurred and the revenue opportunities available to recyclers. Although a few recyclers are commercially processing solar modules in India,7 the demand would be significantly higher. A thorough financial analysis of the entire recycling value chain, encompassing procurement, transportation, and recycling within the Indian context, is therefore essential. Such an analysis would enable the government to design appropriate incentives to support the PV recycling ecosystem. A comprehensive financial assessment can also help private-sector actors develop workable business models to optimise costs, maximise financial benefits, guide infrastructure development, and identify markets for recovered materials. Lastly, comparing different technological pathways through financial assessment can inform the scaling of efficient recycling technologies, as efficiency and purity improvements often involve significant investments. A robust understanding of the financials would help identify opportunities for cost reduction and make recycling an attractive investment proposition.
To inform decision-making and support the scaling of solar module recycling in India, this study presents a detailed financial assessment of solar module recycling. The discussion begins with an overview of the latest developments in recycling technologies, followed by a market outlook for solar module recycling, and concludes with a financial analysis. Insights from the analysis inform our recommendations for policymakers, technology providers, and solar manufacturers.
This study focuses on the recycling of crystalline silicon (c-Si) PV modules, which account for more than 95 per cent of the market share as of 2025 (Intersolar Europe 2025). The design of a typical c-Si PV module, along with the minerals used in its manufacturing, is shown in Figure 2.
The following section summarises current technological trends for these approaches and provides details on the recycling processes considered in this study.
Solar module recycling involves three broad steps: disassembly of the module, delamination, and metal recovery. Current PV recycling technologies primarily employ mechanical processes or a combination of mechanical and thermal or chemical processes (IEA PVPS 2022), as outlined in Table 1. These processes can recover ferrous and non-ferrous metals, polymers, glass, solar cell materials, and plastics. Recovery rates are generally above 80 per cent, and the processes mainly yield aluminium frames and glass. The recovered materials are then forwarded for further processing or sent directly to secondary markets, depending on their purity levels and the requirements of the off-taker. For instance, solar PV manufacturers use solar-grade silicon (SoG-Si) with a minimum purity level of 99.9999 per cent, also referred to as 6N purity (IEA PVPS 2015). In contrast, a lower grade of silicon, such as ferrosilicon with a purity level of 75 per cent, is used in the steel industry (Gasik 2013). Purity levels, therefore, vary based on the recycling processes implemented. Recycling technologies must thus be assessed with respect to recovery rates, purity levels of the recovered materials, possible limitations, and their stage of development, which is defined by technology readiness levels (TRLs). This approach facilitates the identification of recycling technologies that are technically and financially viable for implementation, as well as those that require support for further development.
Figure 2. A typical crystalline silicon (c-Si) PV module design highlighting intrinsic materials
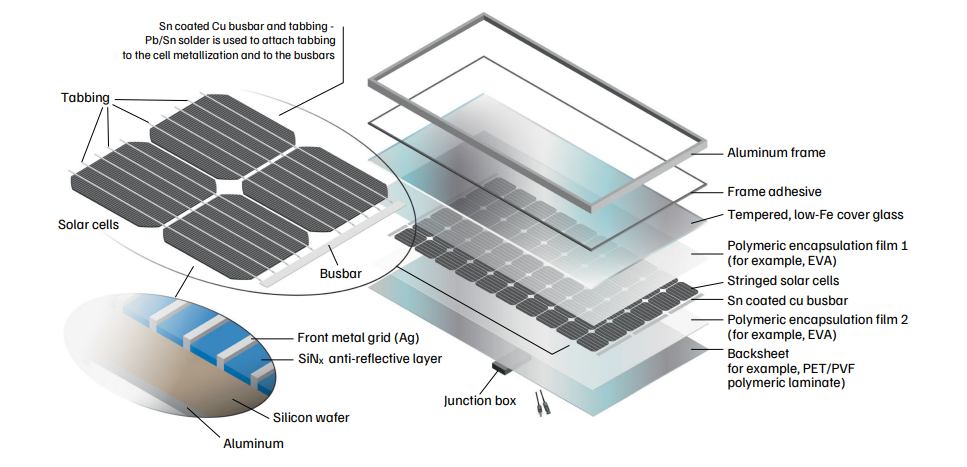
Source: Garvin et al. 2020. “Research and Development Priorities for Silicon Photovoltaic Module Recycling to Support a Circular Economy.” Nature Energy 5 (7).
Table 1. Comparison of different solar PV recycling processes at various stages of development
| Recycling stage | Recycling technology | Process | Recovered materials | Limitations | Status |
|---|---|---|---|---|---|
| Disassembly | Mechanical | Physical disintegration |
|
|
Commercial (TRL 9) (Berger et al. 2010) |
| Delamination | Mechanical | Hot knife method |
|
|
Commercial (IEA PVPS 2023, Bang et al. 2019) |
| Chemical | Nitric acid dissolution |
|
|
Pilot (TRL 6) (Bruton et al. 1994) | |
| Chemical | Solvent and ultrasonic irradiation |
|
|
Research (Kim and Lee 2012) | |
| Chemical | Solvent dissolution |
|
|
Research (Doi et al. 2001) | |
| Thermal | Thermal treatment |
|
|
Commercial (TRL 9) (Wang et al. 2012) | |
| Thermal | Pyrolysis |
|
|
Pilot (TRL 6) (Frisson et al. 2000, Tao et al. 2023) | |
| Material extraction | Chemical | Chemical etching |
|
|
Commercial (TRL 9) (Klugmann-Radziemska et al. 2010) |
Source: Authors’ compilation from multiple sources (listed in Table 1)
Note: The authors have assigned the TRLs to each recycling process based on their assessment of the technological readiness in each process.
We modelled two solar module recycling pathways for the financial analysis. Each pathway employs a distinct recycling technology that results in the extraction of different materials.
Mechanical recycling
This pathway uses only mechanical operations to recover materials from solar PV modules (Figure ES2). It is one of the most commonly used methods of solar module recycling (IEA PVPS 2022).
Mechanical recycling (P1) begins with the disassembly of the PV modules.8 This yields de-framed modules, with aluminium frames and junction boxes as outputs. While modules are de-framed using machines, junction boxes can be removed either manually or mechanically. For our analysis, we assumed a mechanical process. The next step involves separating the glass from the de-framed laminated module using a machine. The remaining laminated structure is processed through a shredder, crusher, and grinder to create a fine powder containing solar cells, polymeric backsheets, and EVA encapsulants.
Various methods can then be applied to further refine this mixture (Figure ES2). Table 2 describes the mechanisms of each method and the corresponding recovered materials. For our analysis, we selected electrostatic separation as it is a low-cost, environmentally friendly method widely used to recover materials from other waste electrical and electronic equipment (WEEE) (Li et al. 2023). The equipment used to separate materials includes a screw conveyor, a cyclone, an electrostatic separator, and a dust collector. If any glass granules remain in the mixture, they can be separated through a sieving operation.
At the end of P1, the recovered materials include aluminium, crushed glass, silicon powder (ferrosilicon), low-quality copper (including polymer residues and silicon powder), and polymer powder. Silver is not recovered in this process. Both silicon and copper require further refining before they can be put to secondary use, especially in the solar industry. The dust collected during this process mainly consists of glass and polymer powder; it has buyers in the secondary market and is used as an alternative to sand in the construction industry (ENGIE 2021). Recovery rates for the various materials in P1 are presented in Table 3.
Table 2. Electrostatic separation is a widely used method to recover materials from electronic waste
| Method | Mechanism | Materials obtained |
|---|---|---|
| Screening |
|
|
| Gravity separation |
|
|
| Density separation |
|
|
| Electrostatic separation |
|
|
| Optical separation |
|
|
Source: Authors’ adaptation from Deng, Rong, Yuting Zhuo and Yansong Shen. 2022. “Recent progress in silicon photovoltaic module recycling processes.” Resources, Conservation and Recycling.
Chemical recycling
The chemical recycling pathway (P2) combines mechanical and thermal steps with chemical recycling processes to recover individual metals from solar modules. After removing the glass from de-framed modules, which is similar to the process in P1, the remaining laminate is shredded and crushed. If any glass granules remain, they can be separated using optical or screening operations. The remaining mixture then undergoes thermal treatment, such as pyrolysis, to burn off the polymer (encapsulant and backsheet) present in it; the entire polymer is lost in this step. This is necessary to expose the silicon cell surfaces so that metals can leach out during the subsequent chemical stage (Tao et al. 2023). The resulting mixture contains fragments of silicon cells and clippings from busbars, some of which also appear as fine particles. The metals present in this mixture are silicon and silver from the cells, and copper from the ribbons in the cells and busbars.
Table 3. Mechanical recycling with electrostatic separation has an overall material recovery rate of 87% by weight
| Method | Recovery rate (%) |
|---|---|
| Aluminiuma | 99 |
| Glassb | 89 |
| Copperc (impured) | 95 |
| Silicone (ferrosiliconf) | 95 |
| Silver | 0 |
| Polymer | 60 |
Source: Authors’ compilation from stakeholder consultations and Suny Group. “Solutions for Solar PV Panel Recycling.” 2023.
The mixture is then leached with nitric acid (HNO3) to extract silver from the cells and copper from the ribbons and busbars. A sequential electrowinning process is employed to recover silver and copper from this leachate, achieving recovery rates of 74 per cent and 83 per cent, respectively, with a minimum purity of 99 per cent (Wen-Hsi Huang 2017). The remaining silicon cell fragments are treated with hydrofluoric acid (HF) to remove the silicon nitride (SiNX) anti-reflective layer from the cell’s surface (see Figure 2). Aluminium is then removed from the cell’s back surface using a sodium hydroxide (NaOH) solution. The final product is crushed silicon wafers or metallurgical-grade silicon (MGSi), with a recovery rate of 90 per cent. Used chemicals are neutralised and disposed of safely.9 Table 4 summarises the recovery rates of various materials in the chemical process.
Table 4. Chemical recycling allows the recovery of high-purity critical and precious metals from solar modules
| Method | Recovery rate (%) |
|---|---|
| Aluminium | 99 |
| Glassa | 89 |
| Copper (pure) | 83 |
| MG-Si | 90 |
| Silver | 74 |
| Polymer | 0 |
Source: Authors’ compliation from Wen-Hsi Huang et al. 2017. “Strategy and Technology to Recycle Wafer-Silicon Solar Modules.” Solar Energy (144): 22–31 and Suny Group. 2023. “Solutions for Solar PV Panel Recycling.”
Solar PV recycling has recently gained significant attention from the industry, local communities, and governments worldwide. The domestic solar PV recycling industry is projected to reach INR 3,709 crore in 2047 (Tyagi et al. 2025). This section summarises ongoing developments in solar module recycling across global and Indian markets.
Global PV recycling markets are diverse because companies employ different recycling processes to recover materials. First Solar, a leading US-based manufacturer of thin-film solar cells, is considered the first commercial recycler of solar waste. The company claims to have recovered more than 400,000 tonnes of solar waste since 2005 (First Solar 2025). In Europe, Return of Silicon (ROSI) Solar, a French PV recycling company, recently formed a strategic partnership with Yingli Solar, a leading solar module manufacturer, to recycle solar waste (ROSI 2023). In Germany, Reiling, a waste management company, has opened the country’s first solar PV recycling facility, having successfully recycled 6,000 tonnes of solar waste in 2022 (PV Europe 2023). In the USA, SOLARCYCLE, a PV recycling company, has established partnerships with Ørsted (SOLARCYCLE 2023a) and EDF Renewables North America (SOLARCYCLE 2023b), key developers in the country, to recycle decommissioned and damaged PV modules, respectively. We Recycle Solar is another US-based recycling firm (We Recycle Solar 2023). An EU-funded project, PHOTORAMA (Photovoltaic waste management–advanced technologies for recovery and recycling of secondary raw materials from end-of-life modules), aims to develop and demonstrate innovative PV recycling solutions. Its pilot has reached TRL 7 (PHOTORAMA 2023a). Table 5 summarises the recycling technologies used by these companies to recover materials from solar waste.
Table 5. Comparison of various recycling processes adopted by companies aiming for high-purity materials
| Entity | Recycling process used | Key features |
|---|---|---|
| First Solar, USA (Krueger 2010) |
|
|
| ROSI, France (Beyer 2022) |
|
|
| Reiling, Germany (Reiling Group 2023) |
|
|
| SOLARCYCLE, USA (Cain 2024) |
|
|
| We Recycle Solar, USA (We Recycle Solar 2023) |
|
|
| PHOTORAMA, EU (PHOTORAMA 2023b) |
|
|
Source: Authors’ compilation from multiple sources (listed in Table 5).
Solar PV recycling is gaining momentum in India as well. Numerous developments are underway, driven by technological advancements, industry participation, and government support. Table 6 presents some of the progress made in the country.
Next, we present the first detailed financial assessment of solar module recycling in India. The proposed model is based on a comprehensive list of cost components (machinery and equipment, materials, and utilities) required for waste processing, as well as the impact of changes in material recovery rates and purity levels on financial benefits. We also highlight opportunities for cost reduction for recyclers that could make recycling financially competitive.
Table 6. Developments in the Indian solar PV recycling ecosystem made by the government, industry, and research
| Entity | Associated developments |
|---|---|
| Ministry of New and Renewable Energy (MNRE) | Solar PV recycling is identified as a key area of focus under the Renewable Energy Research and Technology Development Programme (RE-RTD) (PIB 2023). Call for proposals under the ‘Innovation Challenge for Circularity in Renewable Energy Technologies—Batteries and Solar Photovoltaic’ in June 2025 to promote and scale up research and development of circular economy strategies in batteries and solar (MNRE 2025). |
| Ministry of Mines (MoM) | Incentive scheme for critical mineral recycling approved by the Union Cabinet under the National Critical Mineral Mission (NCMM) to develop India’s recycling capacity for the separation and production of critical minerals from e-waste, lithium-ion battery waste, and components of end-of-life vehicles (PIB 2025). |
| National Solar Federation of India (NSEFI) | The SolarRecycle India initiative was launched to create a platform for addressing all solar waste management—related issues, policies, regulations, and technological advancements (NSEFI 2024). |
| Department of Science and Technology (DST) | Call for proposals on ‘Recovery and Recycling of End-of-life Solar PV modules’ in mid-2024 to identify advanced recycling technologies that are economically viable (DST 2024). |
| First Solar | 3.3 GW fully recycling integrated solar manufacturing facility established in Tamil Nadu, with an in-house recycling unit capable of processing 24,000 tonnes of solar waste per year (First Solar 2024). |
| Centre for Materials for Electronic Technology | Recycling technology under development to recover silicon, silver, and copper from solar waste (Prasad et al. 2023). |
Source: Authors’ compilation from multiple sources (listed in Table 6); list not exhaustive.
This section describes the approach used for the financial assessment of c-Si module recycling, focusing on the various costs incurred and the benefits accrued. Broadly, the analysis is divided into three parts (Figure 3), estimating:
The weight of one c-Si module is assumed to be 22 kg, with the composition shown in Table 7 (Paiano 2015).
Table 7. Material composition of crystalline silicon PV module assumed in the study
| Method | Share by weight (%) |
|---|---|
| Aluminium | 10.30 |
| Glass | 74.16 |
| Copper | 0.57 |
| Silicon | 3.35 |
| Silver | 0.006 |
| Polymer | 11.31 |
Source: Authors’ compilation from Paiano, Annarita. 2015. “Photovoltaic Waste Assessment in Italy.” Renewable and Sustainable Energy Reviews 41 (1): 99–112.
The processing capacity of the recycling facility is assumed to be 5,400 tonnes per annum. Based on consultations with recyclers, the capacity utilisation factor for the recycling facility is set at 67 per cent. Operating at full capacity is generally considered detrimental due to the smaller margins for error and the increased frequency of maintenance requirements. For our analysis, a 67 per cent capacity utilisation factor reduces the effective annual processing capacity to 3,600 tonnes, translating to a processing capacity of 12 tonnes per day.
We also define the distance between the recycling facility and the project site(s) for obtaining solar PV waste as 360 km. Our previous study found that 67 per cent of India’s solar waste will come from five states: Rajasthan, Gujarat, Karnataka, Tamil Nadu, and Maharashtra, reflecting capacity installation trends (MNRE-CEEW 2024). In this study, we take the average distance between the top three districts with the highest installed solar capacity and the district with the highest number of e-waste recyclers in these five states (CPCB 2023). An important assumption in this analysis is that the entire solar waste generated in the country is available for collection and recycling. This means exports of solar waste, leakages to the informal sector, or withholding of solar waste by consumers are not considered in the analysis.
Further details on the general assumptions are provided in Annexure A.
There are two types of recycling costs — non-recurring and recurring. Non-recurring costs are further divided into four components: land, facility construction, machinery, and compliance.
Recurring costs are also divided into four parts: waste procurement, collection, processing, and disposal.
Annexure A contains further details about the assumptions made specific to the modelled recycling pathways.
Figure 3. The financial assessment of solar module recycling includes recurring costs, non-recurring costs, and revenue from the sale of recovered materials
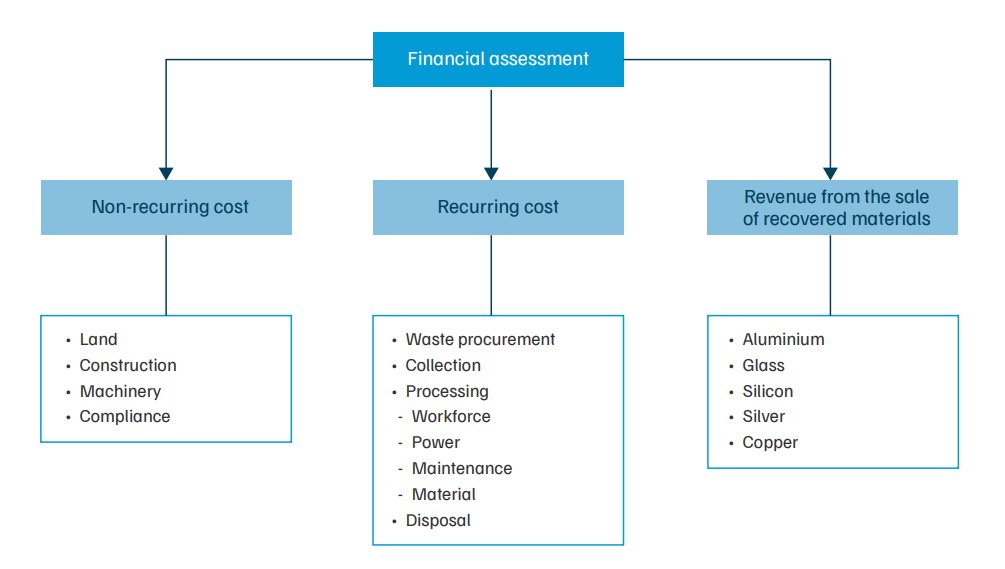
Source: Authors’ analysis
We assess the financial benefits of solar module recycling based on the sale of recovered materials, such as aluminium, glass, copper, silicon, and silver. The resale values of these materials vary based on their purity levels (Table 8).
Both recycling pathways recover glass and aluminium. In addition, P1 recovers low-quality copper and ferrosilicon, while P2 recovers pure copper and MG-Si. The recovered materials can be utilised in various industries, including cement (recovered glass), steel (recovered silicon), and metal manufacturing (recovered aluminium). However, further processing is required before these recovered materials can be reused in solar module manufacturing. For instance, Trina Solar, a Chinese module manufacturer, has demonstrated the ability to manufacture modules using recycled silicon, silver, aluminium frames, and discarded glass from old modules (Trinasolar 2024). The company reported an efficiency of 20.7 per cent and a maximum power output of 645 W.
This assessment includes a sensitivity analysis to examine variations in costs, including the waste module procurement cost, collection cost, recovery rates of materials, purity levels of recovered materials, and module composition.
Table 8. Resale value of recovered materials increases with purity levels.
| Material | Resale value in secondary markets (INR/kg) |
|---|---|
| Aluminium | 177a |
| Glass | 7b |
| Copper | 750 (low-qualityc), 800 (pured) |
| Silicon | 100 (ferrosilicone), 200 (metallurgical gradef) |
| Silver | 95,775g |
| Polymer | - |
Source: Authors’ compilation from stakeholder consultations and online marketplaces.
Our study is based on several assumptions and discussions with diverse stakeholders. Accordingly, the final results are influenced by these assumptions. The key limitations are as follows:
This section presents the results of the financial analysis and discusses trends observed across various scenarios.
Figure 4 illustrates the distribution of recurring costs. Waste procurement accounts for the most significant share–68 per cent in P1 and 56 per cent in P2. Collection costs represent about 10 per cent in both pathways. Stakeholders typically consider transportation costs as the sum of module procurement and collection costs; however, analysing them separately provides a clearer understanding of the individual impact and relative weight of each cost parameter. Processing costs account for only 21 per cent in P1, compared to nearly 33 per cent in P2, reflecting the additional power consumed by the thermal and chemical equipment, as well as the use of chemicals (Table 9). P2 also requires additional personnel to manage chemical processes, further increasing processing costs. Disposal costs are higher for P2 due to the additional management of chemical and liquid waste generated at the end of recycling operations.
Among non-recurring costs, machinery accounts for the largest share–nearly 50 per cent in P2 and 45 per cent in P1. This is because recycling machinery for mechanical operations is currently imported from abroad, which increases costs. Stakeholder consultations suggest that producing similar machinery domestically could cut costs by 43 per cent (approximately USD 0.3 million, or INR 2.5 crore). This would result in savings of more than INR 1 crore in non-recurring costs. Land is the second-highest contributor to non-recurring costs, accounting for about 33–34 per cent in both pathways. Construction costs are 15 per cent higher in P2 due to the requirement for thermal and chemical equipment for processing, as well as storage vessels for new and spent chemicals inside the facility. Table 9 summarises these expenses.
The mechanical pathway with electrostatic separation yields aluminium frames, glass cullet, low-quality copper, and ferrosilicon. Among these recovered materials, the sale of aluminium generates the highest revenue, followed by glass, copper, and silicon. Figure 5 and Table 10 summarise the financial benefits from the sale of these recovered materials.
Figure 4. Use of chemicals leads to higher processing costs in chemical recycling
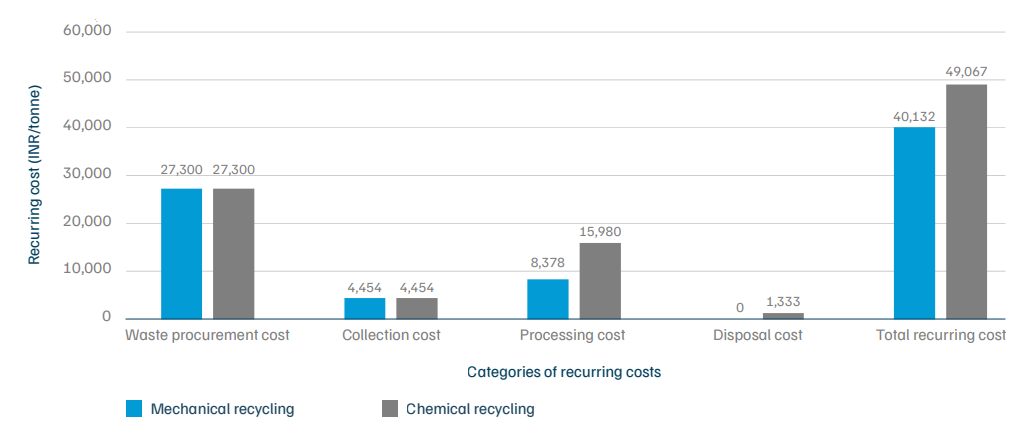
Source: Authors’ analysis
Figure 5. The higher costs for chemical recycling are balanced by its superior revenue potential due to the recovery of silver and silicon of a higher grade
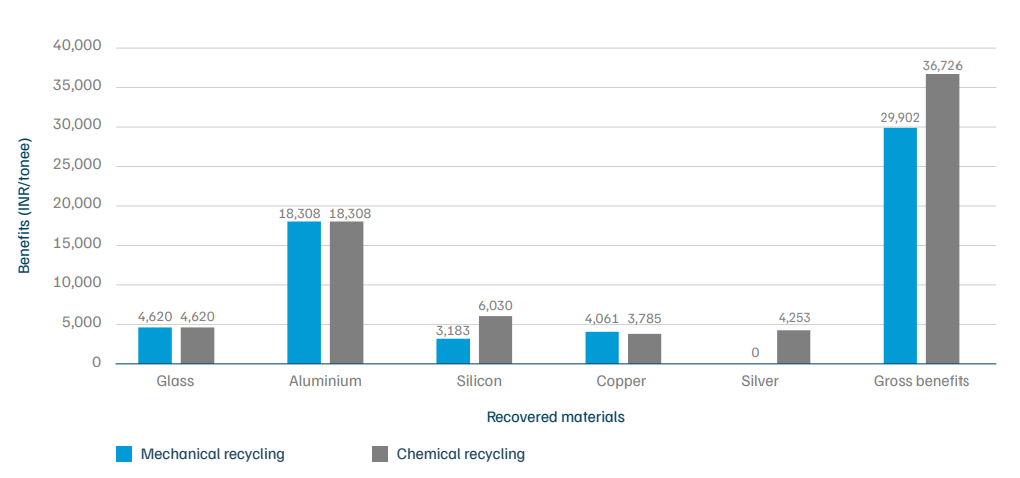
Source: Authors’ analysis
The chemical pathway yields MG-Si, copper and silver (both at a purity level of 99 per cent), aluminium frames, and glass cullet. Due to its higher content, aluminium contributes the largest revenue share in P2, although its share is relatively lower (11 per cent lower) than in P1 (Figure 4 and Table 10). The recovery of higher-grade silicon (metallurgical rather than ferrous) and silver is the primary driver of P2’s higher benefits compared to P1. Conversely, the revenue generated from recovered copper is lower in P2 than in P1, due to a lower recovery rate (83 per cent in P1 compared to 95 per cent in P2).
Table 9. Chemical recycling has higher costs than mechanical recycling, mainly due to the need for additional equipment and the chemicals used
| Component | Associated cost (INR/tonne) | |
|---|---|---|
| Mechanical recycling (P1) | Chemical recycling (P2) | |
| Non-recurring | 28,745 (18,542–40,648) | 39,959 (27,812–60,752) |
| Land | 9,896 (3,125–21,243) | 13,194 (4,167–21,243) |
| Construction | 5,556 (5,000–6,111) | 6,389 (5,833–6,944) |
| Compliance | 417 | 556 |
| Machinery | 12,877 (10,000–12,877) | 19,820 (17,256–32,008) |
| Recurring | 40,132 (36,287–43,833) | 49,067 (45,222–52,768) |
| Waste procurement | 27,300 (25,000–30,000) | 27,300 (25,000–30,000) |
| Collection | 4,454 (2,909–5,455) | 4,454 (2,909–5,455) |
| Processing | 8,378 | 15,980 |
| Workforce | 2,961 | 3,511 |
| Power | 5,000 | 6,000 |
| Maintenance | 417 | 556 |
| Material | 0 | 5,913 |
| Disposal | 0 | 1,333 |
Source: Authors’ analysis
Note: The numbers within brackets indicate the range of the parameters as described in the preceding sections
Table 10. Chemical recycling offers greater benefits than mechanical recycling due to the recovery of higher-purity silicon and silver
| Material recovered | P1 (INR/tonne) | P2 (INR/tonne) |
|---|---|---|
| Glass | 4,620 | 4,620 |
| Aluminium | 18,038 | 18,038 |
| Copper | 4,061 | 3,785 |
| Silicon | 3,183 | 6,030 |
| Silver | 0 | 4,253 |
| Polymer | 0 | 0 |
| Total | 29,902 | 36,726 |
Source: Authors’ analysis
Based on the costs incurred and benefits accrued, we conclude that solar module recycling in its current form is financially unviable. Mechanical recycling generates a loss of INR 10,230 per tonne of waste processed (Table 11). Although chemical recycling recovers higher-grade materials, including precious metals such as silver, the result is still a loss of INR 12,341 per tonne, 21 per cent more than mechanical recycling (Table 11). Notably, P1 has a higher recovery rate for copper than P2. So, despite the lowergrade copper recovered in P1, it yields greater benefits than P2 which gives high-purity copper but in smaller amounts. As of Q2 2025, the cost of a 500 Wp domestic mono-PERC solar module is INR 17.72 per watt (JMK Research and Analytics 2025). In comparison, our analysis finds that recycling costs account for a substantial 23–28 per cent of this cost, at INR 4.11–5.02 per watt. However, as the recycling technologies mature and the volumes to treat increase, this cost is likely to come down.
In recent years, the production cost of polysilicon has declined sharply to approximately USD 15–20 per kg (INR 1,245–1,660 per kg) (PV Magazine 2024) outside China. Meanwhile, the average production cost in China for the first two quarters of 2025 was just USD 7.42 per kg16 (INR 616 per kg) (Casey 2025). Recovering MG-Si from solar waste using P2 costs INR 1,627 per kg–approximately 2.5 times more expensive compared to China, although within the same range as production outside China.
Several reasons contribute to the poor financial outlook of solar module recycling, the most significant being the high procurement costs of waste modules. If waste solar modules were available to recyclers at no cost, the process could become revenue-positive. Specifically, mechanical recycling would generate a benefit of around INR 17,000 per tonne, while chemical recycling would generate a benefit of around INR 15,000 per tonne. Additional factors contributing to the poor financial outlook include:
Table 11. Summary of the recycling costs and benefits
| a) Costs and benefits in INR/tonne | ||
|---|---|---|
| Component | Mechanical recycling (P1) | Chemical recycling (P2) |
| Recurring costs | 40,132 (36,287–43,833) | 49,067 (45,222–52,768) |
| Gross benefits | 29,902 | 36,726 |
| Net impact | -10,230 (-6,385–-13,931) | -12,341 (-8,496–-16,042) |
| b) Costs and benefits in INR/W | ||
| Component | P1 | P2 |
| Recurring costs | 4.11 (3.71–4.49) | 5.02 (4.63–5.40) |
| Gross benefits | 3.06 | 3.76 |
| Net impact | -1.05 (-0.65––1.43) | -1.26 (-0.87––1.64) |
| c) Costs and benefits in INR per module | ||
| Component | P1 | P2 |
| Recurring costs | 883 (798–964) | 1,079 (995–1,161) |
| Gross benefits | 658 | 808 |
| Net impact | -225 (-140–-306) | -271 (-187–-353) |
Source: Authors’ analysis
Note: The numbers mentioned within brackets represent the range for costs and benefits.
In addition to the free procurement of waste solar modules and improvements in recycling processes, EPR certificate trading is another potential revenue source that can help improve recyclers’ financials (Box 1). Currently, the E-Waste (Management) Rules, 2022, do not prescribe EPR targets for producers of solar cells, panels, or modules. However, to assess the likely impact of the recent CPCB guidelines, we modelled a scenario in which EPR certificate trading is available to solar waste recyclers. The inclusion of EPR certificate sales increases gross benefit for recyclers by 74–124 per cent for mechanical recycling and 60–101 per cent for chemical recycling, compared to the scenario without EPR certificate trading.17 This results in a positive net impact of INR 11,770–26,770 per tonne (INR 259–589 per module) for P1 and INR 9,659–24,659 per tonne (INR 213–543 per module) for P2. These results suggest that setting EPR targets for solar could significantly enhance the profitability of solar module recycling. Furthermore, our analysis indicates that incorporating EPR can significantly enhance returns on investment. The Internal Rate of Return (IRR) for P1 is calculated to be in the range of 21 to 64 per cent, while for P2, it is 9 to 40 per cent. Annexure C provides details on the capital structure and cash flow analysis.
Several factors influence the financial viability of solar module recycling. This section presents the results of a sensitivity analysis conducted on three factors with the most significant influence on costs and benefits: waste procurement cost, collection cost and material composition. Annexures D and E provide results for additional parameters, including recovery rates of materials and their corresponding purity levels.
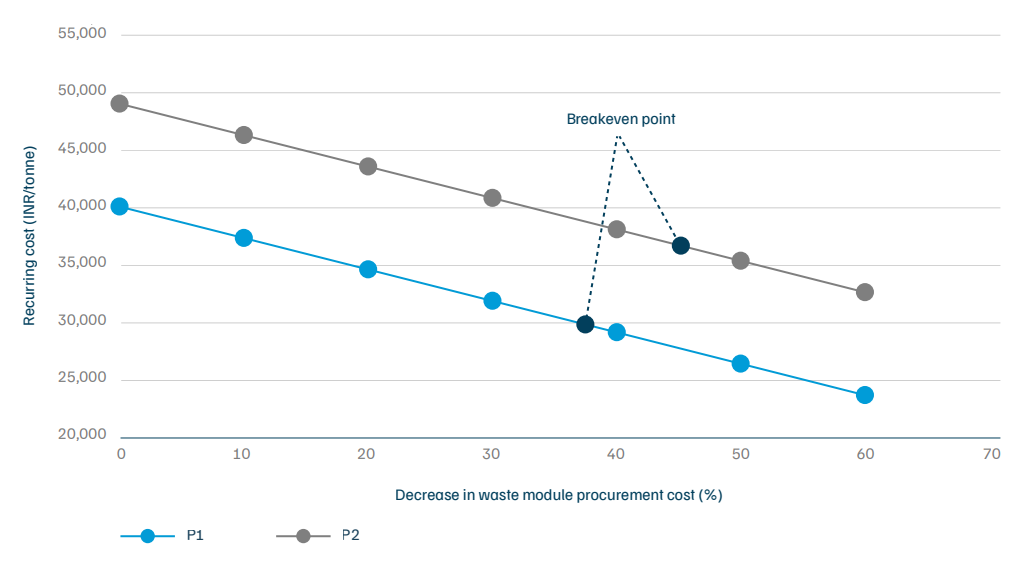
Waste procurement cost: Among the recurring expenses, the cost of purchasing the modules constitutes the highest share – 68 per cent for P1 and 56 per cent for P2. While the free procurement of waste solar modules would make recycling profitable, this is a challenging proposition for Indian markets, where consumers typically expect a certain salvage value in return for their waste. To model more realistic scenarios, we varied this cost. Our analysis suggests that for recycling to generate a positive net impact, waste procurement costs must be lower than INR 17,070 per tonne (INR 375 per module) for P1 and lower than INR 14,959 per tonne (INR 330 per module) for P2, assuming all other cost components remain unchanged. This translates to a drastic reduction of 37–45 per cent from the current level of INR 600 per module. The result is a recurring cost of INR 29,902 for P1 and INR 36,726 for P2, which would enable both recycling pathways to break even18 (Figure 5).
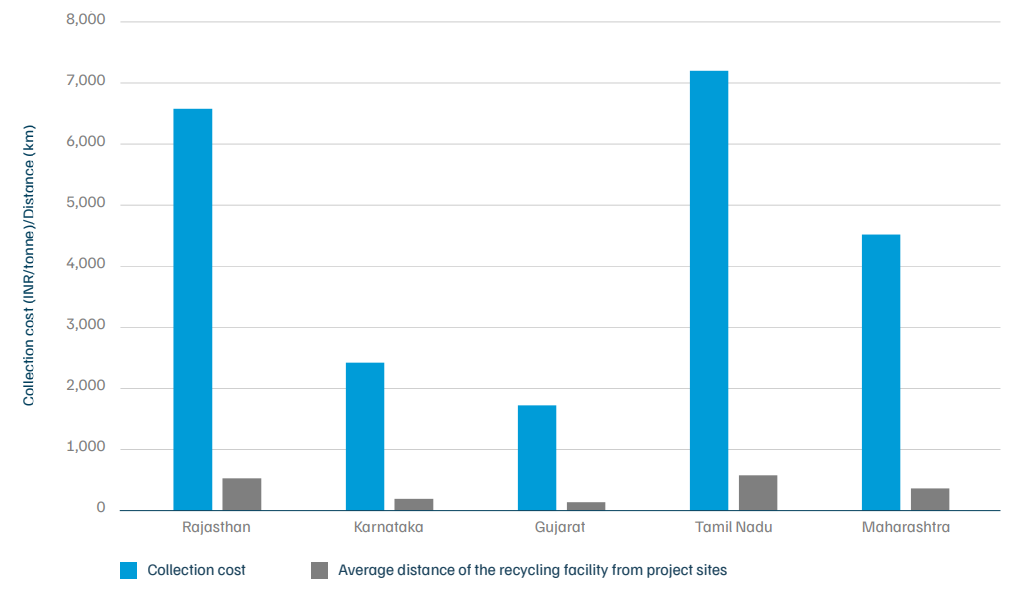
Waste collection cost: Collection costs are directly proportional to the distance between waste centres and recycling units. Our analysis suggests that reducing the transportation distance from 360 km to 100 km would lower recurring costs by INR 3,217 per tonne (INR 71 per module) for both recycling pathways. This reduction translates to an 8 per cent decrease in recurring costs for P1 and 7 per cent for P2. Figure 6 shows the differences in collection costs for the five states with the highest installed solar capacities. Among these, Gujarat and Karnataka stand out with favourable conditions for strategically deploying recycling infrastructure.
Figure 6. Module procurement cost should be below INR 375/module and INR 330/module for mechanical and chemical recycling to break even
Source: Authors’ analysis
Figure 7. Short distances between project sites and recycling units lead to lower collection costs, such as in Gujarat
Source: Authors’ analysis
As solar projects are dispersed across districts in every state, distributed centres need to be identified to collect and process waste modules from nearby regions. A recent study developed an algorithm to determine optimal locations of solar module recycling centres in Karnataka (Taneja et al. 2023). Using agglomerative hierarchical clustering, it identified six collection centres19 and two recycling centres across six clusters comprising 222 solar projects in the state.20 Such an approach could be applied to strategically deploy recycling infrastructure.
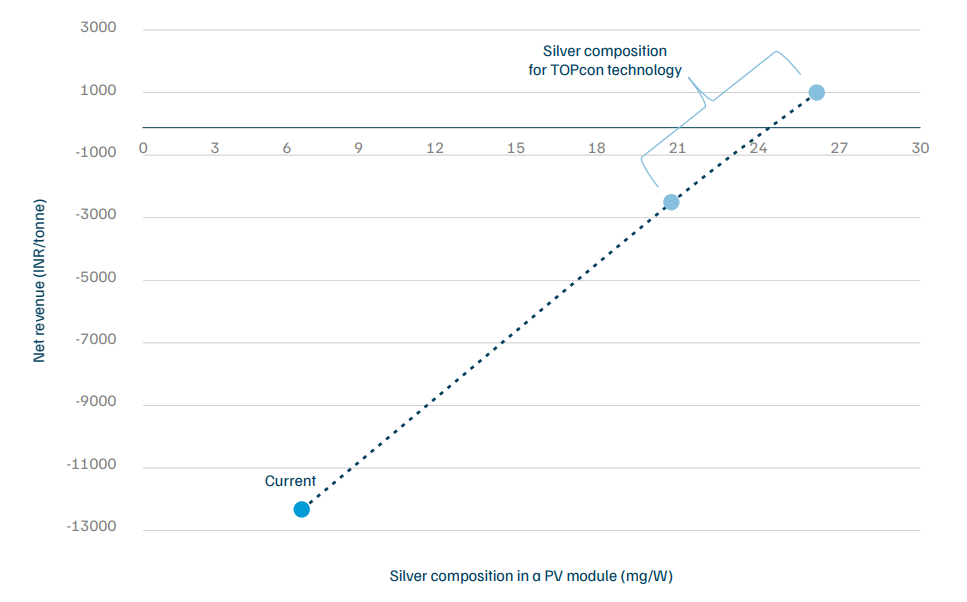
Material composition: According to stakeholders, the next generation of PV installations in India will primarily use n-type Tunnel Oxide Passivated Contact (TOPCon) solar cell technology, which offers a record-breaking efficiency of more than 22 per cent (Waaree 2024). This technology has a high silver content in its material composition, ranging from 20.4 to 26 mg/W (Hallam et al. 2022), which is approximately 3.3–4.2 times the silver composition used in the current analysis.21 A higher concentration of silver would substantially increase the benefits by 27–37 per cent. Assuming no additional processing costs for recovering this higher volume of silver from the solar waste through chemical recycling, the facility could achieve benefits of INR 1,125 per tonne (INR 25 per module) at a silver composition of 26 mg/W (Figure 7). Annexure D provides further details.
Other parameters, such as recovery rates of materials and their purity levels, also have a positive impact on the financials of recycling (Annexure E).
Figure 8. An increase in silver composition due to a change in module technology turns chemical recycling profitable
Solar module recycling is an emerging industry, but the financial returns associated with the sector remain unattractive. Nevertheless, given the strategic and potential future economic opportunities, the industry must be scaled immediately. Recycling technologies must be developed to meet both current requirements and new trends in solar module manufacturing.
Mechanical recycling has been the preferred method for recycling various types of e-waste for over a decade. It is a familiar technology, with machinery that is well established and easy to scale. Being chemical-free, it avoids the use of harmful substances and the risk of generating hazardous by-products. Among the various recycling methods, it has the lowest recurring costs at INR 40,132 per tonne (INR 4.11 per watt or INR 883 per module). However, the materials recovered through mechanical recycling contain high concentrations of impurities. These low-purity end products have limited resale value in secondary markets, resulting in reduced benefits for recyclers–INR 29,902 per tonne (INR 3.06 per watt or INR 658 per module). Meanwhile, chemical recycling enables the recovery of high-purity metals from solar waste, including silver, which commands higher prices in secondary markets. This has the potential to increase revenues from recycling to INR 36,726 per tonne (INR 3.76 per watt or INR 808 per module). However, the process requires the additional use of chemicals, resulting in higher recurring costs of INR 49,067 per tonne (approximately INR 5.02 per watt or INR 1,079 per module). Chemical recycling technologies will, therefore, need further advancement and optimisation to enable the recovery of higher-grade silver and SoG-Si at scale.
In general, the high procurement costs of waste modules and the low purity of recovered materials hinder module recycling. Furthermore, given the volatility of commodity prices, it is prudent to focus on reducing both recurring and non-recurring costs to improve the financial viability of solar module recycling.
India must prioritise the development and scaling of solar module recycling pathways that can supply high-quality raw materials to existing and upcoming manufacturing industries. With polysilicon production expected to commence soon in the country, the demand for high-purity MG-Si, a raw material required for this process, is expected to rise significantly. Similarly, pure silver is essential for a range of applications beyond solar energy, including electronics, electric vehicles, aerospace, medical devices, and water purification (The Silver Institute 2025). Chemicalbased recycling technologies have already demonstrated their capability to recover such high-purity materials. Ongoing industrial and academic research in such technologies is advancing process efficiencies, recovery rates, and the quality of recovered materials. To establish a reliable and efficient recycling ecosystem, policymakers must support existing and emerging technologies capable of recovering high-quality outputs.
Beyond technological challenges, the absence of regulatory mandates and market linkages for recovered materials limits the financial sustainability of solar module recycling. For example, Reclaim PV, a major player in Australia’s solar PV recycling market, went bankrupt at the end of 2022 after attempting to develop an in-house low-cost recycling technology (Peacock 2023). Difficulties in establishing manufacturer networks, collection channels, and investor interest also contributed to the company’s downfall. This case illustrates that numerous factors must align consistently to sustain such initiatives. These factors include a continuous supply of waste PV modules at low or no cost, an efficient recovery process to obtain high-purity materials from solar waste, low-cost reverse logistics mechanisms, and affordable electricity and material costs for processing solar waste. The recently launched mineral recycling incentive scheme under the National Critical Mineral Mission will support reducing recycling costs (MoM 2025). However, additional support can be provided at the state level.
We make the following recommendations for policymakers, technology providers, and the solar industry to establish a financially viable solar module recycling ecosystem in India.
For policymakers
For technology providers
For solar cell and module producers
Solar module recycling is critical for India’s energy transition as it addresses the dual challenge of managing growing solar waste and reducing dependence on imported raw materials. By recovering valuable resources like silicon, aluminium, and copper, recycling enhances resource efficiency, supports domestic manufacturing, and strengthens the resilience of India’s clean energy supply chain.
Solar waste generated from crystalline silicon modules consists of critical minerals such as copper, silicon and tin, whereas thin-film cadmium telluride modules contain cadmium and tellurium.
Solar module recycling involves three broad steps: disassembly of the module, delamination, and metal recovery. Disassembly is the step in which external components like metal frames and cables are removed from the laminated structure. Delamination involves separating the glass sheet, encapsulant, and the backsheet from the solar cells. Finally, metal recovery consists of various chemical processes to recover critical and precious metals from the cells.
The following factors play a significant role in the financial performance of solar module recycling: waste module procurement cost, collection cost, material composition of the modules, recovery rates of individual materials from solar waste, and purity levels of the recovered materials.
Module recycling costs in India can be reduced through economies of scale, improved waste collection systems, and the adoption of advanced, energy-efficient technologies. Policy support such as subsidies, tax incentives, and inclusion of solar waste under Extended Producer Responsibility (EPR) can further lower costs. Developing local markets for recovered materials and integrating recycling into manufacturing supply chains will also enhance revenue streams, improving overall cost efficiency and financial viability.
Organic Waste Circular Economy for Viksit Bharat
Roadmap of the methodology to assess the climate co-benefits of the SUP ban in Maharashtra
Building a Green Economy for Viksit Bharat

Financing for Treated Used Water Reuse in India
How Big is the Solar Module Recycling Industry in India?