Council on Energy, Environment and Water Integrated | International | Independent
Suggested citation: Suryanarayanan, Uday, Mohammad Rafiuddin. 2026. How Can India Tackle Air Pollution with an Airshed-level Approach? Lessons From Global Experiences: Council on Energy, Environment and Water.
The National Clean Air Programme (NCAP) of India stressed the importance of regional-level air quality management. An airshed is a geographical area frequently affected by the same air mass. As the airshed approach becomes critical to curtail air pollution in India, we must learn from global experiences of adopting it.
This study reviewed the airshed approach adopted by the Mexico City Metropolitan Area (MCMA) in Mexico, the Beijing–Tianjin–Hebei (BTH) region in China, the Santiago Metropolitan Region in Chile, and the Vaal Triangle Airshed Priority Area (VTAPA) in South Africa, as they are similar to those in emerging markets like India.
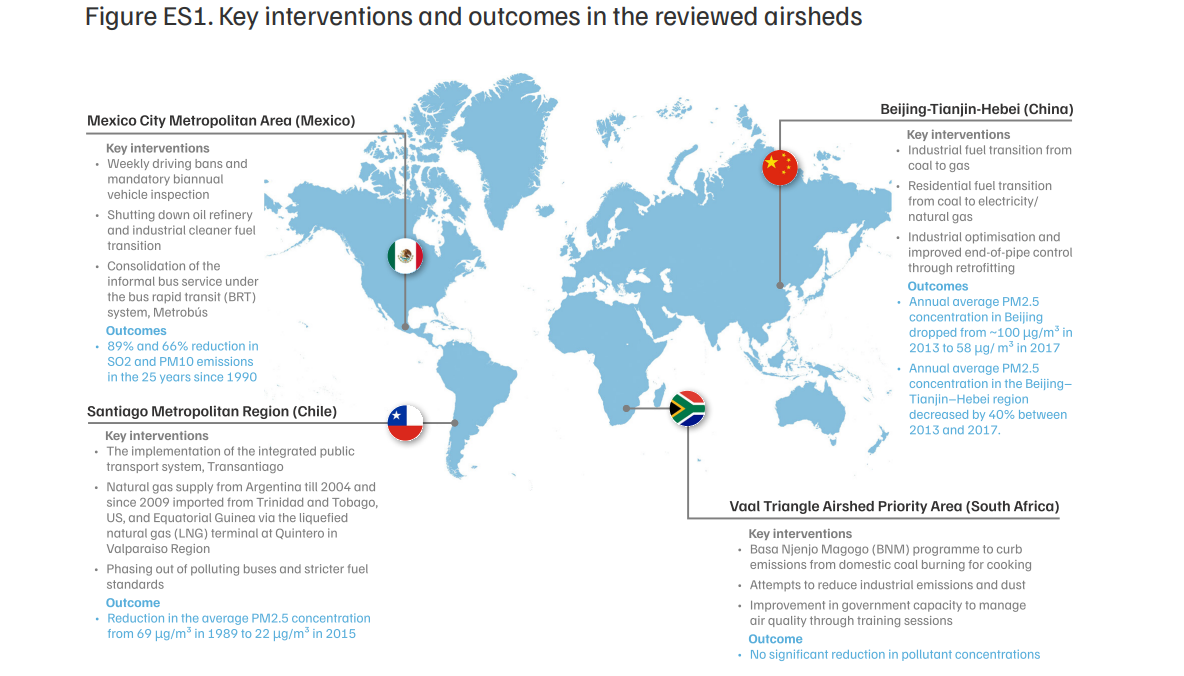
MCMA in Mexico adopted an airshed approach in the early 1990s through setting up a multi-jurisdictional body. The interventions prioritised the transport sector as the emission inventories showed it as the largest contributor to air pollution. It imposed weekly driving bans, mandatory biannual vehicle inspections and transitioned to cleaner fuels in industries. This, along with the consolidation of the informal bus services under the bus rapid transit (BRT) system Metrobús, resulted in a 89 per cent and 66 per cent reduction in SO2 and PM10 emissions in 25 years since 1990.
China created the Coordination Group for Air Pollution Prevention and Control in BTH and Surrounding Areas in 2013 and set reduction targets under its airshed-level air pollution management in the BTH region. The key interventions focused on fuel transition from coal to gas in the industry and residential sector, and improved end-of-pipe control through retrofitting. As a result, the PM2.5 in the BTH region reduced by 40 per cent between 2013 and 2017.
The Santiago Metropolitan Region in Chile implemented an integrated public transport system, Transantiago and imposed strict restrictions on fuel standards and phased out older polluting buses. This was coupled with transitioning to natural gas from polluting fuels. These interventions led to an improvement in the annual average PM2.5 from 69 ug/m3 in 1989 to 22 ug/m3 in 2015.
The VTAPA region in South Africa imposed the Basa Njenjo Magogo (BNM) programme to curb emissions from coal burning for cooking and introduced various training programmes for capacity building of the government officials. There were also attempts to reduce pollution from industry and dust. However, the VTAPA region did not achieve any significant pollution reduction through these initiatives.
Based on the global review, we recommend that India:
Air pollution defies administrative and political boundaries. Therefore, effectively tackling air pollution requires expanding the scope of air quality management from city to regional (or airshed) scale based on topographical, meteorological, and climatological factors. We define an airshed as a geographical area frequently affected by the same air mass. The air quality within an airshed depends on pollution sources within and not outside (ADB 2022).
India’s Indo-Gangetic Plain (IGP) region suffers from severe air pollution, with sources outside the city contributing to city-level pollution. An airshed approach to managing air quality in IGP becomes critical as nine major cities in the IGP region receive 34 per cent of their particulate matter (PM) with a diameter of 2.5 micrometers or less, PM2.5, load from outside the city boundaries (Guttikunda et al. 2019). As reinforced by assessments in the past (ADB 2022; World Bank 2023), the airshed approach is the most cost-effective method to reduce air pollution. Validating the airshed approach, India’s National Clean Air Programme (NCAP) acknowledges the regional, as opposed to localised, nature of air pollution and calls for inter-state and inter-city coordination, along with multisectoral synchronisation, to deal with the problem effectively (MoEFCC 2019). The NCAP identifies air pollution as a regional-scale problem, especially in the IGP region, and recommends a regional quality management approach for its effective containment (MoEFCC 2019).
The shift from city- to regional-level air quality management approach in India conforms to increasing urbanisation, as 48 million-plus cities/ urban agglomerations identified by the 15th Finance Commission for performance-linked grants to improve air quality are urban agglomerations (MoEFCC 2025). Further, Indian states like Uttar Pradesh and Maharashtra are instituting airshed management plans. While still new to the Indian context, several countries have adopted airshed-level air quality management policies over the last few decades. Given the variation in adopted strategies and outcomes, we must examine the factors contributing to a region’s successful airshed-level air quality management strategy. We explore a few critical factors and recommend strategies to facilitate the adoption of airshed management in India.
For the review, we have chosen four airsheds: the Mexico City Metropolitan Area (MCMA) in Mexico, the Beijing–Tianjin–Hebei (BTH) region in China, the Santiago Metropolitan Region in Chile, and the Vaal Triangle Airshed Priority Area (VTAPA) in South Africa. We have chosen these four airsheds as they are similar to those in emerging markets, such as India. (Duttagupta and Pazarbasioglu 2021).
Recent studies have examined India’s need to adopt an airshed approach (ADB 2022; World Bank 2023; Roychowdhury and Tembhe 2021). Successful airshed management requires sound administrative structure, scientifically designed interventions, adequate financing, and evaluation of the outcomes of the interventions. An airshed (representative of a region rather than a city) requires coordinated interventions. However, no two airsheds are alike. We need a common framework to evaluate these essential conditions. Therefore, we ask the following questions:
Source: Authors’ compilation from World Bank 2020; Molina et al. 2019; Megalopolis Environmental Commission 2018; Mexico Federal Government 2006; BreatheLife2030.org 2018; McDonald et al. 2016; UN Environment 2019; Xinhua 2017; Cheng et al. 2019; Pino et al. 2015; Muñoz et al. 2015; Red Metropolitana de Movilidad 2022; AGN 2019; GNL Quintero 2022a; Chile Ministry of Environment 2017; Makonese et al. 2017; South Africa DFFE 2021, and Feig et al. 2019.
Based on the global review, we make the following recommendations which can help India in its regional air quality management journey:
Even though airshed management is gaining recognition in India with the constitution of the Commission for Air Quality Management in National Capital Region and Adjoining Areas (CAQM) in the National Capital Region (NCR) and states like Uttar Pradesh and Maharashtra taking steps to consolidate the approach by creating airshed management plans, effectively reducing air pollution will require a robust scientific approach, well-coordinated administrative arrangements, availability of funds with a well-defined disbursal mechanism, and setting accountability at different levels will be vital to implementing the airshed approach successfully in India.
Los Angeles pioneered the regional airshed approach to manage air quality in 1947 (Zhang et al. 2012; South Coast AQMD 2022). The underlying belief that when the problem is regional, separate and disjointed efforts at the local level would not work formed the basis of Los Angeles’ approach, informing the present-day application globally. In India, Delhi has led the way in the adoption of the airshed approach with the formation of the Environment Pollution (Prevention and Control) Authority for the National Capital Region (EPCA) in 1998, which the Government of India replaced by the Commission for Air Quality Management in the National Capital Region and Adjoining Areas (CAQM) in 2021. The approach is currently gathering momentum in the country, with 48 million-plus cities/urban agglomerations identified by the 15th Finance Commission for performance-linked grants to improve air quality being urban agglomerations (MoEFCC 2025).
1.1 The need for an airshed approach
The mitigation strategy adopted to tackle smog in Los Angeles in 1947 gave rise to the concept of airshed management. During the Second World War, Los Angeles County faced rapidly deteriorating air quality due to an increased industrial base, population, and motor vehicle fleet. The county administration formed a Smoke and Fumes Commission to analyse the problem, spurred by the rising air pollution (South Coast AQMD 2022). Even though Los Angeles County banned emissions of dense smoke in February 1945, following the recommendation of the Smoke and Fumes Commission, and the city of Los Angeles followed suit the same year, the remaining 45 cities in the county took little to no action. As a result, air pollution continued to go unabated (South Coast AQMD 2022).
The solution finally emerged in late 1946 when Raymond Tucker, the former City Smoke Commissioner and the future mayor of St. Louis, Missouri, highlighted the ineffectiveness of smog control in the county due to separate and disjointed efforts at the county and the individual city levels in a seminal article published in the Los Angeles Times (South Coast AQMD 2022). Tucker recommended the creation of a county-wide air pollution agency with powers to adopt and enforce air pollution regulations. His recommendation crystallised when the county administration instituted the Los Angeles County Air Pollution Control District (LACAPCD) in 1947. Thus, the United States (US) created the first regional air pollution control agency (Zhang et al. 2012). The formation of LACAPCD spawned the creation of multiple such regional air pollution control agencies across southern California in the next decade (South Coast AQMD 2022).
As recognised by Raymond Tucker in 1946, air pollution defies boundaries. Meteorology, climate, and topography determine the geographic spread of air pollution and how much area it impacts in a region, spanning administrative and political boundaries. However, South Asian countries have adopted the city-scale approach to air quality management for many decades, with administrative boundaries defining the applicability of air pollution reduction policies. This approach, however, has yielded limited dividends so far and will only have a minimal impact on reducing air pollution by the end of this decade (ADB 2022; World Bank 2023). In many metropolises like Delhi and Beijing, a significant fraction of the pollution load originates from outside the city and municipal limits, which stresses the need for adopting a regional airshed approach (ADB 2022; World Bank 2020; UN Environment 2019). Hence, expanding the scope of air quality management from the scale of an individual city or municipality to an airshed around the city is critical to ensure the success of air pollution reduction policies in the most cost-effective manner (ADB 2022; World Bank 2023).
In many cities, a large share of pollution originates from outside the city, stressing the need for an airshed level air quality management approach.
1.2 Defining an airshed
Across the world, there are multiple ways of defining airsheds. However, the underlying concept remains the same—expanding the scope of air quality management from a local to a regional scale based on topographical, meteorological, and climatological factors. An airshed is a geographical area frequently affected by the same air mass; hence, the air quality within this area depends on pollution sources inside it and not outside (ADB 2022).
1.3 Airshed management in India
In India, Delhi had its first tryst with a multijurisdictional air quality management body in 1998 when the Ministry of Environment and Forests (the Ministry of Environment, Forests and Climate Change since 2014) created the EPCA in pursuance of the Supreme Court order of 7 January 1998 in the MC Mehta vs Union of India case of 1985 (Supreme Court of India 1998; Government of India 2018). The Government of India mandated the EPCA to take steps to prevent, control, and decrease air pollution in the National Capital Region (NCR). The Government of India vested the EPCA with powers, according to Section 5 of the Environment (Protection) Act, 1986, to direct violators to comply, including stopping polluting operations if need be (Government of India 1986; Government of India 2018). Even though EPCA’s jurisdiction covered the NCR, it had no representation, apart from Delhi, from the states constituting NCR (Government of India 2018, Government of India 2020). It was not until the Government of India established CAQM as a statutory body in August 2021 that the regional air quality management approach with inter-state multi-jurisdictional representation gained legal validity (Government of India 2021a; Government of India 2021b).
The necessity for a regional approach to tackle air pollution in Delhi becomes evident when we look at the contribution from sources outside the city’s limits. Around 42 per cent of the black carbon load in winter and 36 per cent in autumn over Delhi is from the neighbouring NCR states (Bikkina et al. 2019). According to Guo et al. (2019), around 30 per cent of the average PM2.5 load over Delhi comes from neighbouring states annually, with a much higher fraction of secondary PM2.5 (48 per cent) originating in these states than primary PM2.5 (26 per cent).
Even within the NCR, the substantial regional contribution to pollution levels is not a problem only in Delhi. Cities in NCR located downwind of Delhi, like Noida, receive 40 per cent of PM2.5 contribution from Delhi in winter (TERI and ARAI 2018). The outside contribution to pollution woes in NCR cities is, thus, significant, and therefore, the problem requires a multi-jurisdictional, regional management approach for a long-term solution.
Though Delhi grabs the attention for the significant outside contribution to its high air pollution, this problem affects many other Indian cities as well. The Indo-Gangetic Plain (IGP), which stretches from Punjab to West Bengal, is the most polluted region in India (Greenstone and Hasenkopf 2023). IGP cities are especially vulnerable to significant outside contributions to air pollution, with Amritsar and Chandigarh receiving more than 50 per cent of their PM2.5 load from beyond the city (Guttikunda et al. 2019).
As the regional contribution to city-level air pollution in India is becoming a serious concern, the airshed approach is gaining traction in the country. Even though, at present, CAQM is the only regional air quality management body in India, the regional airshed approach has gained currency at the nationallevel discourse on air quality management in the last few years. The NCAP, launched in 2019, acknowledges the regional, as opposed to localised, nature of air pollution and calls for inter-state and inter-city coordination, along with multisectoral synchronisation, to contain the problem (MoEFCC 2019). The NCAP has especially identified air pollution as a regionalscale problem in the IGP region and recommends a regional quality management approach to deal with air pollution effectively in this region (MoEFCC 2019). This shift from the city- to regional-level air quality management approach is evident from the fact that 48 million-plus cities/urban agglomerations identified by the 15th Finance Commission for performance-linked grants to improve air quality are urban agglomerations (MoEFCC 2025).
An airshed is a geographical area frequently affected by the same air mass.
Various state and local governments are also increasingly adopting the airshed approach as a critical tool to curtail air pollution. In 2022, Uttar Pradesh resorted to the airshed model to tackle air pollution with technical assistance from the World Bank and other national and international agencies (Shukla 2022). The same year, four urban local bodies (ULBs) in the Mumbai Metropolitan Region in Maharashtra—Thane, Navi Mumbai, Badlapur, and Ulhasnagar—came together to utilise the funds under NCAP more effectively (Arora-Desai 2022).
1.4 Regional approach is not new in India: Multijurisdictional management of river waters
The adoption of a regional airshed approach to manage air quality is a recent development in India. However, regional multi-jurisdictional management by itself is not new to the country. The Constitution of India contains provisions for the regional management of inter-state rivers and mechanisms for dispute resolution of inter-state river water. As all the major river basins spread across multiple states, inter-state cooperation assumes all the more importance for India’s equitable distribution of river water. However, unilateral actions by one of the states concerning the use, distribution, and control of river waters can impinge on the interests of other states and, hence, lead to potential conflicts.
To prevent conflict situations and facilitate dispute resolution of competing interests, Article 262 of the Constitution of India empowers the Parliament to legislate for resolving disputes about inter-state river water sharing. Exercising this power, the Parliament adopted the Inter-State River Water Disputes Act, 1956, which called for the creation of Water Disputes Tribunals by the central government to adjudicate river water-sharing disputes (Central Water Commission 2022; Government of India 1956).
Till now, the central government has constituted nine water dispute tribunals, with four having given the final decision—Cauvery, Godavari, Krishna-I, and Narmada—binding on all parties (Central Water Commission 2022). In many cases like the Godavari water dispute between Andhra Pradesh, Karnataka, Madhya Pradesh, Maharashtra, and Odisha, the stakeholder states signed mutual agreements to resolve the dispute, which the Tribunal included in its final order (Ministry of Jal Shakti 2017; Central Water Commission 2018).
The case of inter-state river water in India highlights that if the stakeholders are willing to cooperate and work together, then smooth management of natural resources on a regional scale is possible. Air, like river water, is a multi-jurisdictional natural resource. Given the Supreme Court of India has recognised the right to live in a pollution-free environment as part of the fundamental right to life (Government of India 2014), the country should view the regional management of air quality as the most effective method to tackle air pollution.
As the airshed approach becomes critical to curtail air pollution in India, we must learn from global experiences of adopting it. For review, we have selected four airsheds—the Mexico City Metropolitan Area in Mexico (MCMA), the Beijing–Tianjin–Hebei (BTH) region in China, the Santiago Metropolitan Region in Chile, and the Vaal Triangle Airshed Priority Area (VTAPA) in South Africa—to analyse how they applied the airshed approach and its outcomes. We have chosen these four airsheds because of their presence in other emerging market countries like India (Duttagupta and Pazarbasioglu 2021). We aim to understand the successes and failures of airshed management in these four cases and draw lessons from their experiences to guide the effective adoption of the airshed approach in India.
2.1 Assessment framework for the review
Recent studies have assessed the necessity of adopting the airshed approach in India (ADB 2022; World Bank 2023; Roychowdhury and Tembhe 2021). Successful airshed management requires sound administrative structure, scientifically designed interventions, adequate financing, and evaluation of the outcomes of the interventions. Since no two airsheds are alike, we need a common framework to evaluate the air pollution reduction journeys of the reviewed airsheds. Therefore, we ask the following questions:
Rationale
Why was adopting an airshed approach deemed most suitable to address poor air quality in the four airsheds when it was not the only way of managing air quality? Were the local approaches insufficient?
Airshed administration
What was the established administrative structure within the airshed? How was it different from the approach followed before adopting the airshed model? Was it effective in ensuring effective coordination between the stakeholders?
Interventions
What interventions did the airsheds develop? How were these interventions designed? What was the role of scientific tools like air quality modelling in designing these interventions?
Financing
The administration cannot implement the designed interventions without adequate financing. How did the airsheds finance the interventions? What was the role of private participation, if any, in financing the interventions? Was the funding adequate to implement the interventions successfully?
Outcomes
Did the airsheds implement the interventions successfully? How were the outcomes of the deployed interventions measured? Were there shortcomings in the implementation? Did the airsheds recognise the shortcomings and attempt to overcome them?
2.2 Mexico City Metropolitan Area (Mexico)
The airshed management mechanism has operated in the MCMA since 1992. The deteriorating air quality in MCMA led to the adoption of the airshed approach. From 1998 onwards, the emissions inventories showed that the transport sector contributed the largest share of PM2.5 and PM10 emissions (World Bank 2020). Therefore, the metropolis adopted multiple initiatives targeting the transport sector, from weekly vehicle bans to subsidising taxi fleet renewal and interventions to reduce industrial emissions like cleaner fuel transition. These initiatives have paid dividends, with the sulphur dioxide (SO2) and PM10 emissions showing an 89 per cent and 66 per cent decline, respectively, in the 25 years since implementing the Comprehensive Programme against Air Pollution (PICCA) in 1990 (McDonald et al. 2016).
Rationale
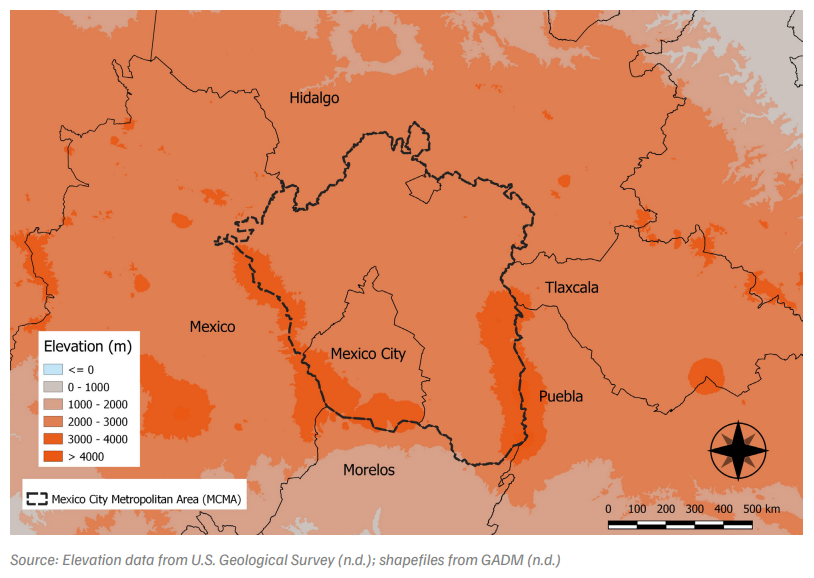
The MCMA, consisting of Mexico City, 59 municipalities in Mexico state, and one in Hidalgo state, lies in an elevated basin at 2,240 meters above the mean sea level (Figure 1). Surrounded by mountains on three sides, MCMA has a subtropical highland climate: a cool, dry season followed by a warm, dry season (Molina et al. 2019). Due to its subtropical climate and high altitude, MCMA is susceptible to high ozone episodes throughout the year (Molina et al. 2019). Nights across the year, characterised by strong temperature inversions and weak winds, experience high primary pollutant concentrations that continue into the morning (Molina et al. 2019). Topography, climate, and meteorology make the MCMA susceptible to high pollution levels; thus, adopting a regional air quality management approach is all the more critical.
Figure 1. The Mexico City Metropolitan Area (MCMA) lies in an elevated basin surrounded by mountains on three sides
Airshed administration
In the 1980s and 1990s, MCMA experienced deteriorating air quality due to increased population growth, industrialisation, and motorisation. The situation hit rock bottom in 1992 when the World Health Organisation (WHO) and the United Nations Environment Programme (UNEP) designated Mexico City as the most polluted megacity in the world (World Bank 2020; WHO and UNEP 1992). As the air pollution crisis peaked, the nation realised the need to address the crisis in MCMA by adopting an airshed approach, creating the first airshed management body, the Metropolitan Commission for Pollution Prevention and Control (MCPPC), in 1992, tasking it with implementing the PICCA in 1992 (Garcia et al. 2020). In 1990, the central and state governments had already rolled out PICCA. Before the formation of the MCPPC, the respective state governments managed the air quality locally in MCMA. However, the only stakeholders represented in MCPPC were Mexico City and Mexico state (Mexico Federal Government 1996). The MCPPC was an ad hoc agency, and with only two concerned stakeholders represented, it lacked the multi-jurisdictional representation required to manage the airshed effectively. So, in 1996, the Metropolitan Environmental Commission (CAM) replaced the MCPPC, a permanent entity created using a constitutional provision for tackling environmental issues (Mexico Federal Government 1996; Garcia et al. 2020).
Various stakeholders collaborated to institutionalise CAM to improve coordination within the airshed. The jurisdiction of CAM comprised Mexico City and 18 municipalities in Mexico state (Mexico Federal Government 1996). The permanent members of CAM were the Secretary of Environment and Natural Resources, the Head of Government of Mexico City, and the Governor of the state of Mexico (Mexico Federal Government 1996; Molina et al. 2019). The temporary members included the Secretaries from key ministries like Health and Energy and the Managing Directors of important public sector companies like Pemex, the national petroleum company, and the Federal Electricity Commission, the state-owned electric utility (Mexico Federal Government 1996).
In 2013, the need arose for the geographical expansion of the regional air quality management programme centred on Mexico City. Mexico City’s urban agglomeration had grown from a metropolis to a megalopolis. Taking into account the expansion of Mexico City into a megapolis, the Megalopolis Environmental Commission (CAMe) replaced CAM in 2013, whose jurisdiction now included, apart from Mexico City, 224 municipalities spread across the five states of Hidalgo, Mexico, Morelos, Puebla, and Tlaxcala (Mexico Federal Government 2013; World Bank 2020). Apart from covering a larger geographical area around Mexico City, CAMe has a more comprehensive constitution compared to its predecessor, with a governing board (consisting of the Ministries of Environment and Natural Resources, the Government of Mexico City, and the other five states) to set the vision for CAMe, an executive coordinator to put the vision into action, and a Scientific Advisory Committee to act as a sounding board for the CAMe’s policies, programmes, and actions (Mexico Federal Government 2013).
Interventions
From 1998 onwards, the emissions inventories showed that the transport sector contributed the largest share of PM2.5 and PM10 emissions. So, the air quality management programmes starting in 2002, the second phase of the Programme to Improve Air Quality (PROAIRE), prioritised the transport sector (World Bank 2020).
Transport sector interventions
In particular, the mandatory vehicle inspection programme, or Programa de Verificación Vehicular Obligatorio (PVVO), started in 1988, and the ‘No driving day’ or Hoy No Circula programme, made mandatory in 1989, synergistically curbed vehicular pollution in Mexico City and 18 municipalities in Mexico state after 1997 (World Bank 2020; Molina et al. 2019; Megalopolis Environmental Commission 2018). The Hoy No Circula policy follows a licence plate number-based ban on vehicles rotating daily. The PVVO policy stipulates a compulsory pollution check of the vehicle every six months (Molina et al. 2019). After the Hoy No Circula programme became mandatory in 1989, households purchasing an additional vehicle, mostly older, contributed to increased air pollution (Eskeland and Feyzioglu 1997). Both these policies reduced vehicular pollution following the introduction of numerical code stickers to identify vehicles’ emission levels in 1997 (Molina et al. 2019). MCMA exempted lower-emitting, newer vehicles with catalytic converters (i.e., manufactured after 1993) from the Hoy No Circula ban in the same year. The result was vehicular fleet renewal and, hence, lower vehicular emissions as people started purchasing the newer models to avail of the exemption from the Hoy No Circula ban (Blackman et al. 2018; Molina et al. 2019).
The government revamped the public transportation system in Mexico City and incentivised taxi overhaul or purchase of newer ones in Mexico City in the second phase of PROAIRE from 2002 to 2010. Taxis contribute disproportionately to the emission load from the transport sector because of their age and the long distances they travel daily (McKinley et al. 2005). To tackle this problem, under PROAIRE 2002–2010, Mexico City decided to scrap over 70 per cent of older taxis and replace them with newer ones. To facilitate this transition, the government provided direct subsidies amounting to USD 1,500 to taxi owners once they disposed of their old taxis and bought new ones (McKinley et al. 2005). The government also made available low-cost loans for taxi overhaul or the purchase of newer taxis (World Bank 2020). On the public transportation front, Mexico City replaced informal buses with a consolidated bus rapid transit (BRT) system, Metrobús, which started services in 2005 during PROAIRE 2002–2010. The service has expanded to seven operational lines catering to over 8 lakh passengers daily (Metrobús 2022; World Bank 2020).
Apart from incentivising vehicle fleet renewal and encouraging the uptake of public transport, the state governments have coordinated with the central government and Pemex via the CAM/ CAMe to implement stricter fuel standards (World Bank 2020). Under CAM/CAMe’s leadership, the authorities reduced the sulphur content in gasoline and diesel in Mexico City and 28 municipalities in Mexico state between 2006 and 2009 (Mexico Federal Government 2006). Mexico City has also been at the forefront of adopting European and US vehicle emission standards (Euro VI or US EPA 2010) as part of the PVVO programme much before their nationwide adoption (World Bank 2020).
Industrial sector interventions
The PROAIRE programmes between 2002 and 2020 have also targeted the industrial sector, leading to lower PM2.5 and PM10 emissions than transport and area emissions (World Bank 2020). Important steps include shutting down an oil refinery, transitioning industrial fuel to natural gas or electricity, and reducing the sulphur content of industrial fuels in 2006 (Mexico Federal Government 2006; BreatheLife2030.org 2018).
Financing
The Mexico City government financed the subsidies and low-cost loans under the taxi fleet renewal policy as part of PROAIRE 2002–2010. The policy bestowed a benefits-to-cost ratio of over 6:1 for fuel savings vis-à-vis government investment. It attracted more private investment than public investment at a ratio of more than 3:1 (McKinley et al. 2005). Spain financed the inaugural line of Metrobús from 2012 to 2019. Switzerland financed the remaining six from 2013 to 2022 under the Clean Development Mechanism (CDM) of the Kyoto Protocol (UN Climate Change 2022a; UN Climate Change 2022b). The CDM scheme allows countries with emission reduction or limitation commitments under the Kyoto Protocol to finance emission reduction projects in developing countries through which they earn countable emission reduction credits, which help them in their bid to meet the Kyoto Protocol commitments (UN Climate Change 2022c; UN Climate Change 2022d).
In 2006, the federal government of Mexico created the Metropolitan Fund to finance projects aimed at the sustainable development of the MCMA and, in the process, promote coordination between the implementing authorities with a long-term vision in mind (Mejia 2015). State-level entities (which includes Mexico City) contribute to the Fund, and the federal government matches their contributions on a one-toone basis (Rivas Tovar 2008). In 2014, all states of CAMe contributed around USD 0.3 from the vehicle inspection fees collected for every mandatory vehicle inspection under PVVO to the Metropolitan Fund (Garcia et al. 2020; World Bank 2020). In its first year, the Metropolitan Fund mobilised around USD 117 million to finance the public transport vehicle fleet renewal in the MCMA (Garcia et al. 2020; Rivas Tovar 2008).
The Metropolitan Fund complements the Environmental Trust Fund created in 1992 to finance new programmes aimed at improving air quality in MCMA, which for a brief period received funding from a gasoline tax under the polluter pays principle (World Bank 2020; Garcia et al. 2020). The federal government created this trust fund to aid MCPPC and then CAM and CAMe in their projects (Garcia et al. 2020). In 2014, Mexico City also created a USD 10 million trust to install catalytic converters in more than 1.6 lakh vehicles older than 15 years (Garcia et al. 2020).
Outcomes
Since Mexico rolled out MCMA’s first air quality management programme, PICCA, in 1990, air pollution saw a downward trend in the next 25 years, with SO2 and PM10 emissions decreasing by 89 per cent and 66 per cent, respectively (McDonald et al. 2016). Also, according to Bel and Holst (2018), the Metrobús system has reduced the concentration of PM10, nitogen oxides (NOx), and carbon monoxide (CO) in Mexico City by 5–9 per cent.
The implementing authorities can improve horizontal and vertical cooperation for allocating and distributing financial resources to ensure that the municipalities have a substantial say in acquiring funds. The states and municipalities must set up a Metropolitan Development Council (MDC) to access financial resources under the Metropolitan Fund. The MDC has representation only from the state governments, and the decision even to have representation from municipalities lies entirely with the states (Garcia et al. 2020; Diaz Aldret 2018). Therefore, the states have a hegemony regarding access to financial resources, defeating the purpose of having a consolidated fund, with even the inter-state cooperation usually lasting until the MDC disburses the funds. Without any incentive for inter-state cooperation, let alone between states and municipalities, the state governments use the Metropolitan Fund to carry out projects they had already planned or those the governors/heads of government had promised during their term in office (Diaz Aldret 2018).
2.3 Beijing-Tianjin-Hebei region (China)
Even though Beijing started addressing poor air quality in the 1990s. The steps taken were ineffective as the focus was on the urban core and not the entire BTH region, which contributes about one-third of the pollution load in the major cities in the region (World Bank 2020; UN Environment 2019). This approach changed in 2013 when China’s State Council released the Air Pollution Prevention and Control Action Plan (APPCAP) for 2013–17, setting air pollution reduction targets for Beijing and the larger BTH region (State Council of the People’s Republic of China 2013). Soon after, the State Council created the Coordination Group for Air Pollution Prevention and Control in BTH and Surrounding Areas, a body involving central government ministries and provincial-level governments to coordinate and monitor air pollution reduction in the BTH region (World Bank 2020; UN Environment 2019; ADB 2019). These twin steps proved effective as the previous disjointed efforts, like the industrial and residential fuel transition to cleaner fuels like electricity and natural gas, achieved cohesion across the BTH region, reducing the annual average PM2.5 levels in Beijing by 42 per cent and in the BTH region by 40 per cent (World Bank 2020; UN Environment 2019).
Rationale
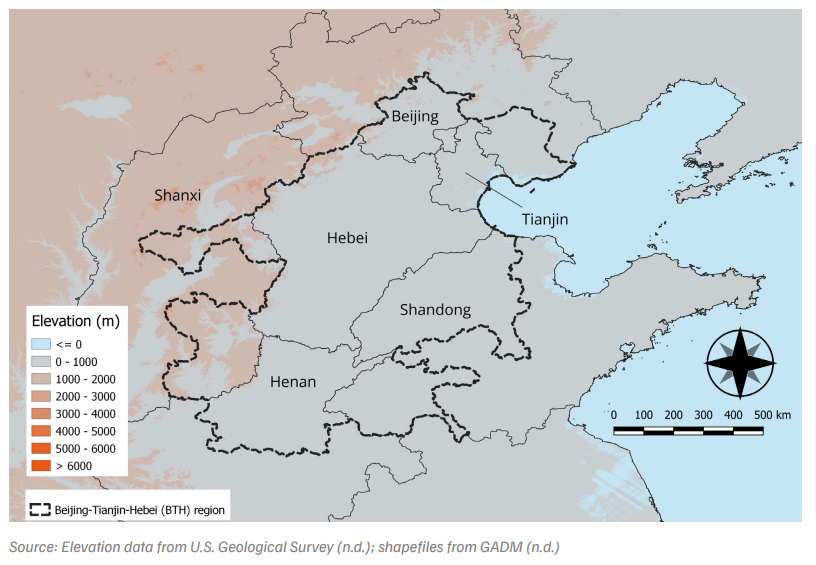
Beijing municipality initiated measures to improve air quality in the 1990s. However, the air pollution did not reduce as about one-third of the PM2.5 load in Beijing and Tianjin in 2012–13 and Shijiazhuang in Hebei province in 2013–14 originated from elsewhere in the BTH region (World Bank 2020; UN Environment 2019). Because of this significantly large outside contribution, the concerned authorities at the centre and in the region realised the need to address Beijing’s air pollution problem on a regional scale. The APPCAP for the period 2013–17, released by China’s State Council, set PM2.5 reduction targets for both Beijing (33 per cent) and the BTH region (25 per cent) and the State Council operationalised the Coordination Group for Air Pollution Prevention and Control in BTH and Surrounding Areas for multi-jurisdictional coordination soon after (State Council of the People’s Republic of China 2013; UN Environment 2019; World Bank 2020; ADB 2019). The BTH airshed comprises Beijing and Tianjin municipalities and 26 cities in the Hebei, Henan, Shandong, and Shanxi provinces (Figure 2).
Figure 2. The Beijing–Tianjin–Hebei airshed in China spans six provinces
Airshed administration
Following the implementation of the APPCAP in 2013, the State Council established the Coordination Group for Air Pollution Prevention and Control in BTH and Surrounding Areas, a body involving both central government ministries and provincial-level governments to coordinate and monitor air pollution reduction in the BTH region. The Coordination Group comprises seven provincial-level governments- six in the BTH region (Beijing, Tianjin, Hebei, Shandong, Shanxi, and Henan) and Inner Mongolia and eight relevant central government agencies, including the Ministry of Ecology and Environment, Ministry of Finance and Ministry of Transport (World Bank 2020; ADB 2019; UN Environment 2019).
In July 2018, China’s State Council elevated the status of the Coordination Group, with the Minister of Ecology and Environment and the Governors of Beijing, Tianjin, and Hebei becoming vice-chairs. The Coordination Group also increased the representation of the relevant stakeholders by including the viceministers of key central government agencies like the Ministry of Agriculture and China Meteorology Administration in the Coordination Group (World Bank 2020). The State Council mandated the Coordination Group to prepare annual implementation plans for air pollution reduction in the BTH region and decide the policies for multijurisdictional matters such as fuel standards, energy supply, and public transportation (World Bank 2020; UN Environment 2019). Following the APPCAP, the concerned agencies drew up regional, provincial, and city-level air quality management plans for 2013–17 (World Bank 2020; UN Environment 2019).
In addition to creating the high-level coordination group, the State Council of China also introduced measures to ensure accountability at the bureaucratic level. In 2014, the State Council issued rules to evaluate the annual performance of bureaucrats based on the official responsibilities defined in the local-level air pollution prevention and control action plans (State Council of the People’s Republic of China 2014). Under these rules, officials who failed to meet air pollution reduction targets for 2017 had to appear before the State Council, and the authority would suspend approvals for new development projects in the area under their jurisdiction (World Bank 2020). As the annual reviews determine financial bonuses and future career prospects, incorporating such targets in the review process has become key in dictating officials’ behaviour even though problems like target rigidity and cyclical behaviour exist (Wang 2013; Kostka 2015). The concerned authorities demote officials who consistently fail to meet the targets, reassign them to a less prestigious area, or even expel them from service (World Bank 2020). As the national-level APPCAP was coming to a close in 2017, the Ministry of Ecology and Environment claimed that it had disciplined about 12,000 officials for their unsatisfactory efforts to address environmental problems (Gan 2017).
Interventions
According to the source apportionment studies conducted in 2012–13 in Beijing and Tianjin and in 2013–14 in Shijiazhuang in Hebei province, 41–54 per cent of the PM2.5 load came from coal combustion and industrial production (World Bank 2020; UN Environment 2019). The state governments in the BTH region primarily targeted these two sectors in 2013–17 to meet the APPCAP targets.
Industrial fuel transition from coal to gas
In 2005, Beijing started the coal-to-gas transformation process with power plants gradually transitioning from coal to natural gas. So even though the power generation went up after 2005, coal consumption in power plants decreased by 2.5 million tons by 2013 (UN Environment 2019). On the other hand, natural gas consumption rose to 1.85 billion m3 in 2013, accounting for 35 per cent of fossil fuel consumption in power generation (UN Environment 2019).
Following the national, regional, provincial, and citylevel clean air action plans in 2013, the provincial and city governments ramped up the coal-to-gas transformation process. For instance, Beijing commissioned four natural gas-fired thermoelectric power plants between 2013 and 2017 to replace the four remaining coal-fired power plants (UN Environment 2019). As a result, the annual coal consumption decreased by 8.5 million tons. By 2017, Beijing’s power plants had almost completely switched over from coal, consuming 7.4 billion m3 of natural gas, which was 85 per cent of the fuel consumed by power plants (UN Environment 2019).
Beijing has actively endeavoured to create coalfree areas since 1998 in a four-phase process, and the process gathered steam in the fourth phase in 2013–17 with over 27,300 MW of coal-based boilers either converted or eliminated. Apart from phasing out coal in industries, the Chinese government started offering an electricity price subsidy to coal-fired power plants with flue gas desulphurisation in 2004 and to coal-fired power plants with selective catalytic reduction-based denitrification facilities in 2011. In 2013, the government fixed the price subsidies for desulphurisation, denitrification, and dust removal at 0.002 USD/kWh, 0.001 USD/kWh, and 0.0003 USD/kWh, respectively (James 2017; NDRC 2013). In 2017, to reduce NOx emissions, the Beijing municipality offered subsidies to industries with small boilers (with steam capacities under 20 tons) in the range of about USD 13,500 to about USD 81,000 for retrofitting with the district-level authorities within the municipality of Beijing expected to provide matching subsidies (World Bank 2020).
Residential fuel transition from coal to cleaner fuels
Apart from ramping up coal substitution in power plants, the provincial and city governments also promoted coal substitution in households for heating and cooking purposes from 1998 to 2017 via subsidisation of the upfront cost of cleaner energy alternatives and reducing electricity tariffs in the winter months. Beijing municipality subsidised the switch from coal to electric heating by providing around USD 3,370 to each rural and peri-urban household, bringing down the cost of electric heaters to around USD 421 per household (Xinhua 2017). At the same time, the government lowered the electricity tariff rate during winter nights to make electric heaters an attractive option compared to burning coal; the cost of burning coal was around USD 702, while the electricity cost of using electric heaters was around USD 233 per household (Cong et al. 2017; Xinhua 2017).
By 2015, around seven lakh households in the six urban districts of Beijing municipality had replaced coal with cleaner energy alternatives (primarily natural gas or electricity) for heating and cooking, effectively making them coal-free (UN Environment 2019). In the years that followed, the transition programme to cleaner energy in households expanded to the peri-urban and rural districts in the municipality, with coal consumption reduced by nearly 1 million tons, rendering households in Beijing municipality coal-free (UN Environment 2019).
Outcome of the fuel transitions
Through this multi-pronged targeting of coal use, Beijing cut its coal consumption from 28 million tons in 2013 to below 5 million tons in 2017 and consequently, its share in energy consumption went down from 23.3 per cent to about 5.7 per cent (UN Environment 2019).
Industrial reform
Regarding the industrial sector, Beijing focused on optimising the sector’s functioning by eliminating obsolete production capacity and improving the end-of-pipe pollution control to reduce emissions (UN Environment 2019). To this end, between 2013 and 2017, Beijing closed down or relocated 1,992 polluting industrial units in sectors like steel and chemicals (World Bank 2020; UN Environment 2019). Moreover, the provincial and city governments provided other industrial enterprises financial assistance for retrofitting and improving end-of-pipe controls (World Bank 2020).
Financing
In 2013–17, the central government provided USD 8.8 billion to the BTH provinces under APPCAP (Ministry of Ecology and Environment of People’s Republic of China 2018). The individual provinces also pumped in funds according to their financial capacity to support on-ground action to tackle air pollution in their jurisdiction. For example, in 2016, the province of Hebei received around USD 563 million from the centre and around USD 127 million from the municipalities of Beijing and Tianjin to implement its provincial action plan while arranging around USD 302 million from its resources in 2017 (Zhili 2017). Financially stronger cities provided financial and technical support to other cities in the BTH region starting in 2015 in a twinning-based arrangement, exemplifying inter-city coordination. For instance, the municipality of Beijing supported Baoding and Langfang cities in Hebei province with financial and technical assistance to phase out small coal-fired boilers and regulate large coal-fired boilers (UN Environment 2019).
Outcomes
The municipality of Beijing and the BTH region managed to exceed the air pollution reduction targets as set in the national-level APPCAP of 2013; the annual average PM2.5 levels dropped by 42 per cent in Beijing, from ~100 μg/m3 in 2013 (Martini et al. 2015) to 58 μg/m3 in 2017, while the annual average PM2.5 levels in the BTH region reduced by close to 40 per cent (World Bank 2020; Cheng et al. 2019).
The intensive emission reduction initiatives in the period between 2013 and 2017 reduced air pollution, with measures undertaken within Beijing municipality lowering the annual average PM2.5 in Beijing by around 21 μg/m3 (65 per cent), while those undertaken in the rest of the BTH region reducing the annual average PM2.5 levels by around 7 μg/m3 (23 per cent) within the city (Cheng et al. 2019). Among the emission reduction measures, the conversion or elimination of coal-fired boilers, the promotion of cleaner fuels for residential heating and cooking, and industrial optimisation and retrofitting contributed the most to the lowering of PM2.5 levels in Beijing, accounting for 5.9 μg/m3 (19 per cent), 5.3 μg/m3 (17 per cent), and 5 μg/m3 (16 per cent) of the reduction in annual average PM2.5 levels, respectively (Cheng et al. 2019). The fact that these interventions reduced the PM2.5 contribution from coal combustion and industrial production became evident from the source apportionment study carried out in Beijing in 2017; the two sectors together accounted for 15 per cent of the PM2.5 load, which was down from 41 per cent in 2012–13 (UN Environment 2019).
Even though Beijing reduced air pollution between 2013 and 2017, the annual average PM2.5 levels in the city were much higher than the Chinese air quality standard of 35 μg/m3 in 2017.
2.4 Santiago Metropolitan Region (Chile)
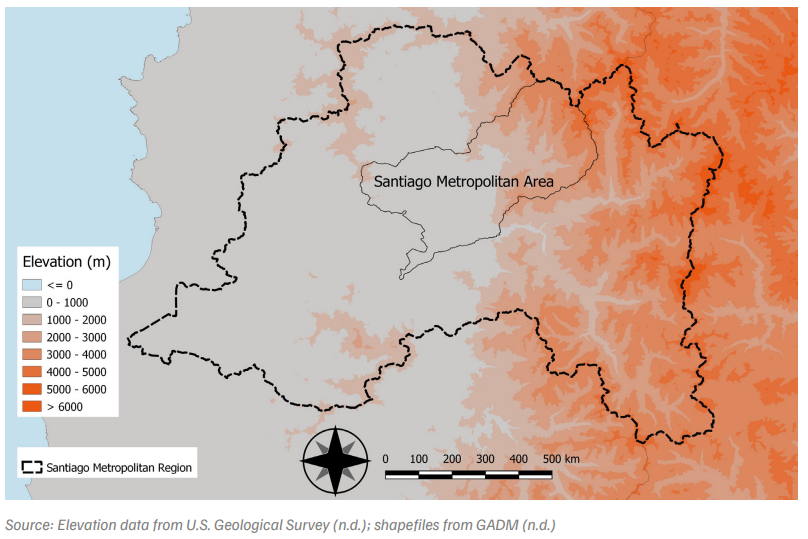
The Santiago Metropolitan Area, a metropolis in the larger Santiago Metropolitan Region, lies in a mountain basin. In the autumn–winter period from April to August, the region is susceptible to pollution close to the surface (Chile Ministry of Environment 2017; Mullins and Bharadwaj 2015; Vargas 2008). This region’s topography and meteorology make it a suitable candidate for applying the airshed approach.
Managed by the regional government, the Santiago Metropolitan Region periodically releases the Plan to Prevent and Reduce Air Pollution (PPDA) to address air pollution in the region, with the latest PPDA released in 2017. Multiple programmes have helped the region reduce air pollution since 1989, such as integrating all the modes of public transport by introducing a magnetic payment card under the Transantiago programme and diversifying natural gas supplies away from Argentina through the operationalisation of a liquefied natural gas (LNG) terminal (Muñoz et al. 2015; Red Metropolitana de Movilidad 2022; GNL Quintero 2022a; AGN 2019).
As a result of these efforts, the annual average PM2.5 concentration in the Santiago Metropolitan Region decreased from 69 μg/m3 in 1989 to 22 μg/m3 in 2015, even though residential wood burning for heating purposes contributes to pollution and needs attention (Chile Ministry of Environment 2017).
Rationale
The Chilean capital, Santiago Metropolitan Area, is an agglomeration of 34 local administrative units within the Santiago Metropolitan Region, spread over three provinces. The Santiago Metropolitan Region lies in a basin bound by the Chilean Coastal Range on the west and the Andes Mountains on the east. It is also separated from its neighbouring northern region of Valparaiso by the Chacabuco mountain range and by the hills of Angostura and Chada from its neighbouring southern region of Libertador General Bernardo O’ Higgins. Apart from the fact that mountains and hills surround the region from all sides, the region is highly susceptible to high air pollution due to strong temperature inversions close to the surface occurring mainly in the autumn–winter period, which in the Southern Hemisphere runs from April to August (Chile Ministry of Environment 2017; Mullins and Bharadwaj 2015; Vargas 2008). The region’s meteorology and topography exacerbate its air pollution in the autumn–winter months, with daily PM2.5 concentration often exceeding 150 μg/m3 (IEc 2018). These topographical, climatological, and meteorological factors make it necessary to manage air quality with the region considered an airshed.
Figure 3. The Santiago Metropolitan Region lies in a basin surrounded by mountains on all sides
Airshed administration
The regional government of the Santiago Metropolitan Region is responsible for the on-ground implementation of air pollution reduction measures within the Santiago Metropolitan Region. The Ministry of Environment releases the PPDA for the Santiago Metropolitan Region periodically, with the latest one released in 2017.
Interventions
The Santiago Metropolitan Region targeted the transport, industrial, and residential sectors starting in 1990 with the publication of the first regulatory plans (Pino et al. 2015).
Transport sector reforms
The revamping of public transport commenced in 1990, with 3,000 buses removed from operations due to violating pollution norms. Santiago Metropolitan Region has carried out this weedingout process periodically since 1990 (Pino et al. 2015; Chile Ministry of Environment 2017). The operationalisation of Transantiago (Red Metropolitana de Movilidad since 2019), the fully integrated public transport system covering the entire Santiago Metropolitan Area, began in 2007. The system includes a bus service, the Santiago Metro, and the interprovincial train service, MetroTren Nos (Red Metropolitana de Movilidad 2022). Touted as a ‘big-bang’ reform, Transantiago brought all the modes of public transport under one roof, simplifying travel in the Santiago Metropolitan Area by introducing the magnetic payment card (Muñoz et al. 2015; Red Metropolitana de Movilidad 2022). However, in the initial days, the number of buses and the accompanying infrastructure were inadequate to match the commuters’ demand. Slowly, the system stabilised with the number of buses and the segregated bus corridors increasing in the first few years (Muñoz et al. 2015).
The positive long-term benefits of Transantiago were visible once the system stabilised after the initial hiccups. PM2.5 levels and the incidents of high pollution episodes came down even though the metropolis grew economically and the vehicle fleet expanded. The expansion of the metro network and the newer commissioned buses adhering to stricter technological standards reduced air pollution levels (Muñoz et al. 2015).
Tightening vehicle fuel standards
Alongside interventions aimed at strengthening the public transport system, the vehicle fuel standards in the Santiago Metropolitan Area have become stricter over the years, with the maximum sulphur limit in diesel progressively lowered, starting in 1993 (Pino et al. 2015). The current limit is 15 ppm, set in 2010–11 in the Santiago Metropolitan Region (TransportPolicy.net 2018a). The introduction of catalytic converters in 1991 and a progressive reduction in the sulphur content in diesel helped reduce transport emissions (Chile Ministry of Environment 2017; Pino et al. 2015). The phase-out of leaded fuels in 2001 further reduced air pollution (Chile Ministry of Environment 2017; Pino et al. 2015).
Diversification of natural gas supply
To mitigate pollution from industries, Chile partnered with Argentina in 1995 to import cheap Argentine natural gas to central Chile, which includes the Santiago Metropolitan Region (Barrionuevo 2007; AGN 2019). In 1997, the natural gas supply to central Chile commenced and helped lower the PM2.5 levels in the capital (AGN 2019; Chile Ministry of Environment 2017). But, starting in 2004, Argentina reduced its supply to Chile, with the supply cuts becoming particularly severe in 2007 (AGN 2019; Barrionuevo 2007; Sreeharsha 2008; Vargas 2008). The energy crisis forced the capital’s power plants and industrial units to switch to the costlier and more polluting diesel and fuel oil (Barrionuevo 2007). That year, the city experienced the highest number of high pollution episodes in seven years (Barrionuevo 2007).
The uncertainty over the natural gas supply from Argentina compelled Chile to diversify its natural gas supplies. In 2007, a public–private consortium came together to create a business corporation, GNL Quintero, and establish an LNG terminal on the Pacific coast in the Quintero commune in the Valparaiso region in central Chile to receive, unload, store, regasify, and distribute LNG from Trinidad and Tobago, the US, and Equatorial Guinea, with Santiago Metropolitan Region being a beneficiary (AGN 2019; GNL Quintero 2022a). GNL Chile, another public– private consortium, has contracted the GNL Quintero terminal to supply LNG within Chile (GNL Quintero 2022a; GNL Chile n.d.). Within seven years of the Quintero terminal starting its operations in 2009, the Chilean energy situation became so secure that in 2016, Chile began to supply three million cubic metres of LNG daily to Argentina from the terminal to match the increased energy demand in winter (De la Jara 2016; AGN 2019).
Financing
The government subsidises the operations of the integrated public transport system, Transantiago, using budgetary outlays. Around 40 per cent of the total operating cost of Transantiago is covered by government subsidy, amounting to USD 50 million (Muñoz et al., 2015). GNL Quintero is a business enterprise with private players, EIG and Fluxys, owning 80 per cent of the stake and state-owned National Petroleum Company (ENAP) retaining the remaining 20 per cent (GNL Quintero 2022b)
Outcomes
Even though the Santiago Metropolitan Region has witnessed a reduction in PM2.5 levels since the 1990s, the annual average PM2.5 in 2015 was 22 μg/m3 , slightly higher than the Chilean annual standard of 20 μg/m3 but drastically lower than 69 μg/m3 in 1989 (Chile Ministry of Environment 2017). Also, as of 2016, the number of pollution episodes due to PM10 and PM2.5 had decreased since 1997 and 2014, respectively (Chile Ministry of Environment 2017).
Residential wood burning is the single most significant contributor to PM2.5 (31–39 per cent), highlighted in the emission inventory and source apportionment studies commissioned by Chile’s Ministry of Environment for the Santiago Metropolitan Region and in other source apportionment studies (Chile Ministry of Environment 2017; IEc 2018; Barraza et al. 2017). The regional governments in central and southern Chile, aware of this problem, utilise central government subsidy schemes to encourage households to exchange firewood-based heaters with more efficient heaters and thermally refurbish their houses to increase their thermal efficiency (Schueftan and Gonzalez 2015; Ruiz-Tagle and Schueftan 2021). The regional governments also certify firewood based on the moisture content to limit the moisture level to 25 per cent (Schueftan and Gonzalez 2015). However, these programmes have failed to reduce air pollution levels as the regional governments focused on fuelwood certification and heater replacement programmes, not on the more effective thermal refurbishment programme (Schueftan and Gonzalez 2015). The unacceptable pollution levels in the capital region forced the Santiago Metropolitan Region government to prohibit firewood and other wood derivative-based heaters in the Santiago Metropolitan Area, with only wood pellet-based heaters allowed to operate, according to the latest PPDA of 2017 (Chile Ministry of Environment 2017).
The airshed approach in Santiago resulted in reduction of PM2.5 levels from from 69 μg/m3 in 1989 to 22 μg/m3 in 2015.
2.5 Vaal Triangle Airshed Priority Area (South Africa)
South Africa created its first airshed management plan in 2008. Although it was ambitious and well-intentioned, ineffective coordination, weak implementation, and lack of financing led to its failure. In this section, we discuss the rationale behind the airshed management plan of the VTAPA, its design and objectives, and the reasons behind its failure.
Rationale
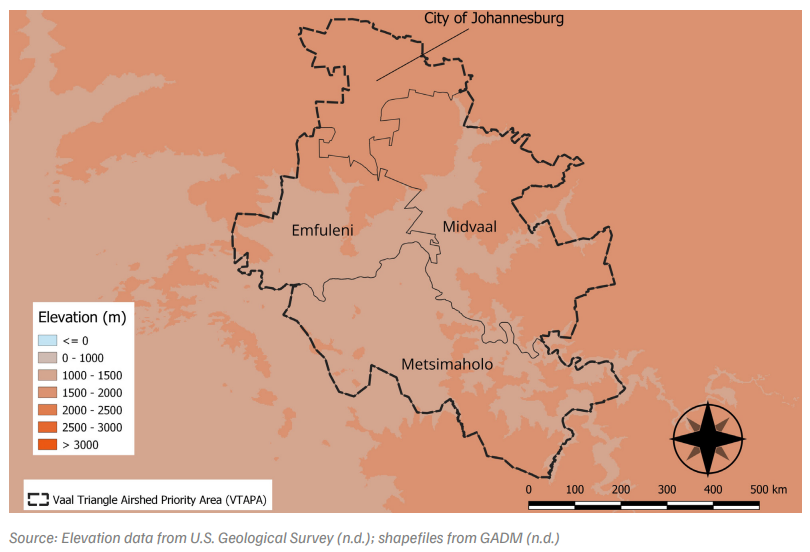
South Africa formulated the Atmospheric Pollution Prevention Act (APPA) as early as 1965 to tackle industrial pollution. But the Act suffered from several shortcomings—lack of focus on non-industrial pollution sources, absence of enforceable air quality standards, and not having a mechanism of enforcement through a legislation, among others (Naiker et al. 2012). The Parliament of South Africa passed the National Environmental Management: Air Quality Act 39 of 2004 (AQA) (Government of South Africa 2005) to replace APPA with the aim of improving the air quality in the country. The Act led to the creation of the National Framework for Air Quality Management, which established the National Ambient Air Quality Standards (NAAQS) and the South African Air Quality Information System (SAAQIS) (Moreone et al. 2021, Gwaze and Mashele 2018). The Act included the provision to create priority areas, enabling the adoption of airshed management in the country. The Act defined Priority areas, which could span multiple provinces, to be the regions where pollution levels were above the national ambient air quality standards. The VTAPA is the first of the three priority areas created following the implementation of the Act. As shown in Figure 4, VTAPA includes parts of the Johannesburg municipality and the local municipalities of Emfuleni, Midvaal, and Metsimaholo (South Africa DFFE 2021). Emfuleni and Midvaal are local municipalities within the Sedibeng District Municipality (SDM), while Mestimaholo is a local municipality within the Fezile Dabi District Municipality (FDDM). The primary reason for declaring the Vaal Triangle region as a priority area is because of the high concentration of pollutants, especially particulate matter, in the region (South Africa DFFE 2009).
VTAPA lies in a region dominated by anticyclonic conditions in winter, leading to the trapping of pollutants (Tyson and Crimp 1998). Moreover, it is home to several small and large industries, including mining. The region also has several informal settlements that use coal and wood as fuel sources (South Africa DFFE 2009). Known as ‘Vuil Driehoek’ (‘Dirty Triangle’ in Afrikaans) to the locals, the health impacts of air pollution in the region are well known since the 1980s (Joubert 2021). The locals coined the term ‘Sasol Chest’ to refer to the widespread complaints of chest and airway infections and asthma. Scientific studies on the health impacts of air pollution in this region began in the early 1990s (Terblanche et al. 1992).
Figure 4. Vaal Triangle Airshed Priority Area (VTAPA) is the first airshed in South Africa
Airshed administration
The first Air Quality Management Plan (first-generation AQMP) for the region, made public in 2009, listed ambient air quality limits for seven pollutants including PM10 but excluded PM2.5. The authorities used the air quality monitoring data available at the time and dispersion modelling to create the list of priority pollutants. The then Department of Environmental Affairs and Tourism (DEAT) was responsible for implementing the plan by coordinating with municipalities and industrial stakeholders. The department is now known as the Department of Forestry, Fisheries and the Environment (DFFE). Before the implementation of AQA in 2004, the local municipalities did not have a role in air pollution control as both the development of pollution control policies and their implementation was under the purview of the national government. Currently, the powers of emission control and legislation enforcement lie with the local municipalities while the responsibility of policy development rests with the national government (Naiker et al. 2012).
Interventions
The first-generation AQMP listed 71 interventions across 11 problem complexes to improve air quality. The problem complexes included government capacity for air quality management and information management. The interventions identified in the firstgeneration AQMP were short term (to be implemented in one to two years), medium term (three to five years), or long term (five to ten years) (South Africa DFFE 2009). Appendix B of the final second-generation AQMP for VTAPA lists the status of these interventions, as of 2019 (South Africa DFFE 2021).
Biomass emissions
Veld fires are the predominant source of biomass emissions in VTAPA. The interventions to curb biomass emissions included quantifying burnt area and emissions, the development of an inversion earlywarning system, and identifying international best practices to curb controlled and uncontrolled burning. As of 2019, these were unmet.
Domestic emissions
Burning of coal for cooking and heating is common in informal settlements. The interventions designed in the first AQMP to curb domestic emissions were specifically aimed at the townships of Orange Farm and Zamdela. Uptake of Basa Njenjo Magogo (BNM) or Top-Down Ignition by residents of the informal settlements was one of the interventions. In BNM, an ignitable material like paper, wood, or cloth covers the coal placed at the bottom of a brazier stove. Once the burning starts, a few pieces of coal are added to the ignitable material. BNM can reduce emissions by up to 90 per cent compared to the traditional methods (Makonese et al. 2017). The objective of the BNM uptake intervention was to cut PM10 emissions by 50 per cent and other pollutants by 20 per cent.
The then DEAT was responsible for the implementation of this intervention in coordination with the local municipalities. The South African public utility companies Eskom and Sasol Limited (Sasol) were the sponsors of the programme. The status of the programme remained unknown as of 2019.
Electrification of households to curb PM10 and SO2 emissions was the other intervention planned. PM10 and SO2 concentrations declined in Zamdela post-electrification. However, the effect of the intervention in Orange Farm is unknown due to the lack of monitoring, as acknowledged in the secondgeneration AQMP.
Industrial emissions
The industrial sectors identified as sources of pollution in the first-generation AQMP were iron and steel, manganese, coal mining, petrochemical, power generation, and other smaller industries. We briefly describe the identified interventions for each sector and their status as of 2019 (South Africa DFFE 2021):
i. Iron and steel
ArcelorMittal, the operator of the steel plant in the region, was responsible for implementing the interventions identified for the iron and steel sector. The interventions identified to reduce fugitive emissions from blast furnaces and waste disposal, particulate potassium chloride emissions, and emissions from wet scrubbing were successfully implemented. The installation of a coke oven gas plant and a water cleaning plant to reduce SO2 emissions was incomplete as of 2019. The installation of a sinter gas cleaning unit to reduce PM10 and SO2emissions was also incomplete.
ii. Manganese
Metalloys was responsible for implementing the interventions identified for the manganese industry. It implemented dust suppression at its material handling and transportation facilities successfully. The methods though were ‘highly ineffective’ despite their implementation. Capital constraints delayed the installation of a secondary flume extraction system and an online stack monitoring system. Metalloys collected data on all sources of pollutants and created an updated emissions inventory. It carried out dispersion modelling and installed a dust fallout monitoring system. It created a new air quality management plan and a strategy to reduce emissions using the collected data. However, the status of the projects designed following the new strategy was ‘not known’ as of 2019.
iii. Coal mining
New Vaal Colliery was responsible for implementing the interventions identified for the coal mining sector. The interventions included the installation of a dust fallout monitoring system and a dust suppression system. As of 2019, the installation of both systems was incomplete. Dust sampling was ‘ongoing’ as of 2019 and the status of the installation of the PM10 monitor was ‘not known’.
Vaal Triangle Airshed Priority Area in South Africa did not achieve any significant results with the airshed approach.
iv. Petrochemical industry
Sasol and National Petroleum Refiners of South Africa (NATREF) were responsible for implementing the interventions identified for the petrochemical sector. Sasol managed to achieve a significant reduction in hydrogen sulphide (H2S), SO2, and NOx emissions after converting to natural gas for its energy needs. It also completed the installation of ambient air quality monitoring stations, the network of which is expanding. As of 2019, Sasol was in the process of implementing plans to achieve particulate emissions below 50 mg/m3 by 2025. The installation of a Sulphur Recovery Unit and a switch to low-sulphur crude were among the interventions identified for NATREF. The status of both interventions was ‘not known’ as of 2019. Both Sasol and NATREF were to implement emission offset projects. These projects predominantly involved reducing biomass emissions by waste removal and fire extinguishing. The status of the projects was ‘ongoing’ as of 2019.
v. Power generation
Eskom operates the Lethabo power station, the only power generation facility in the Vaal Triangle area. One of the interventions identified for Eskom was reducing SO2 emissions from the power plant by either installing Flue Gas Desulphurisation (FGD) or Coal Beneficiation. Eskom failed to implement the intervention. The status of the installation of a network to monitor fugitive emissions from the power plant’s ash dump remained ‘not known’ as of 2019. Eskom installed a Continuous Emission Monitoring System (CEMS) to measure the concentrations of SO2, NOx, CO, and oxygen (O2) at the plant. It also commissioned an ambient air quality monitoring station. The addition of gas analysers to the station to monitor the concentrations of SO2 and NOx and a beta gauge to monitor PM10 concentrations was ‘ongoing’ as of 2019. Eskom successfully implemented the interventions related to energy efficiency measures at the power plant. A programme to improve energy efficiency at all its facilities was ‘ongoing’ as of 2019.
vi. Small industries and commercial operations
Local municipalities and DEAT were responsible for implementing the interventions identified for small industries and commercial operations. The local municipalities were also tasked with the creation of databases and emission inventories of small industries. But the municipalities could not complete the task. DEAT and the local municipalities also did not develop a permit system and issue permits to regulate emissions from small industries, as directed by the first AQMP. Except for the City of Johannesburg, no other municipality developed air pollution control by-laws. The only successfully implemented intervention was the declaration of small boilers as controlled emitters.
Transport emissions
Implementation of transport-related interventions was the responsibility of both DEAT and the municipalities. The municipalities created vehicle emission databases. They did not monitor the emissions in collaboration with Cape Town and did not implement the synchronisation of traffic lights, as directed. DEAT did not declare vehicles as controlled emitters and establish vehicle emission standards.
Emissions from waste burning
DEAT and the municipalities were responsible for implementing the interventions related to waste burning. The interventions identified for the municipalities were developing an emission inventory of waste burning sources and establishing a reliable waste collection service. The municipalities failed at implementing both these plans. DEAT developed a national legislation for dioxin control, as directed. It did not complete the permitting and regulating of nonpermitted landfills aimed at controlling unregulated waste burning.
Capacity and information management-related interventions
The government stakeholders established dedicated air quality divisions and appointed trained air quality officers at each level of the government. However, DEAT did not create marketing campaigns to communicate the significance of air quality improvement in VTAPA, as directed. DEAT and the South African Weather Service (SAWS) created a centralised air quality monitoring database and a comprehensive emissions inventory of VTAPA. DEAT, in collaboration with SDM, achieved the accreditation of the air quality monitors in the region by the South African National Accreditation Standards (SANAS).
Financing
The AQMP provided cost estimates for interventions involving government stakeholders wherever possible but not the sources of funds. In fact, neither the first nor the newer second-generation AQMP has identified sources of funding (Moreone et al. 2021).
Even in the case of the interventions for the private sector, lack of funds and/or the escalation of costs hampered the implementation. The AQMP did not identify a funding mechanism involving grants or loans from other countries or international financial institutions.
Outcomes
The first-generation AQMP for VTAPA required coordination and cooperation between different levels of government and the private sector. The status of many interventions remained unknown despite a single supervising agency, DEAT, tasked with monitoring and implementing the plan, thus highlighting the ineffectiveness of this government agency. Industrial stakeholders were comparatively successful in meeting the objectives identified for them in the AQMP. The performance of government bodies was unsatisfactory. The assumption that the government stakeholders would have enough funding and capacity to implement the interventions failed.
The air pollution problem in VTAPA, therefore, remains unsolved. Only four of the six ambient air quality monitoring stations show a statistically significant declining trend in PM10 concentrations (Feig et al. 2019). The reduction in values of PM10 was 4.68 μg/m3 per year at the Zamdela station, 1.37 μg/m3 per year at Sebokeng, 1.16 μg/m3 per year, and 1.56 μg/m3 per year at Diepkloof, as of 2017. The stations at Kliprivier and Three Rivers show an increase in PM10concentrations with time. Only the Diepkloof station was compliant with the NAAQS, with the annual average PM10 concentration in 2021 being 39.23 μg/m3 . Even with these rates of decline, it may take decades before all the stations in VTAPA become NAAQS compliant.
was 4.68 μg/m3 per year at the Zamdela station, 1.37 μg/m3 per year at Sebokeng, 1.16 μg/m3 per year, and 1.56 μg/m3 per year at Diepkloof, as of 2017. The stations at Kliprivier and Three Rivers show an increase in PM10concentrations with time. Only the Diepkloof station was compliant with the NAAQS, with the annual average PM10 concentration in 2021 being 39.23 μg/m3 . Even with these rates of decline, it may take decades before all the stations in VTAPA become NAAQS compliant.
The second-generation AQMP builds on the experiences gained from the failures of the first (South Africa DFFE 2021). The second plan identified industrial emissions, vehicular emissions, dust blown by wind, waste burning, and emissions from domestic burning as the five problem complexes. Its creation involved the usage of an updated emissions inventory of the region, data from ambient monitoring stations and industrial stations, dispersion modelling with Comprehensive Air Quality Model with Extensions (CAMx), data from a health study, a source apportionment study, and Greenhouse Gas and Air Pollution Interactions and Synergies (GAINS) modelling. The plan included training sessions for the air quality officers in 2018 to boost government capacity. The plan lists new goals to achieve NAAQS for the stakeholders under the different problem complexes. It also includes preliminary estimates of the costs associated with the interventions. It lists the risks that can derail its implementation. It identifies a plan for monitoring and evaluation, a mechanism for stakeholder engagement, and the process of AQMP review. The new target year for attaining the NAAQS is 2030. The transparency in South Africa’s reporting of air quality and the reasons for the AQMP implementation failure is commendable.
Managing air quality at the level of an airshed is challenging due to the involvement of multiple administrative entities and larger spatial scales vis-à-vis a city-based approach. Nonetheless, the regions we have covered in this review have adopted the airshed approach and have had considerable experience dealing with air pollution at a regional scale. India can learn quite a lot from their experiences. We recommend the following for a successful airshed implementation plan in India.
A multi-jurisdictional coordination mechanism is essential to ensure horizontal and vertical coordination between the administrative entities within the airshed. This form of an institutionalised mechanism in the BTH region and the MCMA ensured that all the stakeholders coordinated their actions when tackling air pollution at the ground level. The lack of coordination between administrative entities was one of the reasons for the failure of VTAPA’s airshed management plan. In India, one such coordination mechanism, CAQM, already exists to manage air quality in the NCR airshed with multi-jurisdictional representation from five states/union terriories and key central ministries like Power and Petroleum and Natural Gas.
Airshed management authorities should identify the pollutant sources within the airshed and design realistic, time-bound interventions to tackle them. Developing a practical and time-bound intervention strategy is critical to ensure that the efforts reduce air pollution in a stipulated timeframe. In 2013, the APPCAP set targets to reduce 33 per cent and 25 per cent of PM2.5 in Beijing and the BTH region by 2017. Backed by interventions focusing on critical sectors like industrial and residential coal use, identified through a source apportionment study in 2012–13, the city and the region exceeded the targets in 2017.
Identifying the funding mechanism(s) and delineating financial responsibilities among the administrative sub-units before implementing the interventions is essential. It is critical to ensure the funds available are commensurate with the financial requirements for implementing the planned interventions to reduce air pollution. Apart from government allocation, the authorities can explore private investment as a viable option to finance emission reduction in sectors like industry and transport. As evidenced by the taxi fleet renewal policy in Mexico City under PROAIRE 2002–2010, private investment can help bridge the gap between project cost and public spending. Regarding funding allocation, there should be a democratic process involving the local governments to disburse financial resources. The case of the Metropolitan Fund in the MCMA highlights that even though suitable fund disbursal mechanisms exist, municipal-level governments do not have a proportionate say in distributing financial resources.
The designing of interventions should consider future economic and population growth scenarios and the scale of urbanisation. For example, the authorities in South Africa designed interventions to reduce PM10, as the observational data showed that it was the most critical pollutant. But, a decade later, several sites within the Vaal Triangle airshed recorded PM2.5 concentrations well above the national standards. Apart from that, the jurisdiction of the airshed coordination mechanism should reflect the scale of urbanisation around the constituent urban centres and expand accordingly when the need arises. The case of the MCMA demonstrates how, in 2013, CAMe, covering 225 cities, replaced CAM, which covered 19 cities.
Fixing bureaucratic responsibility helps effectively implement air pollution reduction strategies on the ground. In China, the air pollution reduction targets are part of the annual performance reviews of bureaucrats and hence are vital in deciding their future career prospects. Even though airshed management is gaining currency in India with the institution of CAQM in 2021 and states like Uttar Pradesh and Maharashtra endeavouring to consolidate the approach through the creation of airshed management plans, the effective transition from city-scale to regional-scale air quality management will require an efficient and systematic approach. Robust science, wellcoordinated administrative arrangements, availability of funds with a well-defined disbursal mechanism, and setting accountability at different levels will be vital to implementing the airshed approach successfully in India.
An airshed is a geographical area affected by the same airmass. It is the region of the atmosphere which behaves coherently concerning the dispersion of pollutants.
An airshed approach is important for cities like Delhi because air pollution defies administrative boundaries and a large share of pollution originates from outside the city. For instance, around 42 per cent of the black carbon load in winter and 36 per cent in autumn over Delhi is from the neighbouring NCR states. Similarly, about 60 per cent of Delhi’s winter pollution load comes from outside the city.
India should focus on the reduction of emissions, targeting sources which are identified through regularly updated emission inventories. There should be a multi-jurisdictional body to coordinate between different stakeholders and have realistic and time-bound air pollution management strategies following the examples of Mexico and China. Airshed management also requires the identification of a funding mechanism involving multiple stakeholders and fixing accountability of bureaucracy through periodic reviews.
Organic Waste Circular Economy for Viksit Bharat
Roadmap of the methodology to assess the climate co-benefits of the SUP ban in Tamil Nadu
Roadmap of the methodology to assess the climate co-benefits of the SUP ban in Maharashtra
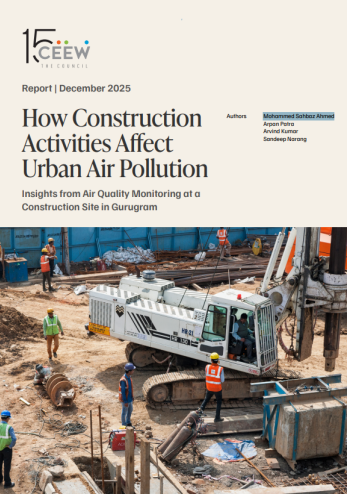
How Construction Activities Affect Urban Air Pollution:
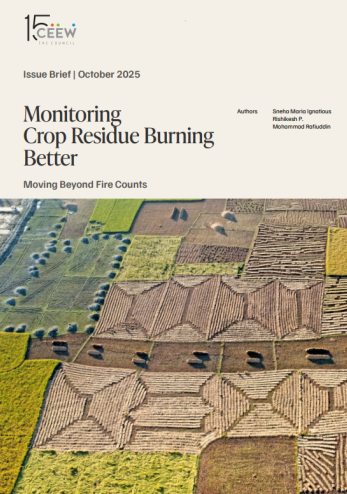
Monitoring Crop Residue Burning Better: