Council on Energy, Environment and Water Integrated | International | Independent
Suggested citation: Ahmed Mohammed Sahbaz, Arpan Patra, Arvind Kumar and Sandeep Narang. 2025. How Construction Activities Affect Urban Air Pollution: Insights from Air Quality Monitoring at a Construction Site in Gurugram. New Delhi: Council on Energy, Environment and Water.
Construction activities are a major source of urban air pollution, contributing nearly 30 per cent of Delhi’s dust load, and their impact is expected to grow with rapid urban expansion. While cities often impose blanket construction bans during high-pollution episodes, such measures lack ground-level evidence and disproportionately impacts workers and builders. To generate activity-specific insights, CEEW, in partnership with Signature Global (India) Limited, conducted a pilot study at a large construction site in Gurugram. An air quality monitoring network—comprising nine low-cost sensors and an automated weather station—was deployed in a concentric layout to capture 30-minute PM₂.₅ and meteorological data over 18 months. A trained technician simultaneously logged on-site activities within a 50-metre radius of each monitor, including the timing of dust mitigation efforts such as water sprinkling and anti-smog gun deployment, enabling a detailed assessment of real-time emissions and mitigation effectiveness.
Key recommendations:
Construction activities contribute significantly to urban air pollution (Luo et al. 2021). According to the Delhi Pollution Control Committee, construction-related dust alone accounts for up to 30 per cent of the dust pollution in the city (DPCC 2023). With urban expansion, the number of construction and demolition sites in and around Delhi continues to grow (Realty Assistant 2025). Therefore, their impact on air quality is likely to rise sharply. What’s urgently needed is a robust monitoring framework, stricter compliance protocols, and stronger actions for self-regulation at construction sites.
As things stand, cities have started restricting construction activities during high-pollution periods. Measures like blanket construction bans under the Graded Response Action Plan (GRAP) are meant to alleviate the air pollution situation in Delhi-NCR. However, these restrictions, often guided by a lack of on-site ground-level data, disproportionately affects daily-wage workers, contractors, and builders (Shukla 2024). Policymakers should instead consider identifying and assessing activities based on their actual pollution impact, and plan the mitigation measures accordingly. Such an approach will not only ease the economic burden but also allow project planners to devise air pollution-appropriate scheduling.
Recognising the need for evidence-based solutions, the Council on Energy, Environment and Water (CEEW), in partnership with the real estate company Signature Global (India) Limited, carried out a pilot at an active construction site. CEEW deployed an air quality monitoring network in a concentric circle pattern with two key objectives: first, to assess the air quality impact of ongoing construction activities, and second, to measure the effectiveness of different dust mitigation strategies in real-time. We use the findings to offer few recommendations on optimising pollutioncontrol measures to balance environmental concerns with economic ones.
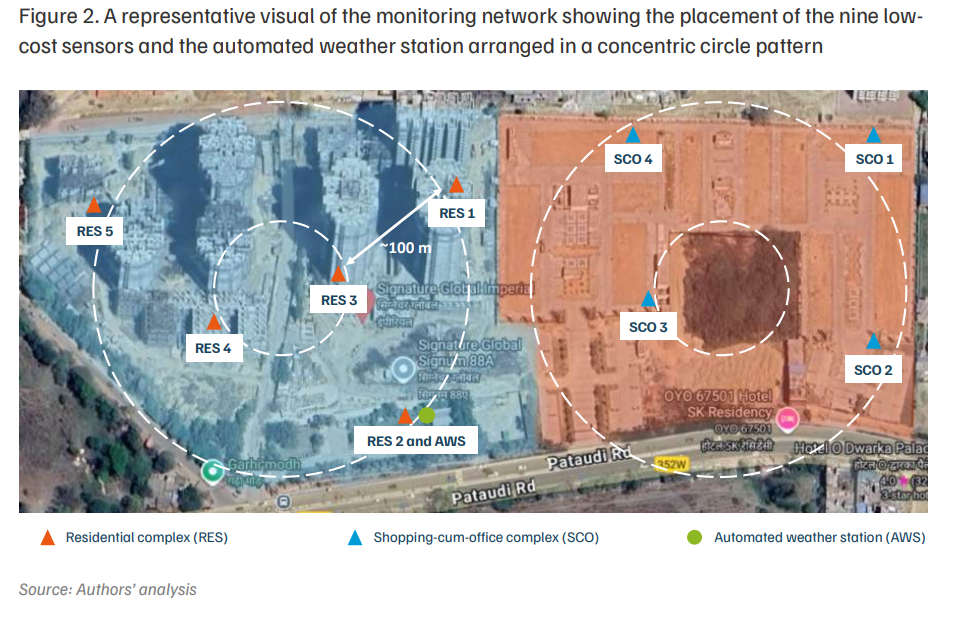
Nine air quality monitors and an automated weather station (AWS) were deployed at a large construction site (>20,000 square metres) in Gurugram, Haryana. Four of the air quality monitors were deployed in a shopping-cum-office (SCO) complex, and the other five in the residential (RES) area. These air quality monitors use low-cost air quality sensors (LCS), in line with the direction of the Commission on Air Quality Management (CAQM) in Delhi-NCR and adjoining areas. Over a period of 18 months starting July 2023, thirty-minute interval data of PM2.5 concentration and met parameters (including relative humidity, temperature, wind speed, wind direction) were recorded.
Additionally, one air quality monitor of a similar grade was deployed at an ambient background site to record the simultaneous changes in the pollutant concentrations at the local level. The background location is at an aerial distance of ~1.5-2 km from the active construction site. The background site was situated far away from major roads or any other air pollution sources; therefore, the impact of other air pollution sources was minimised or eliminated.
To assess activity-specific levels of particulate matter (PM), simultaneous ongoing activity information was collected manually at the site. A trained technician was deployed at the site to record all the activities happening within a 50 m radius from each air quality monitor thrice a day. The start and end of dust mitigation measures, such as water sprinkling or anti-smog guns, were recorded as well to further assess the impacts of those measures on reducing air pollutants at the site.
Delhi’s development cannot come at the cost of clean air and public health. Our study shows that pollution from construction is not uniform, and varies widely across activities and phases. A data-driven, activity-specific regulatory approach can balance environmental goals with economic continuity. By empowering builders to schedule smartly and mandating real-time monitoring, the authorities can move beyond reactive bans to proactive management. The path forward lies in coupling science with policy by using granular evidence to shape regulations.
Air pollution and construction activities: a growing concern
Construction activities significantly contribute to urban air pollution and impact public health (Wieser et al. 2021; Luo et al. 2021). Among major Indian cities, this sector accounts for approximately 8 per cent of annual PM2.5 and 21 per cent of PM10 concentrations in Delhi (TERI 2018) and around 9 per cent of total PM emissions in Mumbai (MPCB 2023). With the accelerating pace of urbanisation, this contribution is projected to increase substantially.
For instance, Delhi-NCR is witnessing a boom in construction activities due to rapid infrastructural development and rising demand for residential and commercial spaces (Cushman and Wakefield 2025; Bhavishya Nirman Developers 2024). Key hotspots include Gurugram, Noida, Greater Noida, and Faridabad; particularly areas along the Dwarka Expressway, Noida Extension, and the Yamuna Expressway corridor.
Several large-scale infrastructure projects are being executed, including two major highway projects in Delhi-NCR, estimated to cost a combined USD 1.2 billion (InfraJunction 2025). While these projects are expected to transform the urban landscape, improve connectivity, and enhance economic growth, they pose a grave pollution risk for the region.
Although policies aimed at mitigating constructionrelated air pollution exist, such as the Construction and Demolition Waste Management Rules (2016) and episodic bans under the Graded Response Action Plan (GRAP), their effectiveness remains uncertain. Table 1 reviews all the efforts by different states and city-level policymakers to restrict the impacts of construction activities in the urban areas.
Rapid urban expansion is driving construction-related pollution to intensifying levels, demanding stricter, more effective mitigation strategies.
Table 1. City-level actions and mandates on clean construction often lack self-compliance and self-regulation
| Region | Details |
|---|---|
| Delhi's recent plans (Shakshi 2025; DoE 2025; PTI 2024; Ahmed et al. 2024) |
|
| Gurugram and other NCR cities (UNDP 2024; CAQM 2025) |
|
| State/Cities | Details |
|---|---|
| Maharashtra/Mumbai (MMRDA 2025; MPCB 2023) |
|
| Gujarat/Ahmedabad, Surat, Vadodara, Rajkot (CAG 2022; Shakshi 2025) |
|
| Karnataka/Bengaluru (Kulkarni 2025; NGT 2022; CPCB 2020) |
|
| Howrah (WBPCB 2020) |
|
| State/Cities | Details |
|---|---|
| Pune (CPCB 2025) |
|
| Other cities/states (PIB 2025; Ganguly et al. 2020; Chowdhury and Kumari 2024) |
|
Source: Authors’ analysis
However, most of these action plans are reactive in nature, and the temporary bans imposed during highpollution episodes are often insufficiently targeted and face implementation challenges due to economic disruptions. The current mandate to suspend all construction activities during such periods, therefore, requires a more nuanced and evidence-based approach.
Necessity of activity-specific information for dust mitigation planning
As a measure under GRAP in Delhi-NCR, the Commission for Air Quality Management (CAQM) mandates banning all construction activities to reduce air pollution(Khan et al. 2022). These interventions primarily aim to reduce particulate matter. However, such measures are typically enforced without sufficient ground-level data to identify which specific construction activities are the most polluting. As a result, blanket bans are often imposed across the sector, regardless of the emission intensity of different activities, or the phase a construction project is in (Sharma 2024).
For example, in 2023 and 2024 alone, construction activities in Delhi-NCR were halted for a cumulative total of 78 days under GRAP (CAQM 2025), causing significant economic repercussions in terms of delaying project timelines, increasing project costs, disrupting infrastructure development, and causing reputational and financial damage to project proponents (REIAS 2024). Daily-wage construction workers are particularly vulnerable to the impact of such bans, as sudden work stoppages result in loss of income, food insecurity, and forced migration due to financial distress (Shukla 2024).
This gap necessitates generating evidence to categorise the different activities within construction as more and less polluting (Patra and Ahmed 2025). In the absence of such a differentiation, policymakers and project proponents are unable to implement targeted dust mitigation strategies. This lack of nuance results in overly broad restrictions may inadvertently stall non-critical, low-impact activities, potentially leading to unintended economic and social consequences.
Research gap and objectives of the study
In this study, we have tried to address the following research questions
In response to these gaps, the study is guided by two core objectives:
Study design
To generate data on activity-specific dust emissions, and evaluate the effectiveness of mitigation measures, an air quality monitoring network was deployed at a large construction site (> 20,000 sq m) in Gurugram, India. The network comprised nine low-cost air quality sensors installed across the site along with an automated weather station (AWS) to capture relevant meteorological parameters. This enabled high-resolution, real-time monitoring of PM2.5 and PM10.
Pollutant concentration data were continuously recorded for a duration of approximately 18 months. Each monitored activity was documented and temporally aligned with corresponding pollutant readings to facilitate activity-wise profiling. To assess the effectiveness of dust mitigation strategies, pollutant levels were measured across three distinct timeframes: before, during, and after the intervention.
Site description
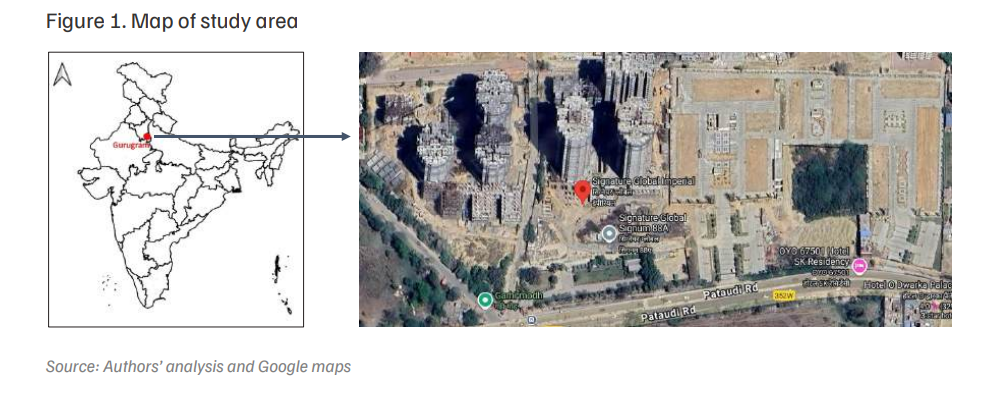
The pilot was undertaken at an active construction site at Gurugram ( 28°25′ N and 76°57′ E, Figure 1). The city is located in the south-eastern part of Haryana and forms part of the National Capital Region (NCR) of India. Its climate is tropical and semi-arid. The annual temperature ranges from 5°C to 40°C with mostly westerly winds.
The pilot study was conducted by the Council on Energy, Environment and Water (CEEW). The pilot is part of an MoU between real estate company Signature Global Limited and CEEW to collaborate on finding solutions to reduce air pollution from construction activities. Signature Global (India) Ltd. is one of India’s leading real estate companies, and provided one of their ongoing construction sites (Signature Global Imperial) to carry out the study. The construction plot covers an area of ~35,000 sq m, and is organised into two sections: (a) residential area (RES), where eight residential building towers are being constructed, and (b) shopping-cumoffice area (SCO), where commercial complexes are being developed.
Monitoring approach
To deploy the air quality monitoring network at the pilot site, a series of preliminary assessments were carried out. These include a detailed review of the site layout, review of the scheduling of construction activities, and the surrounding land use and land cover. Subsequently, the monitors were deployed based on the concentric circle approach to estimate the potential air quality impacts of different construction activities. Based on these insights, we developed and deployed a first-of-itskind monitoring network comprising nine low-cost air quality monitors strategically placed across the pilot site in Gurugram (Patra et al. 2025). The monitor placement was done according to the project plan, prevailing wind directions, and to ensure representative data collection. The configuration of the monitoring network is illustrated in Figure 2.
Data collection and analysis
The pilot study’s sampling involved cumulating continuous real-time pollutant and meteorological data, and manual monitoring of activities at the construction site. Of the data collected, we focused our analysis on a period of one year, from July 2023 to June 2024, covering all seasons. The details of data collection and analysis are discussed further in the following sections. For statistical analysis, Microsoft Excel and R statistical computing and graphical software were used. The data visualisation was carried out using Flourish Studio.
Pollutant data
Particulate matter (PM2.5 and PM10) concentrations were measured using low-cost air quality sensors (LCS). The specifications of the sensors are provided in Annexure I. The sensors were installed at an average height of ~2.5- 3.5 metres above surface level. Nine LCSs were installed at the study site: five in the RES area, and four in the SCO area. Concurrent PM measurements were also recorded at another location, which is around ~4 km away from the construction site and is primarily a green surrounding devoid of any severe pollution-causing activities. This location was considered a background site to obtain baseline PM data for comparison. Continuous real-time PM2.5 and PM10 concentration data were collected at 30-minute time intervals, and processed. The PM data was analysed primarily for the working hours of the construction site, i.e., from 7 a.m. to 7 p.m. The PM2.5 data was taken into consideration for evaluation due to its higher reliability compared to PM10 measured by the sensors. Additionally, prescribed quality control and quality assurance steps were followed for PM measurements before deploying the sensors at the site.
Meteorological data
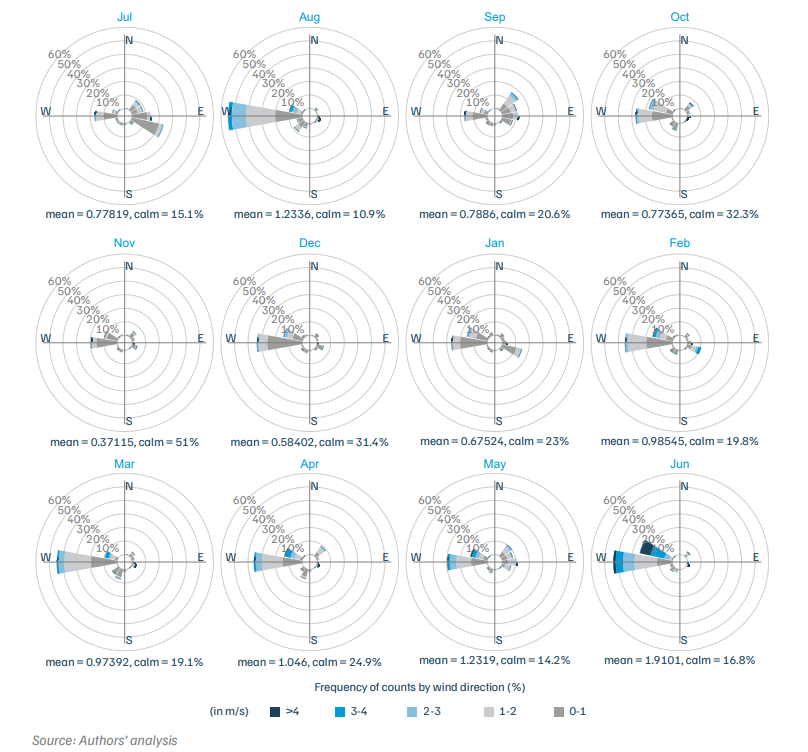
When monitoring air quality levels at a construction site, meteorological (Yan et al. 2019) parameters play a significant role in determining the concentration of particulate matter. Accurately assessing these factors is crucial for evaluating how they affect the distribution of construction dust. To map the meteorological conditions during the study, several parameters—namely temperature, relative humidity, wind direction, and wind speed—were measured by the automatic weather station (AWS) deployed at the site. Annexure II shows the monthly wind roses of the prevailing wind speeds and directions at the study site.
A first-of-its-kind sensor network enabled real-time, activity-specific tracking of dust emissions at an active construction site in India.
Data on ongoing activity
Any type of construction activity occurring within a ~50 m radius of each sensor was documented manually. Activity-wise information was recorded thrice a day for all nine sensors deployed at the site. Mostly, a single activity (e.g., excavation) was found to occur throughout the day, and the daily average pollutant concentration during working hours was attributed to that activity. However, on a few occasions, multiple activities were observed to be taking place in the vicinity of a sensor during the day where two visits observed a same activity (e.g., excavation), while the third showed a different activity (e.g., foundation). In such cases, we recorded the common activity observed during the two visits and attributed that to the daily average pollutant concentration. Similarly, the mitigation measures within the site, such as water sprinkling and the use of antismog guns, were also recorded with proper start and end timings.
Quality assurance and quality control
PM data, meteorological parameters, and activity updates were carried out with utmost precaution, and by maintaining standard operating protocols like installation, maintenance schedules, data collection intervals, power supply, and backup. The LCS was selected by carrying out a series of performance tests to evaluate six different models. The LCSs were explored and compared in terms of the technology, performance, data quality, data accuracy, uptime, usability, and maintenance costs. The selected LCS was further collocated and calibrated with a reference grade monitor for data reliability (Annexure III). To assess the representability of the data, the LCS data were also compared with four of the nearest Continuous Ambient Air Quality Monitoring (CAAQM) stations. The comparisons are shown in Annexure IV; it was found that PM2.5 concentrations followed a similar diurnal trend; however, the concentration levels varied depending on the land use and land cover of the CAAQMS. Each of the deployed LCSs was supported by routine checks, cleaning, calibration, and periodic servicing once/twice a week based on the dust load. Data screening was regularly carried out through a backend dashboard to identify sensor malfunctions, data spikes, or extreme values.
A typical construction project involves multiple phases that are strategically scheduled with different construction activities (Luo et al. 2021). Different activities are carried out at different phases of construction, like excavation, road clearing, framework, and material transportation, to finishing-stage activities like plumbing or painting. Each type of activity is responsible for generating different levels of dust emissions into the surroundings with varying intensity (Wieser et al., 2021). Air pollution characteristics of the construction sector can vary based on several factors, including the type of construction activity, the project’s scale, the schedules and duration of the activities, and the prevailing environmental conditions (Owolabi et al. 2024). A work breakdown structure (WBS) is generally used by most construction companies to develop a working schedule and estimate the costs and duration of each related activity (Cerezo-Narváez et al. 2020). A basic breakdown of the different phases involved in a construction schedule is discussed below-
Real-time monitoring shows only a few construction activities cause major dust emissions, enabling targeted and effective regulation.
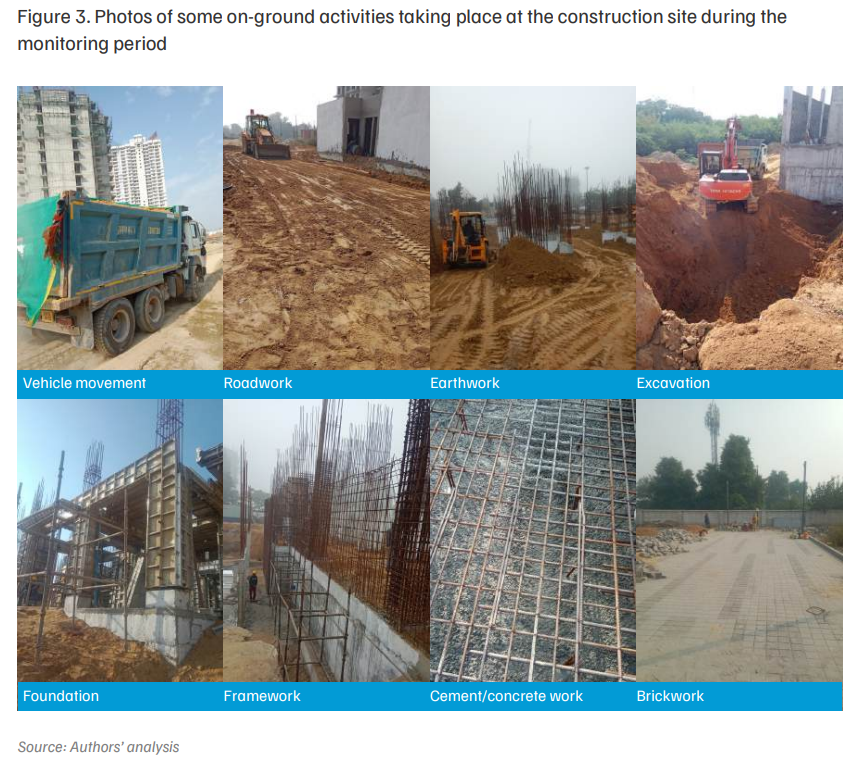
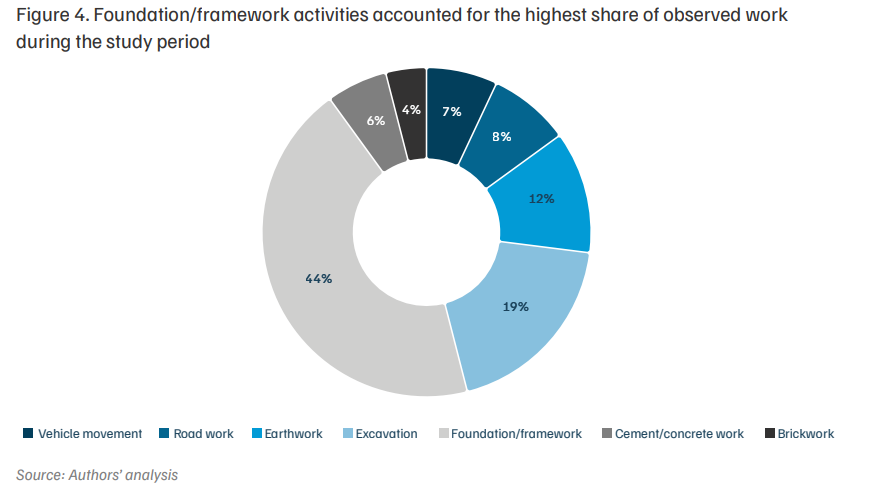
Our pilot study was mainly carried out during the 1st and 2nd phases of the project, which were operative during the one-year time period. The activities noted to be occurring were excavation, earthwork (land filling, land levelling, relocation of loose soil), roadwork (construction of onsite roads, walkways, driveways, parking areas, garden areas by clearing, levelling, filling, and paving of unpaved surfaces), foundation/framework (shuttering, column, beam, slab construction, iron and aluminium framing, binding of tower structures, construction of gates, staircases, elevator shafts), brickwork (construction of internal and boundary walls, block pavements), cement/concrete work (masonry work, pouring of concrete, plastering, flooring), and vehicle movements (transport of construction materials through trucks and light motor vehicles, movement of water tankers, tractors, and heavy-duty vehicles (HDV) such as earthmovers, ready-mix cement trucks). A few on-ground photos of the mentioned activities are shown in Figure 3. These activities were carried out throughout the study duration at different paces and at different locations with respect to the deployed LCS. The Figure 4 presents the percentage distribution of data corresponding to different construction activities recorded throughout the entire study period. It shows that nearly half of the total observations correspond to foundation and framework work (44 per cent), followed by excavation (19 per cent) and earthwork (12 per cent).
Identifying pollutant-intensive and non-pollutant-intensive activities
During periods of severe air pollution, restrictions are put in place limiting or halting construction activities due to their dust emission impacts (Gerrard 2024). These restrictions apply to all activities regardless of their contribution to pollution. As part of the pilot study, we monitored the real-time PM levels during each of the construction activities through the AQ monitoring network deployed at the site. We evaluated the PM2.5 concentration levels associated with a defined set of activities for one year, and found that excavation, road work, earthwork, and vehicle movement generate a higher amount of dust emissions in their vicinity in comparison to foundation/framework, cement/concrete work, and brickwork. Further, during the monitoring period, we observed holidays, Sundays (week off), or days when there were statutory restrictions on carrying out construction activities. We also found days when there was no ongoing activity near some or all of the deployed LCSs. Such occasions, where no activity was observed to occur for any particular LCS, were considered as no-work days for the study. The average concentrations on no- work days during the monitoring period were considered as the site’s background levels, as they reflect conditions within the site without the occurrence of any on-site activity inputs. Also, the sensor placed at a distance from the site did not capture site-specific conditions. Therefore, using the no-work day data as the background was considered more appropriate for comparison.
Table 2. Different types of construction activities generate varying levels of PM2.5 concentration
| Activity | Total number of recorded activities | PM2.5 concentration range (µg/m³) | Average ± SE (µg/m³) | Median (µg/m³) | 25th percentile (µg/m³) | 75th percentile (µg/m³) |
|---|---|---|---|---|---|---|
| No-work | 609 | 10-362 | 63±2 | 40 | 25 | 97 |
| Brickwork | 66 | 16-264 | 46±6 | 31 | 23 | 49 |
| Cement/concrete work | 113 | 16-246 | 63±6 | 39 | 25 | 78 |
| Foundation/framework | 754 | 9-492 | 71±3 | 38 | 26 | 97 |
| Excavation | 338 | 25-474 | 85±4 | 50 | 35 | 106 |
| Earthwork | 209 | 25-357 | 91±6 | 47 | 43 | 125 |
| Road work | 136 | 13-454 | 112±8 | 72 | 42 | 182 |
| Vehicle movement | 125 | 61-395 | 140±8 | 98 | 79 | 179 |
Source: Authors’ analysis
Note: SE - standard error
Table 2 shows the average PM2.5 concentration levels associated with each activity, along with their median, ranges, quartiles, and the diurnal counts of recorded activities as per each sensor. Considering the median PM2.5 concentration of each activity, we found that activities like brickwork, cement/concrete work, and foundation/framework generated less than ~40 μg/ m3 each, similar to the no-work median concentration. However, activities such as earthwork, excavation, and road work were found to have higher median concentrations of 47 μg/m3 , 50 μg/m3 , and 72 μg/ m3 , respectively. Additionally, the median for PM2.5 concentration during vehicle movements was 98 μg/m3 , which is around 2.5 times higher than no-work-day levels. Thus, it is observed that each type of activity generates different levels of dust pollution in its vicinity, and can be categorised into pollutant-intensive and non-pollutantintensive activities. It was also observed that ~600 instances of ‘no work’ were captured during the whole study duration. Depending on the variable meteorological conditions and seasonal variability, the overall PM2.5 concentration during no work ranged from 10-362 μg/m3 with an average of 63.4±2.12 μg/m3 .
We conducted non-parametric tests, like the Wilcoxon signed-rank and the Sign test, to statistically assess the variations in PM2.5 concentration levels recorded during various construction activities in comparison to no-work conditions. The test statistics are provided in Annexure V. It was observed that activities such as vehicle movement, road work, earthwork, and excavation showed statistically significant differences (p < 0.05) under both tests, indicating higher PM levels compared to no-work conditions. In contrast, foundation/framework and cement/concrete work showed no significant differences (p > 0.05), suggesting relatively lower incremental dust generation. Interestingly, for brickwork, both tests indicated a significant difference (p < 0.05); however, in this case, the dust levels were lower than those during the no-work condition.
Note: The slightly lower PM₂.₅ levels observed during brickwork is due to fewer data points and the inherently less dustintensive nature of the activity
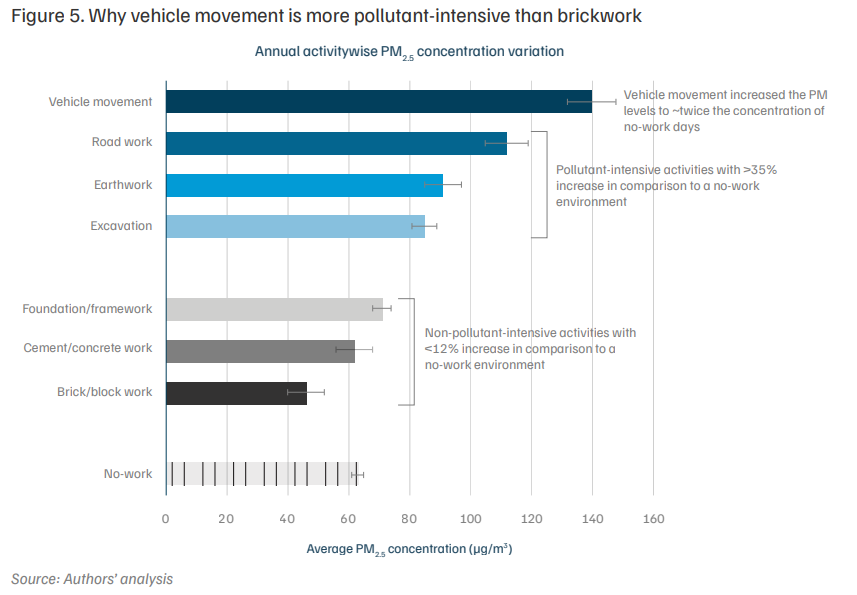
Subsequently, we compared the average PM2.5 concentration levels of the defined construction activities to those observed during no-work conditions. Figure 5 shows that the pollutant-intensive activities exhibit a significant increase in PM2.5 concentration levels, with excavation causing a ~35 per cent spurt, earthwork ~44 per cent, roadwork ~78 per cent, and vehicular movement a significant increase of ~122 per cent. The non-pollutant-intensive activities, meanwhile, showed low intensity in terms of PM2.5 concentration, exhibiting less than ~12 per cent increase from no-work concentrations. Moreover, the PM2.5 concentrations of the pollutant-intensive activities (excavation, earthwork, and road work) were found to be ~60 per cent higher than those of the non-pollutant-intensive activities. Further, the resuspension of dust by vehicular movements increased the concentration levels by ~135 per cent in comparison to the combined average concentration of the nonpollutant-intensive activities (i.e., 60 μg/m3 ). The PM2.5 levels recorded during brickwork activities were found to be slightly lower than those observed during the no-work period. This variation is likely due to the smaller number of data points available for brickwork compared to nowork conditions, which may have affected the overall average. Moreover, brickwork generally involves limited dust-generating activity and usually takes place after the more pollutant-intensive phases, such as excavation or earthwork. As a result, the surrounding dust levels during brickwork tend to remain relatively low.
Seasonal variations among the PM2.5 contribution of different activities
The NCR experiences vast variations in weather conditions, from extreme winter between December and February, to extreme summer from May–August. The meteorological conditions prevailing in these seasons also vary drastically, with differences in not just temperature, but also humidity, wind speed, and wind direction. The monsoon, from late June to September, brings heavy rains that help settle dust particles and wash away pollutants, often resulting in temporarily improved air quality during this period. Occasional dust storms are also a common phenomenon during the pre-monsoon season, spanning from April to June, in the NCR. These dust storms are marked by strong, dusty winds, which significantly reduce air quality and visibility (Gandhiok 2025). Also, several other factors escalate during this period, including transboundary dispersion of air pollutants from crop residue burning, bursting of crackers during festivities, smog formation, and temperature inversions. Thus, a combined effect of these factors produces severe air pollution episodes in the region during the post-monsoon and winter months, extending from October to February.
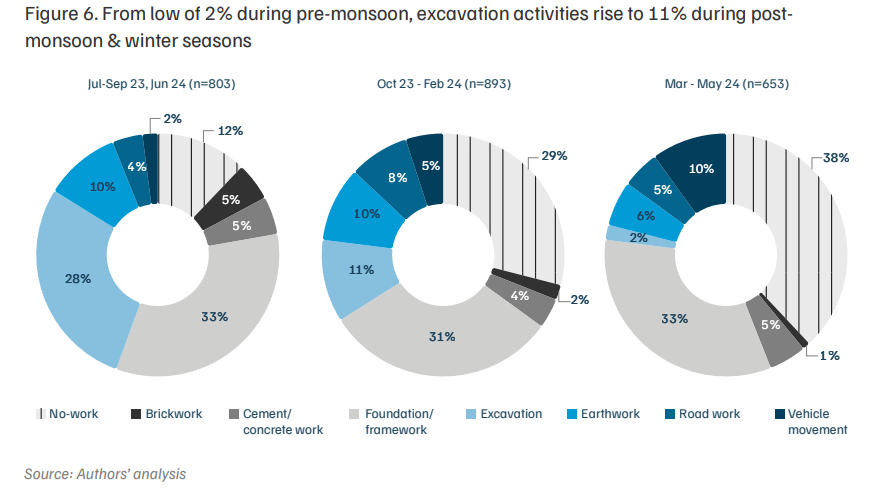
Due to these factors, the construction activities also vary seasonally and are scheduled accordingly, aligned with the phases of construction. The seasonal variation in the total count of occurrences per activity is shown in Figure 6. It is evident from the figure that not all the activities have the same span of occurrences during all the seasons; we found that 803 instances of activities were recorded during the monsoon (June to September), 897 during the post-monsoon and winter season (October to February), and 653 during the premonsoon period (March to May). The foundation or framing work was found to be happening at the same rate throughout all the seasons, accounting for 31 to 33 per cent of the total occurrences. However, during the monsoon season, excavation activities accounted for 28 per cent of all activity occurrences; this percentage eventually decreased to 11 per cent during the postmonsoon and winter seasons, and just 2 per cent during the pre-monsoon season. Instances of no work also varied between the seasons, with 12 per cent during the monsoon season and 38 per cent during the premonsoon season.
We observed that during the pre-monsoon season, pollutant-intensive activities have a lower occurrence in comparison to the other seasons; rather, the opposite case should have been more appropriate. The pre-monsoon period witnesses more favourable meteorological conditions, and thus scheduling pollutantintensive activities during this season is more logical. Restrictions on construction activities or complete bans are often witnessed during the winter months due to severe pollution episodes. Scheduling pollutant-intensive activities during those months may lead to more dust emissions and, consequently, delays when the higher pollution levels trigger blanket bans. That’s why the planning and execution of construction activities need to be well-designed and scheduled in such a way that the pollutant-intensive activities are carried out in periods with favourable conditions, accompanied by proper dust mitigation measures.
An earlier CEEW study suggested that better all-year planning can prove a proactive approach to minimise losses from regulatory bans (Ahmed et al. 2024). The study recommended incorporating dust mitigation plans into the construction schedules as sub-tasks from the get-go, and regulating them throughout the year. Dust mitigation plans include various measures like using antismog guns, green covering, high barriers surrounding the work site, and sprinkling water on a regular basis (Omega Environmental 2023).
We further evaluated the changes in PM2.5 concentration levels of the defined activities during different seasons. Figures 7a and 7b illustrate the variations in the PM contribution of each activity during different seasons, and also compare those to the no-work concentration levels. Annexure VI presents the total count of days for each type of activity recorded during different months, along with the corresponding meteorological parameters prevailing during those periods. It also shows the monthly average temperature and relative humidity, providing insight into the influence of meteorological conditions on PM2.5 concentrations across various construction activities during different months.
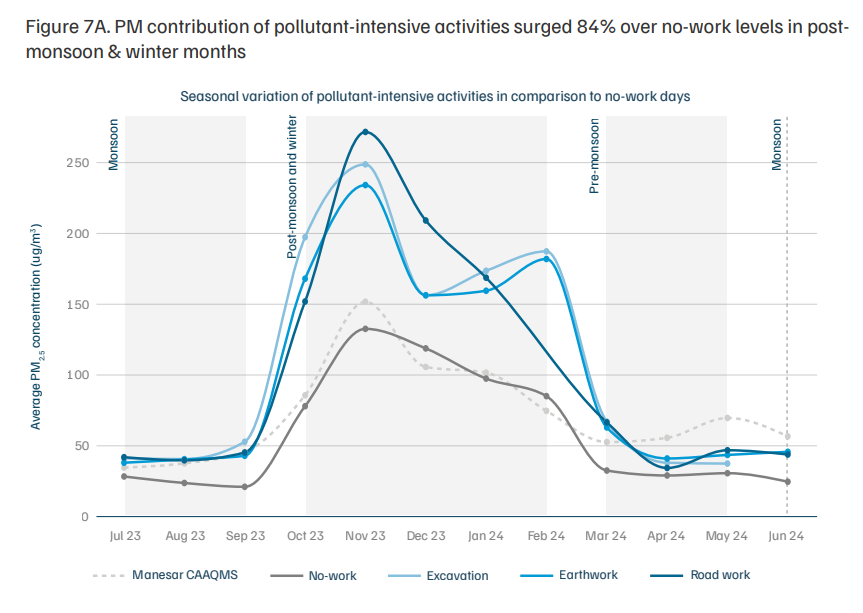
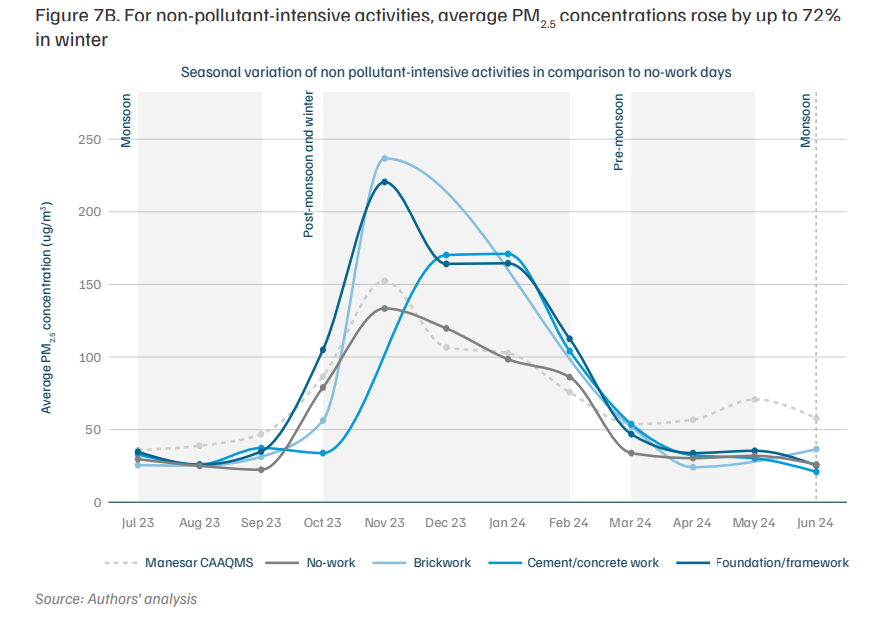
The figures above show that the PM2.5 concentrations were significantly higher during the post-monsoon and winter seasons than the pre-monsoon and monsoon seasons. The PM concentration levels of pollutantintensive activities registered a nearly fourfold increase during the post-monsoon and winter seasons in comparison to the monsoon season. Additionally, when the concentration levels of pollutant-intensive activities were compared to the no-work concentration levels, a ~65 per cent increase was registered during the premonsoon and monsoon seasons, and ~84 per cent during the post-monsoon and winter seasons.
In case of the non-pollutant-intensive activities, no increase in pollutant levels was observed during the monsoon and pre-monsoon seasons. However, during the post-monsoon and winter seasons, mainly during the months of November, December, and January, the average PM2.5 concentrations were found to increase by ~72 per cent, ~42 per cent, and ~71 per cent, respectively, in comparison to no work.
Between November and January, air pollution levels remain consistently high, with most days falling into the “poor” to “severe” air quality categories. During this period, the ambient levels of PM are already elevated to such an extent that it becomes challenging to differentiate and assess the additional contribution of outdoor construction activities. The background pollution essentially interferes with the PM emissions generated by these activities, making it difficult to draw clear distinctions. Despite these limitations, we made an effort to differentiate between pollutant-intensive and non-pollutant-intensive construction activities. Even in the midst of high ambient pollution, the data showed that pollutant-intensive activities still tended to contribute higher PM concentrations compared to non-pollutantintensive activities or no work. Annexure VII represents box plots comparing PM2.5 levels across different activity types and the no-work baseline. However, due to the already elevated ambient pollution levels during the winter season, the variation in PM concentrations across activity types is less comparable, making it difficult to observe a significant difference visually in the plots.
Box 1. Graded Response Action Plan (GRAP) mandates
Interestingly, during the post-monsoon and winter periods, the average monthly PM2.5 concentrations were significantly higher for all activities. However, during this period, the GRAP restrictions were also implemented from 6 October 2023 to 27 February 2024.
So, were construction activities still being carried out during the officially mandated restriction periods?
The answer is NO.
The mandates under GRAP are generally implemented in four stages in response to the prevailing category (poor, very poor, severe, severe plus) of the Air Quality Index (AQI). The government may implement or withdraw the guidelines on any day and for any period, depending on the AQI levels. However, construction activities are restricted mainly during the III and IV stages of GRAP. At the time of our study period, the dates of implementation and the revocation of the actions under GRAP stage III and IV are mentioned in the table below -
| GRAP stage | Implementation date | Revocation date | Total number of days |
|---|---|---|---|
| GRAP III | 2 November 2023 | 28 November 2023 | 26 |
| GRAP IV | 5 November 2023 | 18 November 2023 | 13 |
| GRAP III | 22 December 2023 | 01 January 2024 | 10 |
| GRAP III | 14 January 2024 | 18 January 2024 | 04 |
Between October 2023 and February 2024, there were 152 days in total, out of which 40 days were under restrictions or a complete ban on construction activities in line with GRAP guidelines. Our analysis shows that construction activities were only carried out on non-GRAP days, i.e., days when restrictions were not implemented. However, even on these non-restricted days, the daily average ambient PM2.5 levels ranged between 28 and 166 µg/m³ (according to Manesar CAAQMS, nearest to the site), suggesting that while construction was compliant with the GRAP mandates, operating activities on the non-GRAP days also contributed to the overall deterioration of air quality, further elevating PM2.5 concentrations during an already polluted period.
Assessing the effectiveness of dust mitigation strategies
Several mitigation measures are mandated by the regulatory authorities (CAQM 2021) to be carried out at construction sites within Delhi and the NCR, in order to reduce the on-site PM levels raised by different construction activities. Water sprinkling, use of antismog guns, dust suppressants, wind barriers, etc., are some of the recommended dust mitigating measures that need to be deployed at construction sites for proper dust compliance. However, these measures are mostly deployed at construction sites by their proponents, mainly during the GRAP period or when any restrictive guidelines are in force during severe pollution episodes. These mitigation measures are mandated by law for dust compliance. When implemented, they essentially reduce the dust pollution levels in the vicinity to an extent (GORD 2023), although their overall effectiveness is still not well evaluated.
We were well aware that sprinkling water can effectively reduce dust levels in a dry dust-dominant area and its surroundings, but how long is it effective? What is the percent reduction in terms of PM levels? Through our pilot study, we tried to find out the answers to these questions and assess the effectiveness of a mitigation measure, i.e., water sprinkling, in reducing dust pollution levels within the construction site. Figures 8 and 9 show the difference made by deploying water sprinklers within the construction site during ongoing activities. This is again based on a comparison between PM2.5 concentration levels during typical no-work days and those recorded while excavation was being carried out. (Figure 8).
It was observed that PM2.5 concentration levels increased by ~3 times the no-work levels during the pollutantintensive activity in the absence of water sprinkling or any other dust mitigation measures. When water sprinkling (Figure 9) was deployed, we found that while PM2.5 concentration levels were initially high during the pollutant-intensive activity, they gradually started decreasing. When water sprinkling was carried out near the activity area for ~30-40 minutes, the PM2.5 levels came down by ~45-70 per cent, and the measure remained effective for nearly 3-4 hours. After 3 hours, the PM2.5 levels again started to increase gradually as the activity continued.
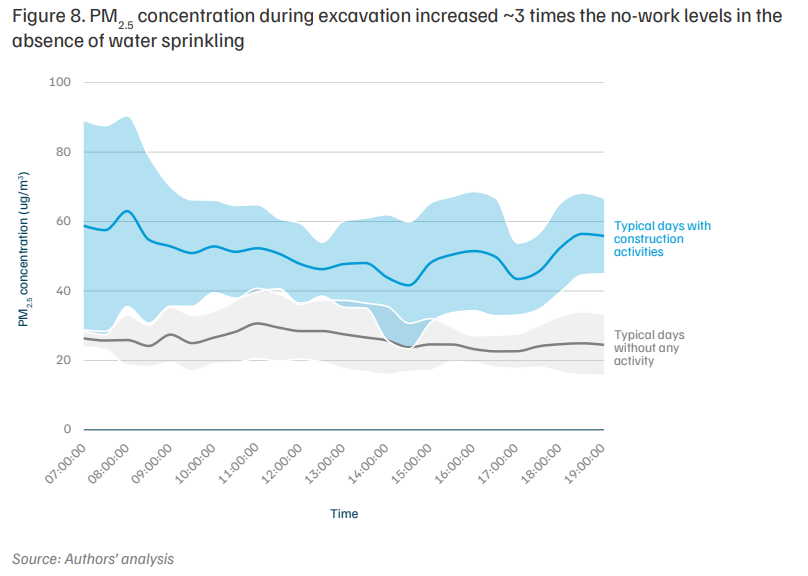
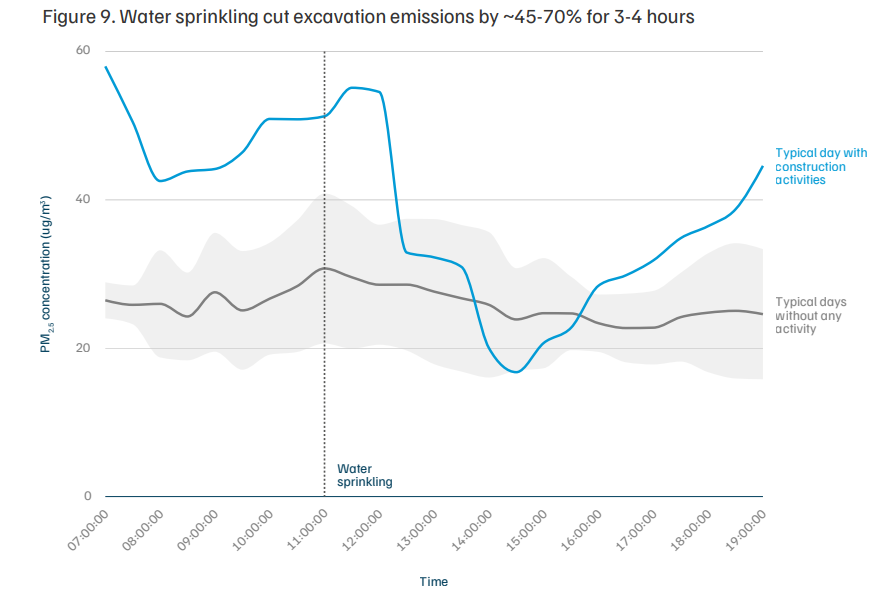
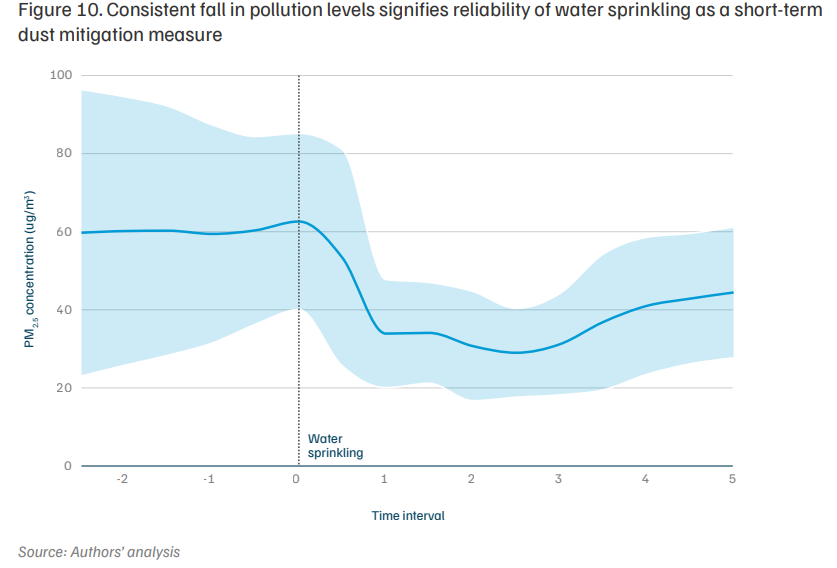
Figure 10 shows the trend of PM2.5 concentrations when water sprinkling was carried out at the construction site. Data from selected days between July and October 2023—when water sprinkling was implemented to control high dust levels—were analysed. Sprinkling was carried out at different times on different days: for analytical consistency, the start time of each event was aligned to zero on the `x-axis. It was observed during the study that PM2.5 concentrations dropped noticeably following the initiation of sprinkling, with the reduction effect lasting for nearly 3 to 4 hours regardless of when the sprinkling was carried out. Detailed information on the specific dates of observation and corresponding meteorological conditions is provided in Annexure VIII. This consistent trend signifies the reliability and temporal effectiveness of water sprinkling as a short-term dust mitigation measure at construction sites.
Our analysis proves that dust mitigation measures like water sprinkling can significantly reduce the pollutant levels at construction sites. Therefore, integrating a well-structured dust mitigation plan into overall project schedules should be mandated at construction sites, particularly during pollutant-intensive activities like excavation. As highlighted in the previous section, implementing water sprinkling at regular intervals of 3 to 4 hours, i.e., approximately three times a day, can effectively reduce the PM levels and minimise the exposure risks of the residents living nearby.
However, the degree of effectiveness of these measures is not uniform. It can be influenced by the nature of the on-site activities, such as excavation, material handling, or transportation, which generate varying levels of dust. Additionally, the prevailing meteorological conditions like wind speed, humidity, and temperature may affect the effectiveness duration. Soil characteristics also play an important role, as fine-grained soil or loose, dry surfaces tend to release more dust compared to compact or cohesive soil types. Therefore, for optimal results, dust suppression strategies should be tailored to sitespecific conditions, ensuring that both environmental and operational factors are considered, and resources used optimally.
Limitations of the study
While this study provides valuable insights into activity-specific dust emissions and the effectiveness of mitigation measures at a construction site, certain limitations must be acknowledged. These limitations also highlight areas for future research and potential methodological enhancements:
Based on the findings and limitations of this study, several key recommendations are proposed to support better targeted, evidence-based, and health-conscious air quality management within the construction sector:
A. Policy modifications for activity-specific regulation of PM emissions
B. Builders’ responsibility towards clean construction practices
Activity-specific policies, smarter scheduling, and stronger safeguards can significantly reduce construction dust and protect public health.
C. Strengthening occupational and public health safeguards against exposure to construction dust
These recommendations, if implemented in coordination with empirical monitoring and enforcement, can help transition the construction sector towards sustainable, health-conscious development, balancing the dual imperatives of urban growth and environmental protection.
Annexures
Annexure 1
The following table outlines the technical specifications and performance criteria of the low-cost PM sensors deployed for the study
Table A1. Table showing the specifications of the deployed low-cost sensors
| Parameter | Measurement Range | Unit |
|---|---|---|
| PM (PM2.5 and PM10 ) | Effective Range: 0–500 (as per NAAQS for PM2.5 and PM10) | µg/m3 |
| Accuracy (reproducibility) | ±10 | % |
| Minimum range of measurement | < 0.3 1.0~2.5 ; 2.5~10 | μm |
| Counting efficiency | 50%@0.3μm ; 98%@>=0.5μm | - |
| Response time: Single response time Total response time |
< 1 < 10 |
second(s) |
| Resolution | 1 | µg/m3 |
| DC power supply | Min:4.5 Max: 5.5 | Volt (V) |
| Operating condition: temperature range | 5 - 45 | °C |
| Operating condition: relative humidity range | 40 - 80 | % |
| Minimum sampling interval | 5 | min |
| Sensor/device certification | μm MCERTS (mandate) | |
| Evaluation metric - Correlation factor ($\text{R}^2$) - Maximum Deviation (RMSE) |
- > 0.75 across all seasons - Up to 35 ug/m3 across all seasons | |
| Calibration certificate | Certificate of tested and calibrated against beta attenuation monitor (BAM) |
Note: NAAQS- National Ambient Air Quality Standards (CPCB 2019); MCERTS- Monitoring Certification Scheme (EA 2017)
Annexure 2
The monthly windrose plots show the distribution of wind direction and wind speed at the study site from July 2023 to June 2024. The radial bars indicate the frequency of winds from each direction, while the colour scale represents wind speed ranges in m/s. The highest wind frequencies occur predominantly from the west and east, with notable seasonal variation. Mean wind speeds vary across months, with peak values in June (1.91 m/s) and lower speeds in November (0.37 m/s). Calm conditions are more frequent in the winter months, reaching over 51% in November.
Figure A1. Monthly windrose plots illustrating the prevailing wind direction and wind speed distribution at the study site
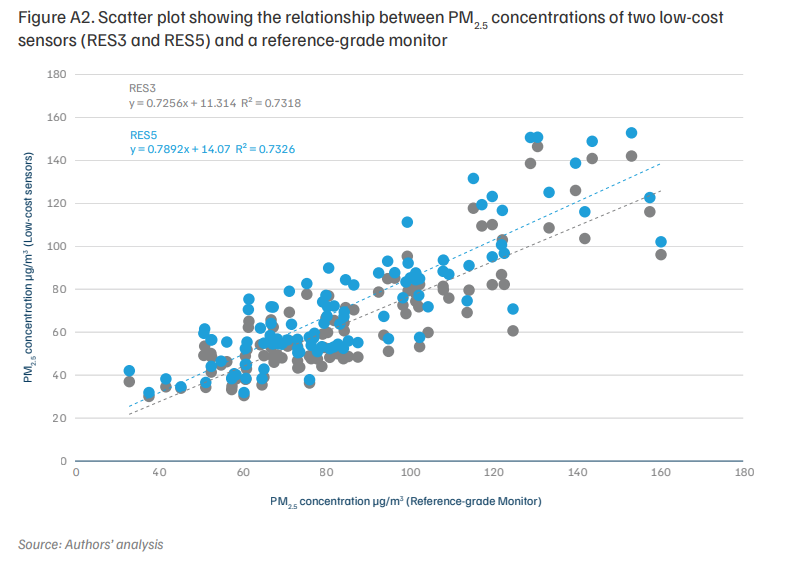
Annexure III
The following scatter plot shows the collocation analysis where PM2.5 concentrations measured by two lowcost sensors (RES3 and RES5) are compared against a reference-grade monitor. Both sensors show strong positive correlations with the reference data, with R2 values of 0.7318 (RES3) and 0.7326 (RES5). The regression slopes (0.7256 for RES3 and 0.7892 for RES5) indicate that both sensors slightly underestimate concentrations compared to the reference-grade monitor. However, the close agreement between the two datasets suggests reliable sensor performance.
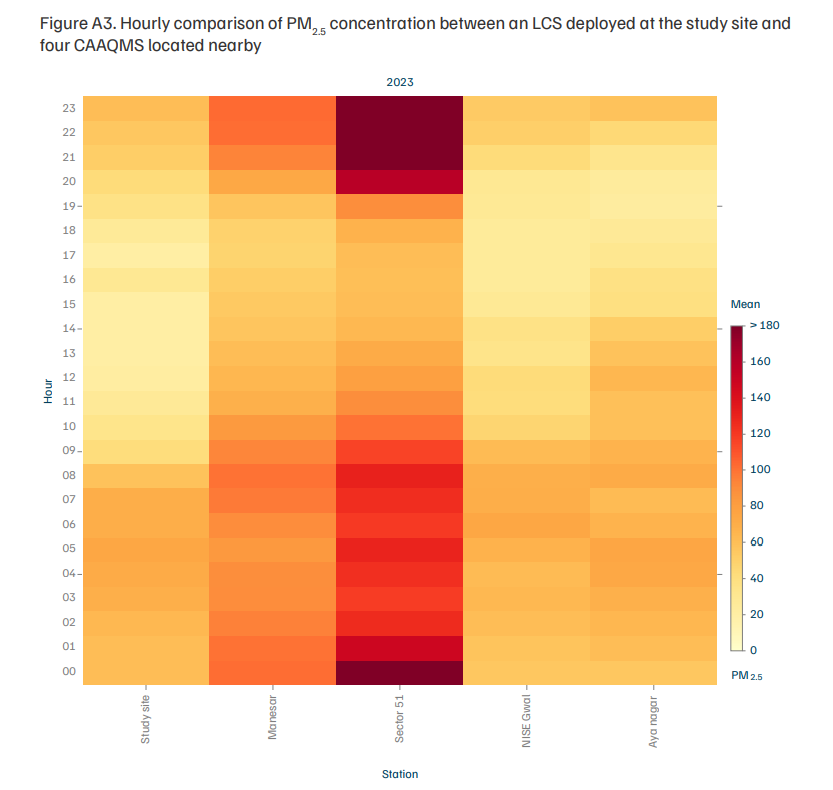
Annexure IV
The figure compares hourly PM2.5 levels from an LCS deployed at the study site with four nearby CAAQMS stations over a month. The nearest CAAQMS is in Manesar, which is about 9.5 km away from the study site. Differences in land use, land cover, and occasional data gaps led to variations in average concentrations, making exact matches difficult. However, it was observed that the diurnal trend follows a similar pattern, with lower PM2.5 levels typically observed during working hours (7 a.m.–7 p.m.).
Annexure V
Non-parametric tests, namely the Wilcoxon signedrank test and the sign test, were conducted to examine whether PM levels varied across different construction activities in comparison to no-work conditions. The results show that activities such as vehicle movement, road work, earthwork, and excavation showed statistically significant differences under both tests, indicating higher PM levels compared to no-work conditions. In contrast, foundation/framework and cement/concrete work showed no significant differences, suggesting relatively lower incremental dust generation. Interestingly, for brickwork, both tests indicated a significant difference; however, in this case, the dust levels were lower than those during the no-work condition. This could be due to the fewer occurrences recorded for brickwork activity, which may have affected the statistical outcome compared to the larger dataset available for the no-work condition.
Table A2. Table showing the statistical results of the non-parametric tests comparing the construction activities to no-work condition
| Parameter | Wilcoxon test statistics | Sign test statistics | ||
|---|---|---|---|---|
| Z value | p-value | Z value | p-value | |
| Vehicle movement | -8.4 | 0.000 | -8.9 | 0.000 |
| Road work | -5.0 | 0.000 | -4.5 | 0.000 |
| Earthwork | -3.4 | 0.001 | -3.3 | 0.001 |
| Excavation | -3.7 | 0.000 | -4.1 | 0.000 |
| Foundation/framework | -0.7 | 0.474 | -2.6 | 0.007 |
| Cement/concrete work | -0.5 | 0.555 | -0.2 | 0.769 |
| Brickwork | -4.96 | 0.000 | -5.37 | 0.000 |
Annexure VI
The following table presents average PM2.5 concentration of various construction activities carried out per month. The total number of days is presented alongside the concentration value of each specific activity along with the corresponding meteorological parameters for each month. It is observed that foundation/framework had the highest occurrence during the monitored period and brickwork the lowest.
Table A3. Monthly variation of PM2.5 concentrations across various construction activities and their relation to meteorological conditions
| Month | Average PM2.5 concentration (µgm¯³) of various construction activities | Meteorological parameters | |||||||
|---|---|---|---|---|---|---|---|---|---|
| Brickwork (n) | Cement/concrete work (n) | Foundation/framework (n) | Excavation (n) | Earthwork (n) | Road work (n) | No work (n) | Temperature (°C) | Relative humidity (%) | |
| Jul 23 | 25 (1) | 32 (10) | 34 (104) | 42 (74) | 38 (21) | 42 (6) | 29 (5) | 30.3 | 80.1 |
| Aug 23 | 24 (13) | 25 (9) | 25 (70) | 41 (76) | 41 (18) | 40 (12) | 24 (4) | 30.8 | 70.5 |
| Sep 23 | 30 (20) | 36 (16) | 34 (53) | 53 (73) | 43 (30) | 46 (16) | 21 (1) | 29.4 | 73.9 |
| Oct 23 | 55 (17) | 33 (9) | 104 (67) | 198 (38) | 168 (39) | 152 (30) | 78 (18) | 26.5 | 57.1 |
| Nov 23 | 237 (3) | - | 220 (12) | 249 (7) | 234 (5) | 272 (2) | 133 (112) | 20.3 | 71.4 |
| Dec 23 | - | 170 (5) | 164 (64) | 157 (25) | 157 (23) | 209 (22) | 119 (33) | 15.9 | 72.9 |
| Jan 24 | 171 (13) | - | 164 (82) | 174 (22) | 160 (17) | 169 (15) | 98 (59) | 10.9 | 84.4 |
| Feb 24 | 103 (9) | - | 112 (44) | 188 (7) | 182 (3) | - | 85 (34) | 17.8 | 63.6 |
| Mar 24 | 51 (2) | 53 (15) | 46 (78) | 67 (7) | 63 (11) | 67 (3) | 33 (72) | 23.1 | 52.8 |
| Apr 24 | 23 (2) | 31 (13) | 33 (81) | 38 (6) | 41 (19) | 35 (12) | 29 (67) | 29.8 | 33.7 |
| May 24 | 29 (7) | 35 (59) | 38 (3) | 44 (12) | 47 (17) | 31 (106) | 35.5 | 34.2 | - |
| Jun 24 | 36 (8) | 20 (7) | 24 (57) | - | 46 (11) | 44 (1) | 25 (98) | 34.7 | 48.9 |
Note: (n) denotes the number of days
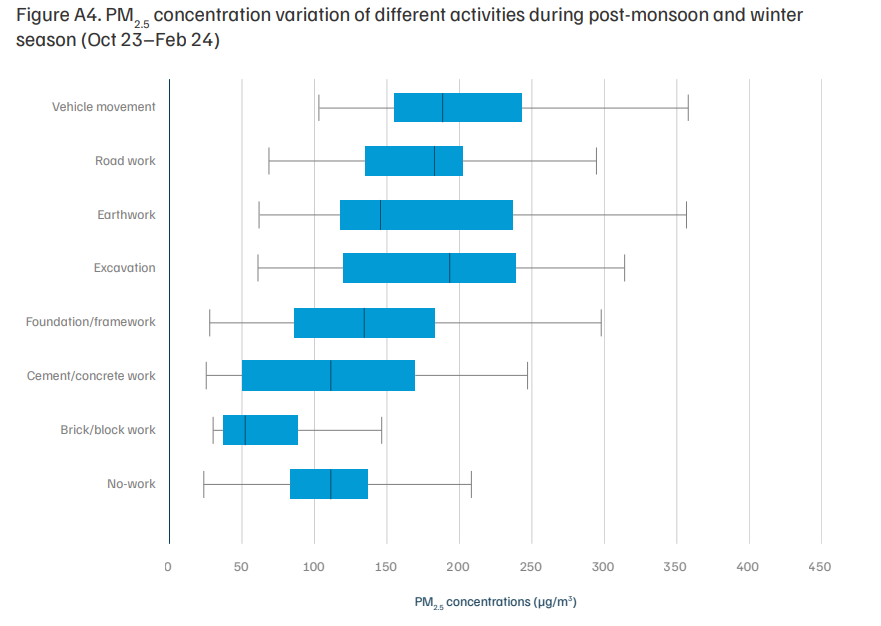
Annexure VII
The following boxplot shows the distribution of PM2.5 concentrations for different construction activities at the study site. Pollutant-intensive activities are associated with higher median PM2.5 levels and wider ranges, indicating more variability in emissions. However, non-pollutant-intensive activities show much lower concentrations. The long whiskers in some activities indicate occasional extreme pollution events. The elevated ambient pollution levels in winter from other probable sources integrate with the activity-wise concentrations and make it difficult to detect significant differences during the season.
Annexure VIII
The table presents the reduction in PM2.5 concentrations observed following the implementation of water sprinkling as a dust mitigation measure. The data represent working hours between 7 a.m. and 7 p.m., during which water sprinkling was carried out at different time intervals across multiple days. The corresponding meteorological parameters are also included to illustrate that the observed decrease in PM2.5 levels primarily resulted from the mitigation measure itself, rather than variations in weather conditions.
Table A4. Table showing the PM2.5 concentrations, temperature, and relative humidity for five selected days with the implementation of water sprinkling as a dust mitigation measure
| Time | 04-07-2023 | 25-07-2023 | 23-09-2023 | 28-09-2023 | 27-10-2023 | ||||||||||
|---|---|---|---|---|---|---|---|---|---|---|---|---|---|---|---|
| PM2.5 | T °C | RH | PM2.5 | T °C | RH | PM2.5 | T °C | RH | PM2.5 | T °C | RH | PM2.5 | T °C | RH | |
| 07:00 | 34.54 | 31 | 60 | 58.41 | 30 | 78 | 58.00 | 31 | 74 | 50.68 | 23 | 80 | 129.38 | 31 | 31 |
| 07:30 | 34.75 | 32 | 58 | 59.51 | 30 | 77 | 50.51 | 32 | 71 | 45.83 | 23 | 81 | 122.21 | 32 | 29 |
| 08:00 | 31.51 | 32 | 57 | 59.29 | 31 | 76 | 42.54 | 32 | 71 | 37.25 | 23 | 83 | 122.02 | 31 | 31 |
| 08:30 | 31.32 | 33 | 57 | 57.73 | 32 | 73 | 43.83 | 33 | 69 | 36.12 | 23 | 84 | 127.23 | 31 | 32 |
| 09:00 | 28.39 | 34 | 55 | 60.07 | 32 | 71 | 44.16 | 33 | 65 | 36.74 | 23 | 84 | 130.95 | 31 | 32 |
| 09:30 | 27.91 | 34 | 55 | 63.45 | 32 | 72 | 46.40 | 33 | 65 | 39.11 | 22 | 82 | 123.20 | 31 | 34 |
| 10:00 | 29.02 | 35 | 54 | 47.56 | 32 | 68 | 50.91 | 33 | 66 | 41.32 | 22 | 85 | 119.40 | 30 | 34 |
| 10:30 | 28.95 | 35 | 53 | 31.14 | 33 | 63 | 50.86 | 32 | 67 | 41.12 | 23 | 84 | 114.80 | 29 | 35 |
| 11:00 | 30.46 | 36 | 52 | 31.44 | 33 | 64 | 51.27 | 31 | 69 | 42.42 | 22 | 83 | 107.65 | 29 | 40 |
| 11:30 | 33.77 | 37 | 51 | 34.32 | 34 | 62 | 55.11 | 30 | 70 | 45.20 | 22 | 83 | 101.77 | 27 | 44 |
| 12:00 | 34.25 | 37 | 49 | 34.81 | 34 | 62 | 54.54 | 29 | 71 | 45.42 | 22 | 80 | 100.98 | 26 | 49 |
| 12:30 | 35.16 | 37 | 50 | 39.25 | 34 | 63 | 32.90 | 29 | 67 | 30.47 | 22 | 80 | 99.70 | 24 | 53 |
| 13:00 | 38.50 | 39 | 47 | 45.83 | 34 | 64 | 32.25 | 30 | 65 | 27.05 | 22 | 80 | 57.32 | 24 | 54 |
| 13:30 | 43.43 | 39 | 44 | 46.70 | 34 | 62 | 30.96 | 30 | 67 | 30.07 | 22 | 81 | 55.72 | 23 | 56 |
| 14:00 | 48.10 | 29 | 66 | 46.18 | 35 | 61 | 20.02 | 30 | 67 | 18.11 | 22 | 82 | 52.00 | 23 | 60 |
| 14:30 | 34.40 | 25 | 81 | 45.52 | 35 | 60 | 16.77 | 29 | 68 | 15.42 | 24 | 79 | 43.65 | 22 | 63 |
| 15:00 | 21.13 | 26 | 81 | 38.65 | 34 | 61 | 20.71 | 29 | 72 | 18.66 | 25 | 75 | 46.33 | 22 | 61 |
| 15:30 | 20.97 | 28 | 71 | 40.52 | 34 | 61 | 22.77 | 28 | 75 | 20.46 | 26 | 74 | 61.29 | 22 | 62 |
| 16:00 | 18.18 | 28 | 69 | 43.09 | 34 | 63 | 28.43 | 27 | 77 | 25.22 | 27 | 72 | 65.57 | 22 | 58 |
| 16:30 | 31.09 | 29 | 69 | 40.83 | 33 | 65 | 29.83 | 27 | 79 | 25.59 | 29 | 68 | 66.95 | 21 | 65 |
| 17:00 | 34.86 | 30 | 67 | 40.93 | 33 | 67 | 31.84 | 27 | 77 | 28.25 | 30 | 65 | 69.14 | 21 | 66 |
| 17:30 | 36.07 | 30 | 68 | 39.57 | 31 | 69 | 34.84 | 27 | 78 | 31.63 | 30 | 58 | 80.24 | 20 | 67 |
| 18:00 | 44.75 | 29 | 68 | 46.77 | 31 | 73 | 36.46 | 27 | 78 | 32.12 | 32 | 51 | 87.18 | 20 | 67 |
| 18:30 | 47.18 | 29 | 69 | 52.64 | 31 | 74 | 38.73 | 26 | 80 | 33.73 | 31 | 50 | 98.66 | 19 | 71 |
| 19:00 | 50.46 | 29 | 72 | 56.88 | 31 | 76 | 44.59 | 26 | 79 | 36.23 | 32 | 51 | 101.18 | 19 | 73 |
The pilot study categorised construction activities based on their potential to generate dust emissions. Excavation, earthwork, roadwork, and vehicle movement were found to be pollutant-intensive activities. Vehicular movement was identified as the most polluting activity (typically generating PM2.5 levels about 2.5 times higher than no-work levels) if the internal site roads are unpaved. During activities like excavation, earthwork, roadwork, and vehicle movement, the PM2.5 concentration increased by around 1.8 times compared to non-pollutant-intensive activities. Activities such as foundation and framework, brickwork, and cement and concrete work were considered non-pollutant-intensive or less polluting, generating median PM2.5 concentrations of less than ~40 μg/m³, which is similar to the median concentration recorded on no-work days.
Dust mitigation measures such as water sprinkling were found to be significantly effective at reducing PM2.5 levels at the construction site. If water sprinkling is deployed near an active area for approximately 30–40 minutes, PM levels can be reduced by 45–70 per cent. The positive impact of this intervention lasts for nearly 3 to 4 hours. Implementing water sprinkling at regular intervals of 3 to 4 hours, or approximately three times a day, is recommended to effectively reduce PM levels and minimise exposure risks.
The report argues that current measures, such as blanket construction bans enforced under the Graded Response Action Plan (GRAP), are often applied without sufficient ground-level data to distinguish which activities are the most polluting. These restrictions often disproportionately affect daily-wage workers, contractors, and builders. For instance, construction activities in Delhi-NCR were halted for a cumulative total of 78 days under GRAP in 2023 and 2024, leading to delays, increased project costs, and loss of income for workers. The study advocates for a targeted, activity-specific framework that restricts only pollution-intensive tasks while permitting less polluting ones with safeguards. This approach is seen as crucial for balancing environmental concerns with economic continuity.
The average PM2.5 concentration levels recorded during pollutant-intensive activities were significantly higher compared to the background, or "no-work," concentrations. The median PM2.5 concentrations for vehicle movement (98 μg/m³) was around 2.5 times higher than the no-work median concentration (40 μg/m³). When comparing the average concentrations of activities to the average no-work conditions (63.4±2.12 μg/m³), the pollutant-intensive activities showed substantial increases: vehicle movement caused a ~122 per cent spurt, road work showed a ~78 per cent spurt, earthwork showed a ~44 per cent spurt, and excavation showed a ~35 per cent spurt.
Organic Waste Circular Economy for Viksit Bharat
How Can India Tackle Air Pollution with an Airshed-level Approach?
Roadmap of the methodology to assess the climate co-benefits of the SUP ban in Tamil Nadu
Roadmap of the methodology to assess the climate co-benefits of the SUP ban in Maharashtra
Monitoring Crop Residue Burning Better: