Council on Energy, Environment and Water Integrated | International | Independent
Suggested Citation: Chauhan, Samradh Singh, Arpan Patra, and Himani Jain. 2025. What is the Electrification Potential of Door-to-Door Waste Collection Vehicles in India? New Delhi: Council on Energy, Environment and Water.
The study examines the electrification potential of door-to-door waste collection vehicles in India. It is divided into answering two key research questions: one discusses the economic outlook of vehicle electrification, while the other emphasises the potential for Electric Vehicle (EV) integration within the door-to-door waste collection fleet on a national scale. To understand the city operations, we examined the case of Amritsar in Punjab and also conducted a sensitivity analysis based on daily operations in other Indian cities. We then identified the national demand for door-to-door waste collection vehicles until 2030 and developed electrification scenarios accordingly. The research also suggests essential actions to electrify this sector through policy initiatives.
Around 150,000 tonnes of waste is collected daily in Indian cities (CPCB 2021), and its collection and transportation can account for around half of a city’s municipal expenditure on waste management (Ahluwalia and Patel 2018). Emissions data for waste collection and transportation is limited. However, one study highlights that municipal waste transportation annually emits around 67 thousand tonnes of CO2, 613 tonnes of NOx and 100 tonnes of Particulate Matter (PM) in Mumbai (B.K. Sharma and Chandel 2019). Solid waste management (SWM) has become increasingly crucial for air pollution emission reduction strategies, and cities must develop strategies to cut emissions through an economically effective transition. The Council on Energy, Environment and Water (CEEW), as part of its efforts to develop sustainable mobility strategies to reduce air pollution, has analysed the potential of electrifying incumbent internal combustion engine (ICE)-based door-to-door (D2D) waste collection vehicles in Indian cities.
Punjab is the only state in India with an EV policy that aims to electrify waste collection fleets by providing targeted incentives. We have used Amritsar as a case study to showcase D2D waste collection fleet electrification’s impact and benefits, as the city has already gained momentum in clean transport through its RAAHI scheme, accelerating the electric transition of its diesel passenger autos. Moreover, Amritsar represents a typical million-plus non-attainment city under the National Clean Air Programme (NCAP). The city’s population of around 1.4 million generates 425 tonnes of waste daily. We collected data from city authorities, including trip details of the waste collection vehicle fleet and conducted interviews with drivers, private operators, and several waste management experts. A market review of the available ICE and electric vehicles forms the base for analysis. Using the case of Amritsar, this study highlights the high economic and environmental benefits of EV transition in D2D waste collection operations.
Moreover, escalating solid waste generation rates (Kumar and Agrawal 2020) and increasing urbanisation in India drive the concurrent demand for waste collection and transportation. Class I Indian cities (cities above 1 lakh population) generate almost 70 per cent of India’s total annual solid waste (K.D. Sharma and Jain 2019). Thus, the D2D waste collection fleet requirements in Class I Indian cities were estimated by analysing waste generation trends and MoHUA’s waste collection vehicle deployment standards. Based on the fleet requirements, we created EV transition scenarios till 2030. Finally, the D2D waste collection ecosystem’s electrification potential is summarised using a Political, Economic, Social, Technology, Environmental and Legal (PESTEL) framework, which provides a net positive outlook for electrification.
The EV transition potential is high due to the D2D waste collection vehicle segment’s fixed route operations, scheduled daily trips and adequate fixed parking availability with municipal corporations. Since the primary performance metric for D2D waste collection vehicle operations is the amount of waste transported rather than the distance travelled daily, the total cost of ownership per tonne (TCO/tonne) is a better metric to assess SWM EV potential than TCO/km.
With rapid urbanisation, economic growth and the subsequent changes in consumption patterns, Indian cities are burdened with solid waste management (SWM) issues. Recent estimates show India generates 62 million tonnes of municipal solid waste (MSW) annually, with a collection efficiency of 70-90 per cent (Tewari 2021; Singh, Singh, and Singh 2024). At the city level, waste generation varies according to population density, geography, demography, or even the type of local economy. For instance, tourism economy based cities like Leh and Panaji produce almost three times more waste per capita (1–1.2 kg per day per person) than other Indian cities, generating about 0.1-0.5 kg per day per person (Meena et al. 2023; NITI Aayog 2021).
The transport demand to manage this waste in most cities of India is fulfilled by ICE-based vehicles. These vehicles, typically powered by Diesel or CNG, are a source of greenhouse gases (GHG) and air pollutants. According to a study in Mumbai, due to the transportation of MSW through diesel vehicles, around 67,000 tonnes of CO2, 613 tonnes of NOx and 100 tonnes of PM are emitted annually (B.K. Sharma and Chandel 2019). Since transportation is an emission-intensive process, there is a need to manage the emissions.
With the onset of the Swachh Bharat Mission in India, cleanliness has been a priority at all tiers of governance, and one of the main objectives of the mission was achieving 100 per cent D2D waste collection. Solid waste management in a city consists of three steps: waste collection, waste transportation, and waste treatment (or disposal). The initial stage of waste collection, i.e., the D2D or primary waste collection from household/ commercial areas to waste transfer stations, is carried out using light commercial vehicles such as threewheeler autos/tempos or four-wheeler utility vehicles. The secondary waste collection stage includes the transportation of waste from transfer stations to landfills or dump sites, which is usually done using heavy-duty vehicles such as trucks, dumpers, etc.
Urban local bodies (ULBs) spend 15–25 per cent of their annual revenue expenditure on waste management budget, out of which 45 to 90 per cent is spent on waste collection and transportation (depending on city size) (Ahluwalia and Patel 2018). There is scope for vehicle technology transition in this transportation process and simultaneously reducing related costs.
Can EVs replace ICE-based door-to-door (D2D) waste collection vehicles?
To reduce tailpipe emissions and gain economic benefits, transitioning the D2D waste collection vehicles to cleaner fuel technologies can have high potential. Due to the fixed scale of operations involved in D2D waste collection, the potential for adopting electric vehicles remains high. India has already indicated and established its ambitions for transitioning to electric vehicles (EVs) through several national and statelevel policies. The Faster Adoption and Manufacturing of (Hybrid &) Electric Vehicles in India (FAME India) scheme was launched by the Government of India to promote EV adoption at a large scale. Almost all Indian states have also lined up their EV policies to support this technology transition. Financing electric vehicles for smoother adoption has also worked as a lever. However, different fleet segments have varying electrification potential.
A few Indian cities have already started using EVs for D2D waste collection purposes. For instance, Vijayawada in Andhra Pradesh piloted an electric three-wheeler-based waste collection system in 2017 (The New Indian Express 2017). The Andhra Pradesh government procured 1,800 electric vehicles for waste collection in various cities (The News Minute 2021). Coimbatore planned a fleet of 250-plus EVs in 2019 (The Hindu 2019). The Surat Municipal Corporation added EVs to its current D2D waste collection vehicle fleet, replacing seventy-nine old ICE vehicles with 124 electric three-wheelers (Times of India 2022). Lucknow has also recently deployed more than 700 vehicles in its D2D waste collection fleet (Bitra 2024). Chennai has transitioned to a mass operations scale—it manages over 3,000 electric carts (e-carts) for D2D waste collection and serves more than four million people in the city (The Hindu 2020).
Besides Chennai and Lucknow, many other cities have started EV operations in D2D waste collection, underscoring this segment’s potential for electric transition. The EV operations are at a pilot scale in most other cities or limited to smaller service areas. Also, most Indian cities use e-carts with a payload capacity between 250 and 400 kg, 50–60 per cent less than ICE vehicles.
This study aims to assess the potential of electrification of D2D waste collection vehicles in India by conducting a feasibility analysis at the city level. Punjab is the only state in India explicitly mentioning its EV transition targets in its 2022 EV policy for waste disposal fleets or D2D waste collection vehicle fleets in its cities. We have selected Punjab’s Amritsar city as a case study, as the EV transition there has already gained momentum in the past few years through government schemes such as RAAHI, under which diesel-based passenger three-wheelers have started transitioning to EVs (UITP 2022). We acquired operational characteristics data on these vehicles from city officials to assess the technoeconomic feasibility of electrifying Amritsar’s D2D waste collection vehicle fleet. We also conducted a comprehensive market review of the existing D2D waste collection vehicle fleet and conducted expert interviews to inform the techno-economic evaluation.
As the MSW generation increases in urban India, there will be a higher demand for D2D waste collection vehicles, and this demand majorly lies in cities with populations above 100,000 people, as more than 70 per cent of India’s MSW comes from these cities (Kumar and Agrawal 2020). Thus, there is also a need to assess the future fleet size requirements of D2D waste collection vehicles in Indian cities. Using MoHUA guidelines for deploying D2D waste collection vehicles and waste generation trends in Class-I cities, we have estimated and projected the demand for D2D waste collection vehicles. Lastly, EV transition scenarios for these vehicle fleet segments were created until 2030 to inform the national-level policy interventions. To understand the ecosystem’s favourability towards electrification, the analysis is compiled in a Political, Economic, Social, Technological, Environmental and Legal (PESTEL) format, which is already showcased as an effective tool for assessing the potential of electrification (Harikumar et al. 2022).
BOX 1: Greater Chennai’s e-cart based D2D waste collection system
The Greater Chennai Corporation (GCC) uses a fleet of 3,000 e-carts to provide D2D waste collection and transportation services to almost 800,000 households, or around four million people. It serves an area of 207 sq. km., which is 55 per cent (seven out of 15 zones) of the Chennai Metropolitan Region. The service commenced in 2020 with an eight-year contract with a private firm, Urbaser Sumeet. The same fleet is also used for roadsweeping operations.
The fleet works in three shifts:
The vehicles used for waste collection are fitted with lightweight containers instead of automated tippers, reducing the dead load on the vehicle and making room for more waste. There is no helper for each vehicle, and the residents dump the waste in segregated bins. The software manages vehicles’ routes and operational hours, optimises charging and reduces operational costs. All the e-carts are installed with GPS and RFIDs, which ascertain the location, operational hours and work done by the vehicles. The service provider is solely responsible for investing in equipment and manpower. The tipping fee model was discarded, and the payment mode is based on fulfilling key performance indicators. Contract fees are divided 50:50 between fixed pay and variable pay, with variable pay based on performance indicators or service-level benchmarks (Clean India Journal 2022).
The system initially faced several challenges, such as the fact that no driving licence was required for e-carts and no category for them to get registration in the regional transport office (RTO). Thus, it became a grey area. However, a separate e-cart registration category was created after deliberations between GCC and the Transport Department. No registration fee was required, and the Transport Department would collect only a sum of INR 3,500 for the fitness certificate. A driving licence category for e-carts was also added.
The KPI-linked model forces the service provider to perform well and not cut corners. It promotes a decentralised waste management system.
D2D waste collection vehicle market in India
The D2D waste collection vehicles fall under the small/ light commercial vehicles category. All the vehicles in this segment come with a standard chassis that can be used for goods carriage, or modified with tippers for waste collection. As per the Ministry of Road Transport and Highways (MoRTH) classification, D2D waste collection vehicles used in Indian cities broadly fall under three categories: L5N, N1, and/or e-cart.
The size of the solid waste collection vehicles market in India is expected to grow because of the increasing quantity of MSW that needs to be managed daily. Compared to passenger vehicles, the electric vehicle variants in the D2D waste collection (utility segment) are still limited in the Indian market. A few legacy OEMs have launched their electric variants for the D2D collection of the MSW, which are presented in Table 1. The range of the EVs in this segment differs according to the vehicle size and battery. Some OEMs offer swapping technology models in the three-wheeler passenger vehicle segment, but no such technology options are available in the utility or D2D waste collection vehicles. Swapping technology can even reduce the upfront capital cost burden. Still, due to its unavailability for the D2D waste collection use case, the study is restricted to point-charging vehicles only.
Table 1 ICE and EV vehicles available in the D2D waste collection segment in India

| MoRTH vehicle category | N1 | N1 | L5N | L5N | L5N | e-cart |
|---|---|---|---|---|---|---|
| Payload capacity | 750 kg | 600 kg | 400–450 kg | 550 kg | 506 Kg | 300 Kg |
| Mileage/ Certified range | 22 km/l | 154 km | 30 km/l or 38 km/kg |
80 km | 90 Km | 80–100 km |
| Gradeability | 27.5% | 22% | -- | 7% | 17% | -- |
| Battery type | NA | Lithium-ion iron phosphate | NA | Lithium-ion | Lithium-ion | Lead acid |
| Battery capacity | NA | 21.3 kWh | NA | 7.37 kWh | 8 kWh | -- |
| Charging time | NA | 105 mins (Fast) 6–7 hours (Slow) |
NA | 3 hours 50 mins (slow) | 3 hours 45 mins (slow) | -- |
| Battery warranty | NA | 5+ years | NA | 1 lakh km | 1 lakh km | -- |
| Total cost of vehicle (INR) | 6–7 lakh (0.6–0.7 million) |
8–9 lakh (0.8–0.9 million) |
3–3.5 lakh (0.3–0.35 million) |
3.5–4 lakh (0.35–4 million) |
3.5–4 lakh (0.35–4 million) |
2 lakh (0.2 million) |
Source: Author’s compilation from Original Equipment Manufacturers (OEM) websites (2024)
The choice of vehicles for the MSW collection and transportation is primarily dependent on factors including efficiency (to maximise the coverage in terms of area and amount of waste), convenience (i.e. the vehicles should be easily manageable for both residential and commercial purposes), compatibility (i.e. the vehicles should be compatible with the hydraulics and separator), public health safety (i.e. vehicles with least chances of leakage) and the ownership (i.e. facilities with optimised costs).
Since EV manufacturing for this segment is still evolving, we conducted in-depth discussions with experts from the manufacturing field (EVage), vehicle prototype designers (Advandes Pvt Ltd) and a few municipal SWM managers. We found no existing market estimation of the D2D solid waste collection vehicles for urban India. Industry experts suggest it might range from 60,000 to 90,000. In addition to the legacy OEMs, many start-ups have entered the field and continuously innovated new products through robust research and development. These OEMs also provide ULBs with choices for modifying their current fleet.
Electric vehicles are frequently criticised for their lower endurance in solid waste management systems. From a ULB’s viewpoint, the officials are inclined towards pilot programmes at this initial stage of technology development in the D2D waste collection segment. The SWM operational managers in cities have highlighted that leachate from wet waste frequently corrodes the material of vehicles, leading to battery degradation and other logistical shortcomings. However, the OEMs are aware of the leachate problem and are pursuing necessary changes by ensuring that the materials used to make the tipper and body chassis are robust enough to bear such corrosive behaviour.
The daily handling of different waste materials from residential and commercial facilities also impacts the vehicle’s longevity. Experts highlight that the average lifespan of a typical D2D waste collection vehicle is seven years. The MoHUA’s SWM manual also provides information on the eight-to-ten-year lifespan of waste management vehicles (CPHEEO 2003). In such a case, there is a need for EV manufacturers to learn from past experiences in designing waste collection vehicles, improve the chassis and tippers to serve longer lifespans and safeguard the electrical circuits or powertrain of a typical EV.
The Government of Punjab targets a 100 per cent transition of its existing waste disposal ICE vehicles to EVs by 2027. The Punjab EV Policy 2022 offers purchase incentives for the first 5,000 electric D2D waste collection vehicles across its target municipal corporations (Amritsar, Jalandhar, Ludhiana, Patiala and Bathinda). The policy also highlights the usage of funds under the state’s ‘Swachh Bharat Kosh’ to support this transition. Based on the learnings from Tamil Nadu’s capital Chennai, Punjab’s Ludhiana city has deployed around 350 e-rickshaws in its waste management system, covering 160 square kilometres of city area (Hindustan Times 2022).
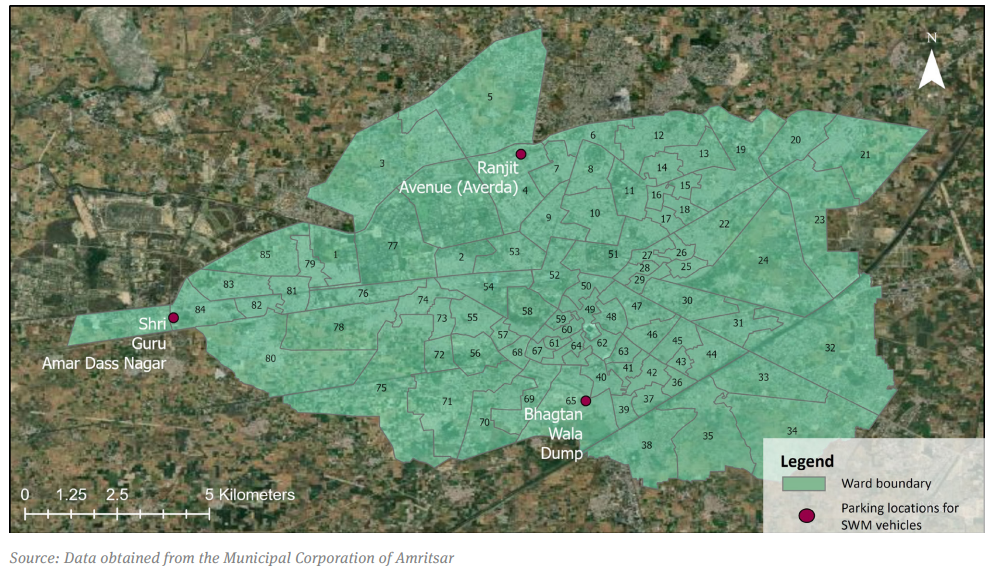
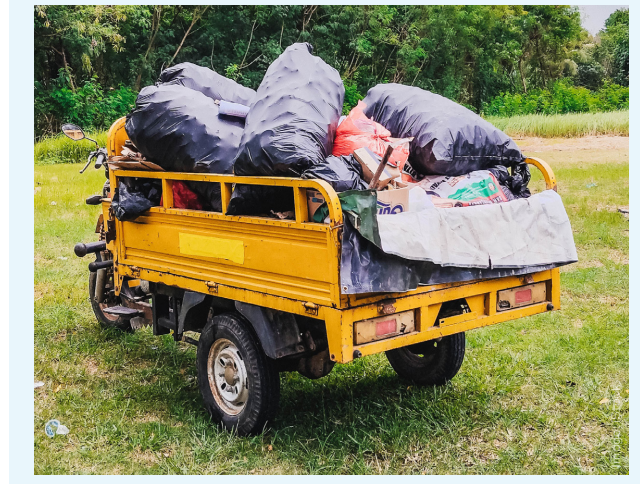
The city of Amritsar has an estimated population of 1.4 million and generates 420 tonnes of daily waste. It is also one of the non-attainment cities in India1 , and vehicular emissions contribute around 30 per cent of the city’s particulate matter pollution (MoEFCC 2023). Currently, the city has 200–220 diesel four-wheelers with 750 kg payload capacity available for D2D waste collection. Amritsar’s waste collection, processing, and disposal system is contracted to a private agency. The city has three parking locations from where these vehicles are managed daily.
To assess the viability of the transition of D2D waste collection vehicles in Amritsar, we determined the total cost of ownership (TCO) of ICE and electric variants. Most D2D waste collection vehicles in Indian cities run on diesel/CNG fuel. The specifications of the different ICE and electric variants mentioned in Table 1 have been used in the TCO analysis. A brief description of the assumptions and calculations is presented in the Annexure.
Information about D2D waste collection, such as daily utilisation (trip lengths), fleet size, operational hours, etc., was collected from Municipal Corporation of Amritsar officials and waste management vehicle operators. A primary component of the analysis was the lifespan of the D2D waste collection vehicles. As discussed with SWM experts and municipal officials, D2D waste collection vehicles usually have seven to eight years of lifespan. Additional costs, such as vehicle purchase, fuel, and taxes, are gathered from market review.
Figure 1 Amritsar’s door-to-door waste collection vehicles have three distinct parking depots
To have coherence among the ICE vehicles and EVs on fuel efficiencies, the analysis is expressed in terms of kilometres per megajoule (km/MJ). Where an ICE vehicle has a fuel efficiency of 0.4 km/MJ, an EV can give a fuel efficiency of 1.5 km/MJ. Usually, TCO analyses are carried out on a per-kilometre basis (or per-unit distance basis). However, SWM is a specific use case focusing on waste movement across the city, and the payment terms are negotiated on a per-tonne basis. Hence, this study determines economic viability per tonne of waste collected and transported. This will help decisionmakers understand the operational parity and provide them with savings per tonne of waste collected.
Figure 2 On a unit distance basis (TCO–INR/km), e-carts are found to be the cheapest to operate in a 15 km daily vehicle utilisation case of Amritsar
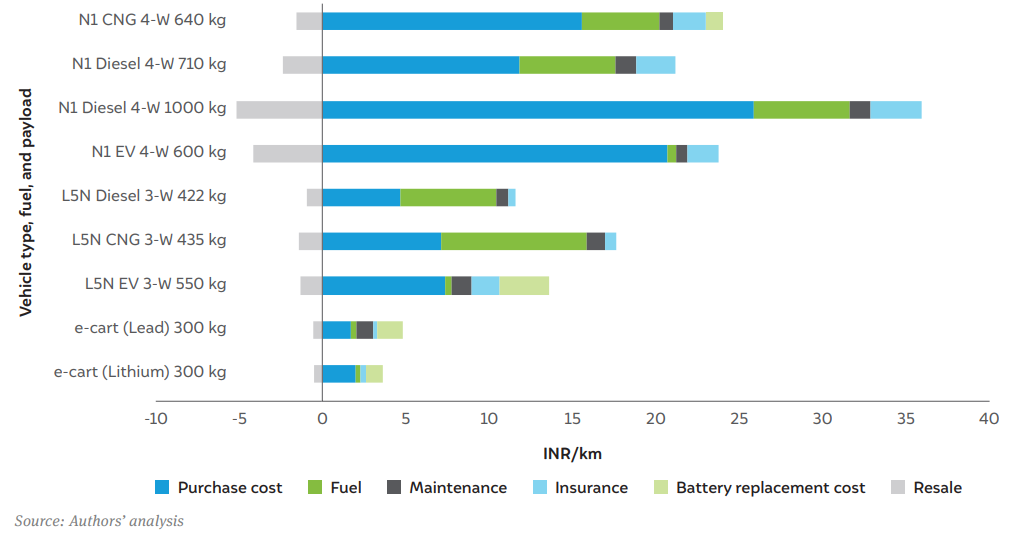
At the current D2D waste collection vehicle utilisation of 15 km per vehicle per day in Amritsar, the TCOs (per km) for e-carts are found to be lower than other ICE counterparts. However, as discussed in Section 1.2 and Table 1, ICE vehicles have a higher payload capacity than existing EVs. Thus, the economic benefits of EVs would be misinterpreted if the discussion is restricted to the cost per km conversation only. As per inputs from solid waste managers and sector experts, the concessionaire agreement in most of the cities is at the cost per unit mass of operation (for example, INR/tonne of waste collected). To integrate that aspect, we modified the TCO analysis, and the economic efficiencies of the vehicles on cost-per-tonne of waste collected were evaluated.
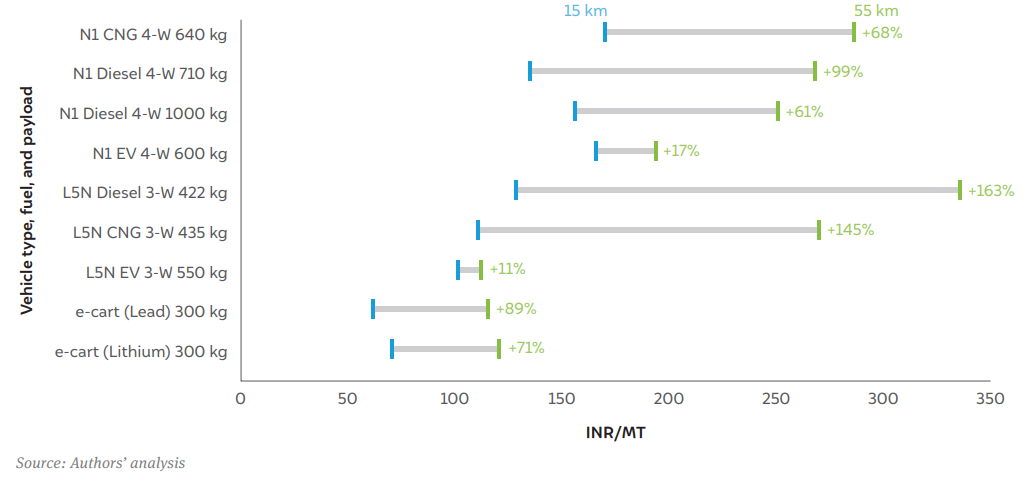
The TCO per tonne analysis assumes that each vehicle must carry approximately two tonnes of waste to meet Amritsar’s daily demand. Compared to ICE vehicles, TCOs are found to be lowest for three-wheeler EVs and e-carts. Figures 2 and 3 show that the current analysis is based on the 15 km per day utilisation of Amritsar’s four-wheeler D2D waste collection vehicles. Different cities have varying daily utilisation rates. Data from cities of varying population sizes between 100,000 to eight million was collected. In cities such as Bengaluru, Coimbatore, Rajkot, Surat, Jaipur, etc., per day vehicle utilisation of D2D waste collection varies between 10 km to 50 km (Itnal 2015; Velumani 2013; Pujara et al. 2023; Jain et al. 2020; Joshi, Sharma, and Kumar 2021). The overview of other cities suggests that daily D2D waste collection vehicle utilisation is below 55 km. Thus, we also performed a sensitivity analysis of TCOs per tonne till 55 km daily vehicle utilisation.
In Amritsar, the daily vehicle utilisation might also increase depending on the city’s ward rearrangements or municipal boundary expansion. Figure 4 shows the change in TCO based on the increasing utilisation of D2D waste collection vehicles. It highlights that the TCOs of ICE vehicles increase rapidly as the daily vehicle utilisation rate increases, whereas the TCOs of L5N category e3W (550 kg payload) and EV 4-W (600 kg payload) rise steadily. e-carts can be considered the cheapest for the city’s current vehicle utilisation at 15 km. However, for about 55 km per day utilisation, L5N category e3W (550 kg payload) will be the most economical.
Figure 3 On a per tonne waste collected basis (TCO–INR/MT), e-carts and L5N category e3Ws are found to be the cheapest to operate in a 15 km daily vehicle utilisation case of Amritsar
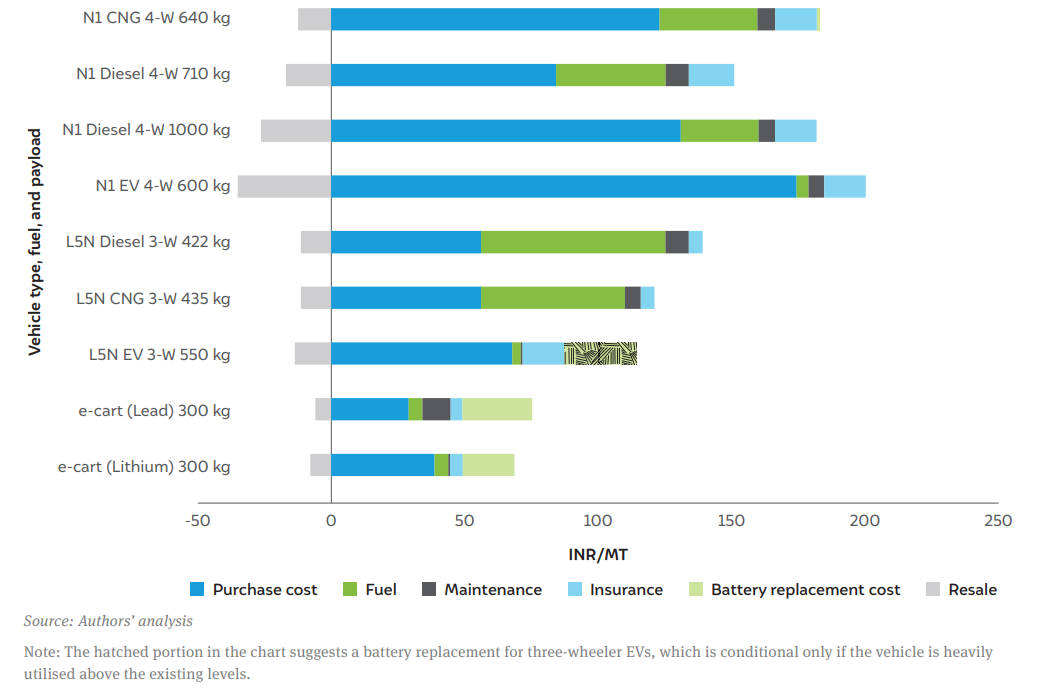
FIgure 4 EV TCO rises more steadily than ICE-based vehicles with higher daily utilisation
Three-wheelers or e-carts have lesser payload capacities than the current diesel four-wheelers in Amritsar. The city’s current fleet consists of approximately 200–220 vehicles. To maintain the current level of waste collection service, replacing diesel four-wheelers with EVs of lower payload capacity would necessitate either increasing the daily utilisation per vehicle or expanding the fleet with more EVs. Further analysis indicates that the Municipal Corporation of Amritsar can reduce 60–80 per cent of its fuel costs if it converts its existing D2D waste collection fleet to three-wheeler EVs. For instance, if the fleet of around 200 diesel vehicles is converted to EVs, the MCA can save between INR 5–7 million (50–70 lakh) per year. Additionally, the OEMs manufacturing the EVs guarantee minimum maintenance charges compared to the ICE variants, which can save even more money during operations.
Charging facilities at the municipal workshops/parking facilities would be necessary to support this electric transition. There are eight hours of complete idle time in Amritsar’s D2D waste collection operations, which can be effectively used to charge the vehicles. Currently, the MCA has three parking locations spread across the city, which can be used for charging purposes during non-operational hours. If policies and business models are devised to allow the MCA to publicly offer these charging facilities in lean/non-use periods to generate extra revenue, this also presents an investment opportunity.
Environmental benefits of electrifying D2D waste collection vehicles
This section focuses on the environmental benefits of the operational emissions, not the embodied emissions (emissions released during the manufacturing of vehicles). We also assumed that all the electricity that the EVs will consume will be primarily produced from conventional sources such as coal. The reduction in emissions may also vary depending on factors such as maintenance, engine load, fuel efficiency, etc. A diesel vehicle emits 1,156 kg of CO2 annually during its operation in Amritsar, whereas an EV counterpart will produce 64 per cent less CO2, even considering a coalpowered grid-level emission. As the EVs don’t produce any tailpipe emissions, savings of 83 kg of PM2.5 and about 0.5 tons of NOx are estimated annually per vehicle.
BOX 2: Are e-carts a sustainable option in the long term?
An e-cart, which mainly runs on lead-acid chemistry, has a battery that is replaced more often than the lithium-ion-based L5N electric three-wheelers. Traditional e-cart batteries require frequent charging and have shorter lifespans than the lithium-ion batteries found in more advanced electric three-wheelers of the L5N category (Tirpude et al. 2020). Additionally, e-cart manufacturing is highly concentrated in informal markets that lack standardisation, safety, and quality, leading to a shorter vehicle lifespan (Gupta 2021). Thus, e-cart segment requires multiple ecosystem improvements to become a sustainable alternative.
Source: Authors’ compilation
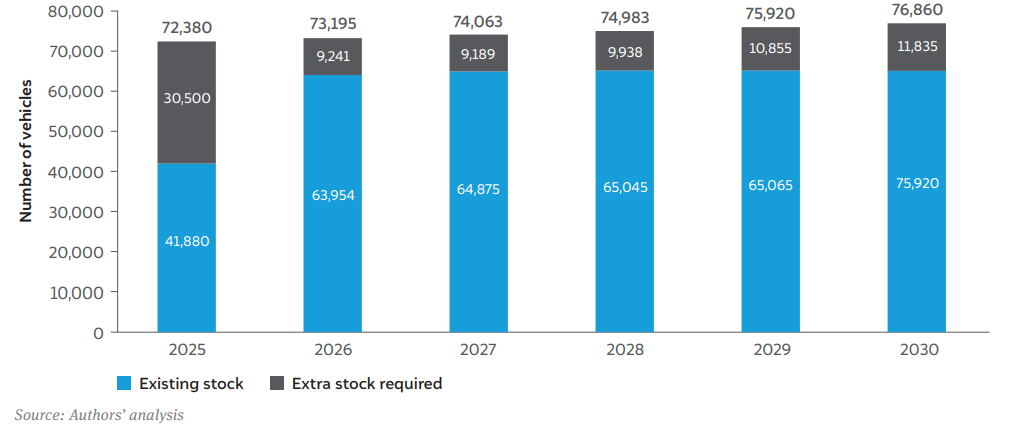
As discussed in Section 1.2, sector experts have highlighted a lack of evidence on the national market size for D2D waste collection vehicles. To calculate and compare the existing and required D2D waste collection fleet, we have used recommendations from the CPHEEO manual 2016 (Table 3). This suggests providing one D2D waste collection vehicle for 1,000–1,500 households, depending on the vehicle’s payload capacity to be deployed.
The amount of waste produced at the national level was estimated based on projections of the urban population and per capita waste generation in Class-I cities. As urban populations rise, waste production will increase by 3–4 per cent each year at the city level (K.D. Sharma and Jain 2019). Based on the existing trend in India’s urban population growth, the total waste produced in Class-I cities will reach 216,169 tonnes per day (TPD) by 2030. Further, based on the MoHUA’s recommendations for vehicle requirements, the Class-I cities of India will thus require more than 80,000 new vehicles for D2D waste collection by 2030. If planned effectively, electric vehicles have a considerable potential to be part of this future fleet stock.
Table 2 Primary D2D waste collection resource deployment guide
| Vehicle for primary waste collection | Number of households to be covered | Total number of people served | Number of staff required |
|---|---|---|---|
| Light Commercial Vehicle (LCV) with 500–700 kg capacity | 1,000 | 5,000 | One driver and two labourers per LCV |
| LCV with more than 700 kg capacity | 1,500–2,000 | 7,500–10,000 | One driver and two labourers per LCV |
Source: MoHUA 2016
Figure 5 Class I Indian cities will require around 80,000 new D2D waste collection vehicles by 2030
This section recommends two scenarios for procuring new vehicles at the national level. The scenarios are driven by input from sector experts and different state-level EV policy targets in India. The two proposed scenarios are contrasted with a business-as-usual or BAU scenario, in which all future purchases would be diesel-fuelled, and there would be no EV adoption in this fleet category.
Table 3 Electric transition scenarios for D2D waste collection vehicles in India
| Scenario | Description and assumptions | EV penetration targets |
|---|---|---|
| Business-as-usual | Vehicles deployed in cities at one vehicle per 1,000 households | 0% EV penetration |
| Low-ambition scenario (LAS) | Vehicles deployed in cities at one vehicle per 1,000 households and steady electrification is targeted | 2025–27: 30% of new sales are EVs 2028–30: 50% of new sales are EVs |
| High-ambition scenario (HAS) | Vehicles deployed in cities at one vehicle per 1,000 households, and accelerated electrification is targeted. (The government realises the high potential of electrification in this segment, and the industry response is quick enough) |
2025–27: 50% of the new sales are EVs 2027 onwards: 100% of the new sales are EVs |
Source: Authors’ compilation
Figure 6 Electrification of India’s D2D waste collection fleet by 2030 is projected to reach 35% under a Low Ambitious Scenario (LAS) and 65% under a High Ambitious Scenario (HAS)
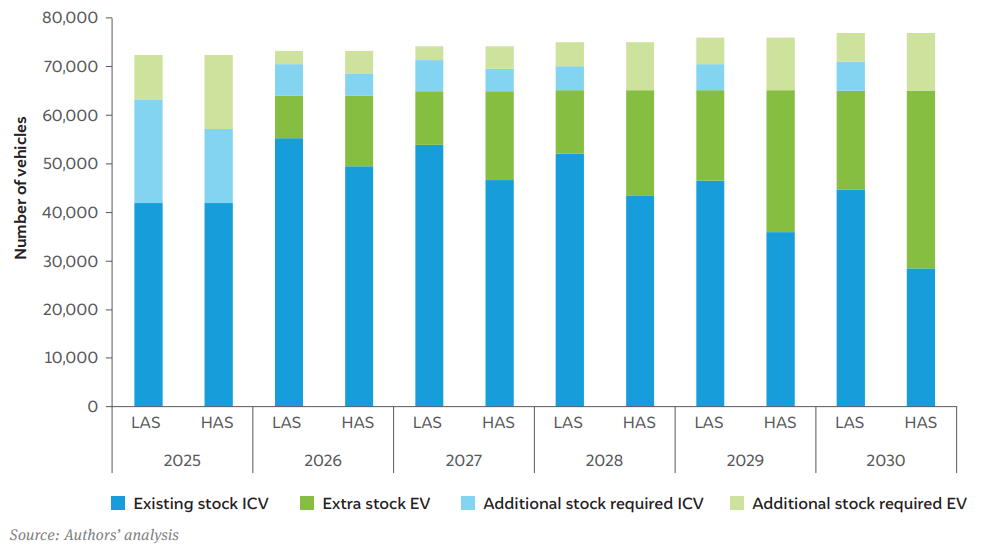
In the LAS, a cumulative demand of 26,000 EVs will be generated by 2030, resulting in an EV penetration of about 35 per cent of the total D2D waste collection fleet by 2030. Meanwhile, in the HAS, an EV penetration of about 65 per cent can be achieved through a cumulative demand of around 48,000 EVs in the total D2D waste collection fleet of Indian cities by 2030. We have determined these demands were based on the survival curve, considering the twelve-year life expectancy of these vehicles, and an advancement in vehicle technology was assumed over a period of time.
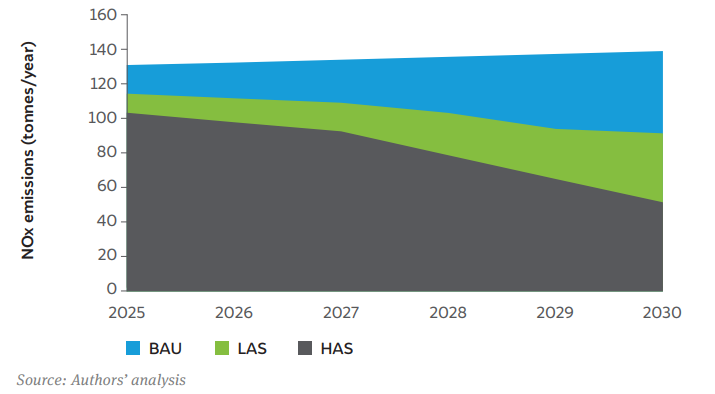
Such electrification scenarios would help reduce greenhouse gas emissions and critical air pollutants from the atmosphere. As the HAS recommends an accelerated adoption rate of EVs, it also results in proportionate benefits in terms of emission reduction. The analysis suggests that the reduction in CO2 emissions between the base year 2025 and the target year 2030, in the case of LAS and HAS scenarios respectively, will be 22 per cent and 40 per cent. The analysis further projects a 34 per cent to 63 per cent reduction in PM2.5 and NOx emissions by 2030 (in LAS & HAS, respectively) compared to the BAU (2025 baseline). Thus, this would also help the cities improve their environmental health and reduce the exposure burden of the people directly involved in this occupation.
Figure 7 In the high ambitious scenario (HAS), an average of ~25% of CO2 emissions will be reduced each year between 2025 and 2030
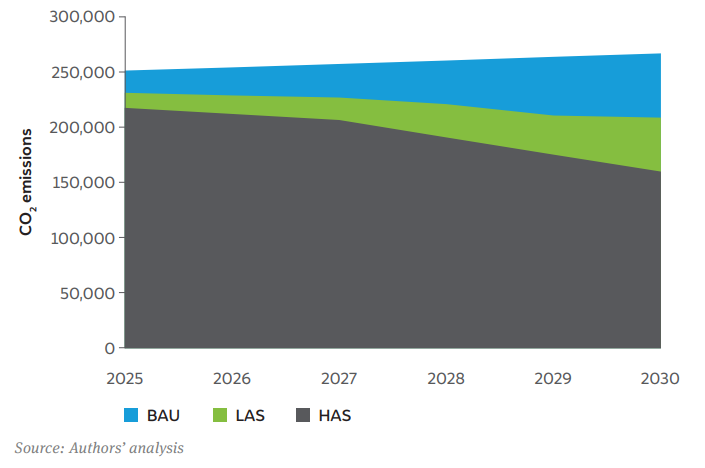
Figure 8 Under the high ambitious scenario (HAS), annual PM2.5 emissions could fall by over 60% in 2030
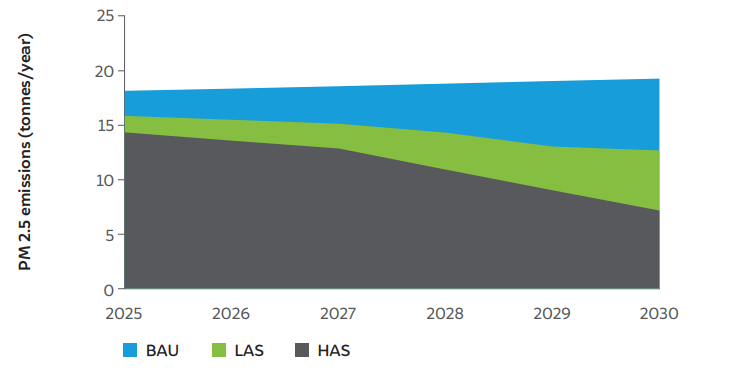
Figure 9 The high ambitious scenario (HAS) also offers the potential for reducing NOx emissions annually by more than 50% by 2030
We have used a PESTEL analysis (Political, Economic, Social, Technological, Environmental, and Legal) framework to assess the electrification potential of D2D waste collection vehicles in India. This has been established as an essential tool for electrification potential assessments (Harikumar et al. 2022). The observations highlighted in Table 4 summarise insights gathered from the analysis, market review, stakeholder interactions and review of government policies.
In addition to findings from Amritsar’s case study in section 2, the overall ecosystem presents a net positive outlook, with the benefits outweighing the drawbacks, indicating a significant potential for electrification in this segment. Cities can gain financially by electrifying this particular vehicle category, which can be facilitated through schemes/programmes such as the Swachh Bharat Mission, National Clean Air Programme, FAME, etc.
Table 4 PESTEL analysis indicates a net positive case for electrifying D2D waste collection vehicles in Indian cities
| Positives | Negatives | ||
|---|---|---|---|
| P |
|
|
P |
| E |
|
|
E |
| S |
|
N.A. | S |
| T |
|
|
T |
| E |
|
|
E |
| L |
|
N.A. | L |
Source: Authors’ compilation
The TCO analysis presented in this study indicates great economic potential in electrifying the D2D waste collection fleet, and also shows a reduction in the burden of fuel costs for city authorities. To estimate the potential of electrification in typical waste management cases, cities must estimate TCO/tonne instead of TCO/ km, as shown in Amritsar analysis. The same method can be used to select the optimal vehicle payload capacity and fuel to reap the maximum financial and environmental benefits in other similar cases of municipal operations. The analysis can be modified to estimate suitability for government vehicle segments such as postal vehicles, delivery vans, water tankers, etc. The national scenarios presented in the study demonstrate a pivotal opportunity to accelerate the EV transition in the D2D waste collection segment. Still, various interventions and innovative approaches will be required at different tiers of governance.
This was a key takeaway from the interviews with city officials and private operators. Since EVs are a new-age technology, especially when handling waste, demonstrations and pilots at the municipal level are a must and should be monitored for a certain period. The monitoring will help generate evidence to improve vehicle design and assist other ULBs in electric transition. Think tanks, NGOs, academia, etc., can help in pilot monitoring and evidence-generation stages. Cities like Chennai and Lucknow, which are in an advanced stage of operations, can create knowledgesharing platforms to assist other cities in understanding the nuances.
A data-based performance matrix must be developed to assess the effectiveness of pilots or demonstrations. Since waste management operations are distributed across municipal areas, high-potential wards/zones can be identified to run these pilots based on charging infrastructure in municipal workshops or parking locations. Such pilots and platforms can help cities identify a vehicle type suitable for D2D waste collection. A feedback mechanism from pilot EV drivers will also aid in informing future deployment decisions.
This study’s market review showed that EVs’ capital costs are comparatively higher than their ICE counterparts. India’s FAME/state-level EV policies provide incentives for three-wheeler and four-wheeler commercial segments. Only the Punjab EV policy provides incentives and a fleet electrification target for waste disposal vehicles. Along similar lines, other states can study the potential of this segment and give incentives to increase the uptake of EVs in D2D waste collection vehicles. These incentives can be provided to ULBs or concessionaires who own the vehicle fleet.
States can formulate EV transition funds focussed on accelerating their penetration in high-potential segments or government-owned vehicle fleets. Purchase incentive mechanisms can be pushed through different government schemes or programmes. For instance, the National Clean Air Programme’s city action can facilitate this EV transition through their targeted funding mechanisms. Punjab’s EV policy mentions using ‘Swachh Bharat Kosh’, i.e. funds earmarked for cleanliness- related interventions, to incentivise this EV transition.
The ULBs must analyse their current D2D waste collection fleet based on age distribution, fuel type, daily operations, etc., to develop fleet renewal and augmentation plans. These plans can have phase-wise integration of EV procurement in line with set national/ sub-national-level electrification targets. In addition, cities can set their own targets for EV penetration or emission reduction through EV integration. Since individual ULBs will slowly transition to EV technology, aggregate demand from different ULBs would be more effective in reducing costs.
The EV transition plans must outline the pilot programmes and improve the capacity-building exercises for drivers or operators. After thoroughly analysing the city’s existing business model of solid waste management and financing mechanisms, procurement strategies should be included in the transition plans. Cities must analyse their existing land bank and parking locations to strategically plan charging infrastructure for optimum utilisation of the electric D2D waste collection fleet.
Electrifying D2D waste collection vehicles through national policy pushes
As highlighted in this study, D2D waste collection has a high potential for electrification. The projections for Class-I cities show a cumulative demand of around 80,000 new vehicles by 2030. Central-level government organisations such as the MHI, MoRTH, MoHUA, etc., can push for D2D waste collection fleet transition in their electrification programmes.
Electric vehicles can also be included in MoHUA’s National SBM guidelines as a vehicle alternative. This ministry’s annual Swachh Sarvekshan ranks cities based on their waste management performance. It can reward city governments or municipal bodies that transition a specific proportion of their ICE-based D2D waste collection vehicles to EVs yearly. The Swacch Sarvekshan rankings or city scoring mechanisms can include EV penetration parameters for D2D waste collection fleets.
Ahluwalia, Isher Judge, and Utkarsh Patel. 2018. “Solid Waste Management in India: An Assessment of Resource Recovery and Environmental Impact,” April. https://think-asia.org/handle/11540/8143.
Balasubramanian, K. L. 2020. “What Will It Take to Make Chennai’s New Waste Management System a Success?” Citizen Matters, Chennai, October 14, 2020.
Bitra, Ramesh. 2024. “Revolutionizing Lucknow’s Waste Landscape Lucknow Swachhata Abhiyan’s Groundbreaking Initiatives | Resustainability.” August 2024. https://resustainability.com/blog/press-release/lucknow-swachhata-abhiya...
Clean India Journal. 2022. “Urbaser Sumeet: Game-Changers of Keeping Cities Clean.” Clean India Journal. February 16, 2022. https://cleanindiajournal.com/urbaser-sumeet-game-changers-of-keeping-ci....
CPCB. 2021. “Annual Report 2020-21 on Implementation of Solid Waste Management Rules, 2016.” Government report. New Delhi: Central Pollution Control Board.
CPHEEO. 2003. “Manual on Municipal Solid Waste Management - 2000:Central Public Health & Environmental Engineering Organisation (CPHEEO), Govt of India.” https://cpheeo.gov.in//cms/manual-on-solid-waste-management.php.
2016. “Manual on Municipal Solid Waste Management - 2016:Central Public Health & Environmental Engineering Organisation (CPHEEO), Govt of India.” https://mohua.gov.in/publication/manual-on-solid-waste-managementsystems....
Gupta, Shantanu. 2021. “Why E-Rickshaws Have Emerged a Winner in Transition to Electric Mobility Race.” Downtoearth. April 3, 2021.
Harikumar, Aravind, Anand R M, Himani Jain, and Sowmia Phillip. 2022. “India’s EV Transition: Catalysing Kochi’s Electric 3-Wheeler Market Through Local Policy.” Issue Brief. Council on Energy, Environment and Water. https://www.ceew.in/publications/electricification-strategy-of-3-wheeler...
Hindustan Times. 2022. “Now, Ludhiana’s Garbage Collectors to Scoot Door-to-Door on e-Rickshaws,” August 18, 2022. https://www.hindustantimes.com/cities/chandigarh-news/now-ludhiana-s-gar...
Itnal, Basavaraj N. 2015. “ROUTE OPTIMIZATION OF COMMUNITY SOLID WASTE MANAGEMENT IN SELECTED WARDS OF BANGALORE CITY USING GEOLOGICAL INFORMATION SYSTEM (GIS).” International Journal of Research in Engineering and Technology 04 (11): 232–38. https://ijret.org/volumes/2015v04/i11/IJRET20150411040.pdf
Jain, Aakansha, Aravind Harikumar, Palak Thakur, Promit Mookherjee, and Sugandha Pal. 2020. “Roadmap for Electrification of Urban Freight in India.” TERI. https://www.teriin.org/project/roadmap-electrification-urban-freight-india
Joshi, Vishwas, Abhishek Sharma, and Devendra Kumar. 2021. “Optimization Model for Collection and Transportation of Municipal Solid Waste in Jaipur City.” Science & Technology Asia, December, 134–42.
Kumar, Akhilesh, and Avlokita Agrawal. 2020. “Recent Trends in Solid Waste Management Status, Challenges, and Potential for the Future Indian Cities – A Review.” Current Research in Environmental Sustainability 2 (December):100011.
Meena, M. D., M. L. Dotaniya, B. L. Meena, P. K. Rai, R. S. Antil, H. S. Meena, L. K. Meena, et al. 2023. “Municipal Solid Waste: Opportunities, Challenges and Management Policies in India: A Review.” Waste Management Bulletin 1 (1): 4–18. https://www.sciencedirect.com/science/article/pii/S2949750723000056?via%...
MoEFCC. 2023. “NCAP.” 2023. https://prana.cpcb.gov.in/#/home
NITI Aayog. 2021. “Waste-Wise Cities: Best Practices in Municipal Solid Waste Management | NITI Aayog.” NITI Aayog. https://www.niti.gov.in/node/362
Pujara, Yash, Janki Govani, Harshit T. Patel, Pankaj Pathak, Deepak Mashru, and P. Sankar Ganesh. 2023. “Quantification of Environmental Impacts Associated with Municipal Solid Waste Management in Rajkot City, India Using Life Cycle Assessment.” Environmental Advances 12 (July):100364.
Sharma, Bhupendra K., and Munish K. Chandel. 2019. “Emissions Associated with the Transportation of Municipal Solid Waste in Mumbai.” In Advances in Waste Management, edited by Ajay S. Kalamdhad, Jiwan Singh, and Kondusamy Dhamodharan, 437–44. Singapore: Springer Singapore. https://link.springer.com/chapter/10.1007/978-981-13-0215-2_31.
Sharma, Kapil Dev, and Siddharth Jain. 2019. “Overview of Municipal Solid Waste Generation, Composition, and Management in India.” Journal of Environmental Engineering 145 (3): 04018143.
Singh, Mansi, Madhulika Singh, and Sunil K. Singh. 2024. “Tackling Municipal Solid Waste Crisis in India: Insights into Cutting-Edge Technologies and Risk Assessment.” Science of The Total Environment 917 (March):170453. https://www.sciencedirect.com/science/article/abs/pii/S0048969724005904?...
Tewari, Shailshree. 2021. “Why India’s Solid Waste Management System Needs a Digital Overhaul.” Down To Earth (blog). February 25, 2021.
The Hindu. 2019. “Electric Vehicles to Collect Waste,” August 14, 2019, sec. Coimbatore. https://www.thehindu.com/news/cities/Coimbatore/electric-vehicles-to-col...
2020. “CM Launches Solid Waste Management Project in 7 Zones,” September 30, 2020, sec. Tamil Nadu. https://www.thehindu.com/news/national/tamil-nadu/cm-launches-solid-wast...
The Newsminute. 2021. “CM Jagan Launches Clean AP Scheme, 4,000 New Garbage Collection Vehicles Flagged off | The News Minute,” March 10, 2021.
Times of India. 2022. “Surat Municipal Corporation to Use 300 E-Tempos for Waste Collection in City.” The Times of India, March 26, 2022.
Tirpude, Saket, Ankit Bharadwaj, Rama Sundaram, Sidhartha Mane, and Rajesh M. Holmukhe. 2020. “An Investigation into Awareness and Usage of Lead Acid Batteries in E-Rickshaws: A Field Survey in New Delhi.” Indian Journal of Science and Technology 13 (33): 3467–83. https://indjst.org/articles/an-investigation-into-awareness-and-usage-of....
TNIE. 2017. “State Government Launches Electric Vehicles for Garbage Disposal.” The New Indian Express, November 7, 2017. https://www.newindianexpress.com/cities/vijayawada/2017/Jul/11/state-gov...
UITP. 2022. “Rickshaws, Three-Wheelers and Vans; Electrifying India’s Paratransit through Amritsar’s RAAHI Project.” UITP (blog). January 27, 2022. https://www.uitp.org/news/rickshaws-three-wheelers-and-vans-electrifying...
Velumani, A. 2013. “GIS Based Optimal Collection Routing Model for Municipal Solid Waste: Case Study in Singanallur, India.” In . https://www.semanticscholar.org/paper/ GIS-based-Optimal-Collection-Routing-Model-for-CaseVelumani/dbec3f15cf0fbef0a4e98012884b6a277f3ac0b6.
Urban Local Bodies (ULBs) in India mostly use light commercial vehicles, including three-wheelers and four-wheelers, for door-to-door waste collection. The typical payload capacity of these vehicles ranges from 350 kg to 1000 kg. These vehicles are part of the ‘primary waste collection’ process, collecting waste from residential and commercial areas and transporting it to transfer stations, where larger vehicles carry the waste further to landfills or waste facilities.
Depending on the city size and vehicle fleet, these vehicles operate between 15 and 60 km daily. They follow fixed routes and park in designated municipal parking areas. They also operate at regulated speeds to manage waste collection effectively.
According to guidelines by the Ministry of Housing and Urban Affairs (MoHUA), one waste collection vehicle should be assigned to every 1000 to 1500 households. For example, in our case study in Amritsar, there was a fleet of 200 waste collection vehicles, while based on the city's household size, approximately 220 vehicles should be in service. India will require 80,000 new door-to-door waste collection vehicles by 2030.
Municipal waste transportation annually emits around 67 thousand tonnes of CO2, 613 tonnes of NOx, and 100 tonnes of Particulate Matter (PM) in cities such as Mumbai. Moreover, the majority of waste collection vehicles in India operate on diesel, and electrifying them would immediately reduce tailpipe emissions and provide huge financial benefits for urban local bodies. For example, our study shows that electrifying the door-to-door waste collection vehicles in Amritsar could save INR 50-70 lakh in fuel costs.
How States can Build Capacity for Urban Mobility Officials:
Can Indian Highways Support Zero-Emission Trucking?
India On The Move:Stories of people driving the bus sector
How can India Accelerate Electric Three-wheeler Adoption?