Council on Energy, Environment and Water Integrated | International | Independent
Suggested Citation: Jha, Anannya, Divyanshu Yadav, Aditya Swarankar, Saoni Sanyal, Krishna Khanna, and Himani Jain. 2025. India’s E-bus Initiatives: Job Creation, Adoption Challenges, and Policy Pathways. New Delhi: Council on Energy, Environment and Water.
India’s bus sector plays a vital role in providing mobility for millions, yet it remains dependent on diesel fuel, which accounts for over 90 per cent of annual bus sales. Against this backdrop, the transition to electric buses (e-buses) is emerging as a key driver of sustainable transport, reducing dependence on imported fuel while cutting urban pollution. The study, India’s E-bus Initiatives: Job Creation, Adoption Challenges, and Policy Pathways, highlights how e-buses can transform the sector by generating new jobs, catalysing domestic manufacturing, and improving air quality.
Drawing on market trends, employment projections, and eight detailed case studies, the report explores how innovative solutions - from decentralised depot planning and efficient usage of degraded batteries to gender-inclusive workforce policies - are shaping the early phase of bus electrification in India. It highlights both the opportunities and areas for improvement and emphasises the need for supportive policies and infrastructure investment to further accelerate adoption. The findings point to a decisive moment for India’s mobility future, where coordinated and comprehensive action can ensure e-buses become central to inclusive, reliable, and clean transport.
Our previous studies note that lack of public charging, high upfront costs, uncertainty around battery life, and range anxiety remain key challenges to deploying electric buses in India (Khanna et.al. 2024). From a pool of 20 key e-bus innovative initiatives, eight select case studies with thematic diversity, geographic distribution, and reliable data are chosen. The team collates site observations and 4-5 in-depth interviews at each case study to validate the solution and its impacts.
Although e-buses are set to transform India's bus sector, the sector is still in its nascent stages and faces several barriers. Coordinated efforts are needed to catapult technology adoption. Thus, we suggest three key recommendations to strengthen this nascent sector.
Buses are an integral mode of transport for Indian road users, with nearly 390 million daily commuters depending on different types of bus services (Gadepalli 2024). Diesel buses dominate the market, accounting for nearly 95 per cent of yearly (more than 90,000) units sold (Vahan Dashboard n.d.). As per the latest all-India survey on diesel and petrol sales, buses accounted for approximately 10 per cent of the total diesel consumption in the country (MoPNG 2014), contributing significantly to India’s oil imports. In contrast, merely 9,700 electric buses (e-buses) have been registered in the last decade. The e-bus market is growing at a compound annual growth rate (CAGR) of ~65 per cent, with sales driven by e-bus programmes and government incentives.
E-buses have the potential to influence India’s energy security objectives while meeting its decarbonisation and pollution mitigation efforts. The study analyses evolving bus market trends of use cases, regional sales, fuel choice, and manufacturers. To identify the future potential for bus electrification, we estimate the bus stock and sectoral jobs by 2047 under a business-as-usual (BAU) scenario and its likely fuel split. We identify learnings, challenges, and opportunities from the country’s early e-bus initiatives through eight case studies.
Buses will continue to serve nearly one-fourth of the Indian population (457 million or 45.7 crore passengers) daily in 2047 in the BAU case. CEEW’s Transportation Fuel Forecasting Model (TFFM) forecasts that 3.34 million (33.4 lakh) buses will be on-road1 by 2047 in the BAU scenario.
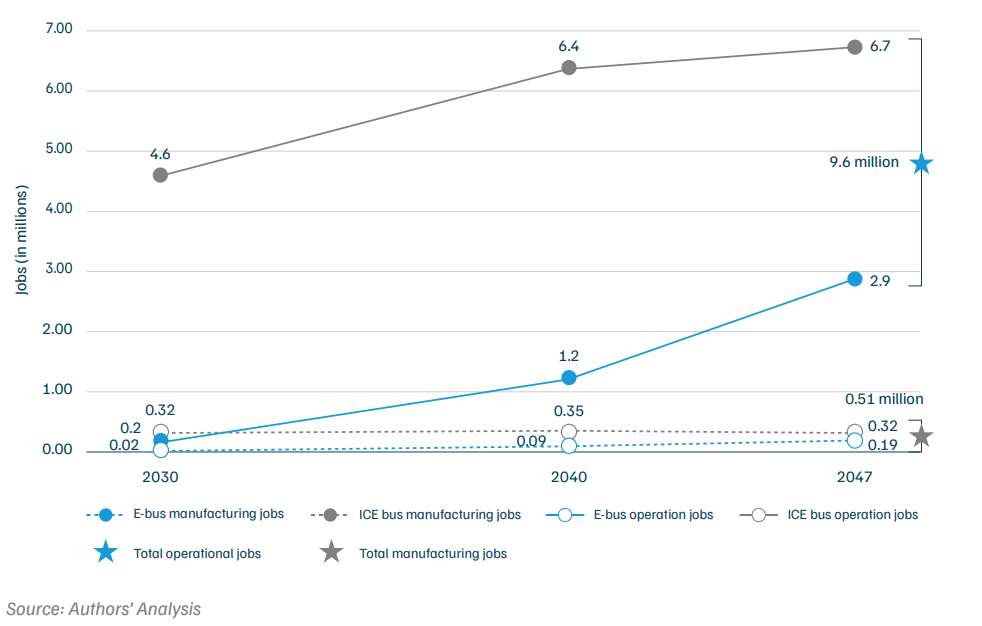
We find that, on average, the demand for 1 additional bus creates approximately 4-5 new jobs in the market. Therefore, we estimate that the bus ecosystem will generate approximately 10.1 million (1.01 crore) jobs by 2047, with 95 per cent of these jobs in operations and 5 per cent in manufacturing.
Figure ES1. The bus sector is projected to generate approximately 9.6 million operational jobs and 0.51 million manufacturing jobs by 2047
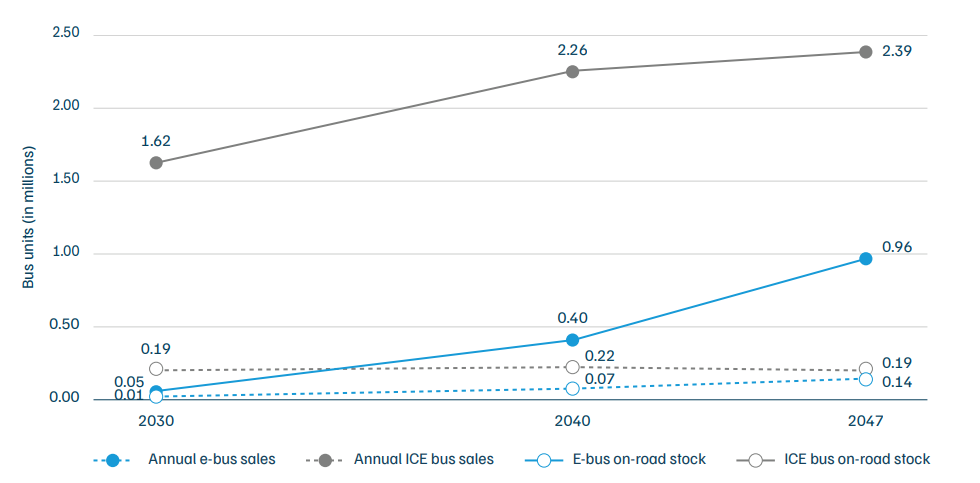
We estimate that, under a business-as-usual (BAU) scenario, e-buses will account for 42 per cent of annual sales by 2047.
To leapfrog the benefits accrued to e-bus adoption and to catapult the e-bus markets, there is an urgent need to address existing barriers and accelerate their adoption.
Our previous studies note that lack of public charging, high upfront costs, uncertainty around battery life and range anxiety remain key challenges to deploying electric buses in India (Khanna et.al. 2024). We identified a pool of 20 case studies where specific initiatives have been undertaken to tackle such challenges on the ground. From this pool, eight case studies were selected based on multiple criteria, including thematic diversity, geographic distribution, availability of reliable data for analysis, and necessary permissions from local stakeholders (Table ES1). The team spent 5-7 days at each case study site, collating site observations and conducting 4-5 in-depth interviews to validate the solution and its impacts.
Table ES1. Key e-bus initiatives in India (2018–2025) that are developing innovative solutions to address sectoral challenges
Source: Authors’ compilation
Although e-buses are set to transform India’s bus sector, the sector is still in its nascent stages and faces several barriers that require strategic solutions and targeted policies. Coordinated efforts are needed to catapult technology adoption. Thus, we suggest the following three-pronged approach to strengthen this nascent sector.
The study presents strategic and innovative cases that feature solutions to deal with e-bus deployment and operational challenges. We plan to further deep-dive into high-potential use cases over their life to document and study in detail various aspects, including battery cycles, degradations, and viable financial and operational models. While documenting case studies supplies adequate data and real-life situations to recalibrate financial and operational models, addressing these issues will require coordinated efforts from national and state governments, transit agencies, OEMs, and service providers.
Transportation is the backbone of economic development and social welfare, connecting communities, jobs, education, and essential services (Kaiser and Barstow 2022). In India, buses play a fundamental role in providing this connectivity by ferrying approximately 16 per cent of the country’s workforce (Census 2011). As the Indian economy grows and cities expand rapidly, ecological concerns are intensifying (Nagendra et.al. 2013). Therefore, efficient, flexible, and resilient bus-based public transport has become an urgent need.
In 2014, buses accounted for nearly 10 per cent of the total diesel consumption in the country (MoPNG 2014), contributing significantly to India’s oil imports. However, according to the government-set Service Level Benchmarks (SLBs), cities should have at least 600 buses per million population (60 buses per lakh) to boost the use of public transport and reduce private transport use (MoHUA n.d.), which consumes almost 95 per cent of the petrol and 13 per cent of the total diesel imported (MoPNG 2014). Most mega-cities in India, excluding Bengaluru, have around 200-400 buses per million (20–40 buses per lakh), highlighting a significant gap nationwide (ITDP 2022). Thus, there is an urgent need to expand bus-based public transport while reducing buses’ overall reliance on fossil fuels.
Initiatives like the National Electric Mobility Mission Plan (NEMMP) launched in 2013, the Faster Adoption and Manufacturing of Hybrid and Electric Vehicles (FAME) schemes (2015-2024), and the PM-eBus Sewa scheme 2023, reflect the government’s strong commitment to a clean energy transition. These schemes have helped increase the deployment of intra-city buses since 2015. By 2024, India had registered 9,714 electric buses (e-buses), with a compound annual growth rate (CAGR) of over 65 per cent. However, internal combustion engine (ICE) buses, i.e., those that run on fossil fuels, still dominate the ecosystem, with diesel and CNG buses accounting for 93.5 per cent and 4.9 per cent, respectively, of the total buses registered in 2024 (Vahan Dashboard n.d.).
The continued prevalence of several challenges in e-bus operations, such as a lack of public charging infrastructure on highways and transit hubs (Sharma 2023; Khurana 2024), long charging times, high upfront costs for private operators, and limited access to subsidies (Kohli and Gowande 2024), explain their limited uptake. Also, concerns regarding battery longevity and replacement expenses, challenges related to driving range (Bharadwaj 2023), insufficient expertise within the maintenance network, and the minimal profitability of longer trips under 400 km of daily vehicle usage further impede the use of e-buses for inter-city journeys (Khanna et al. 2024).
E-buses are set to alter the landscape of the bus sector in India. However, the transition is still in a nascent stage, and original equipment manufacturers (OEMs) and operators are focusing on developing innovative solutions to solve prevailing barriers and are undertaking bold pilots to overcome them. Therefore, it is crucial to understand these unique initiatives and assess their impact.
Chapter 2 provides an overview of the e-bus sector, its market contours, and its estimated future trajectory compared to ICE buses. We discuss the potential for job creation within the e-bus sector and future e-bus trends in Chapter 3. Chapter 4 features eight unique e-bus cases from different geographies. These case studies document innovative bus electrification efforts by city transport undertakings (CTU) and private operators, highlighting the innovative solutions developed to solve local challenges and the key learnings in operations, infrastructure, and workforce management. The report concludes with findings and conclusions gathered for bus OEMs, operators, and policymakers.
The methodology for this report involves a multi-faceted structure for the three sections.
Buses in India account for approximately 40 per cent of road-based travel demand, measured in passenger kilometres travelled (TERI 2024). The Indian bus market, considered the third-largest in the world (MoRTH 2023), is projected to reach a value of USD 11.8 billion (INR 1.04 lakh crore) by 2026, with a CAGR of over 6.36 per cent for public buses operated by state transport undertakings (STUs) and 7.37 per cent for private buses (Grant Thornton Bharat 2024). The sector encompasses various use cases, including public, private, and institutional operations.
Source: Authors’ compilation
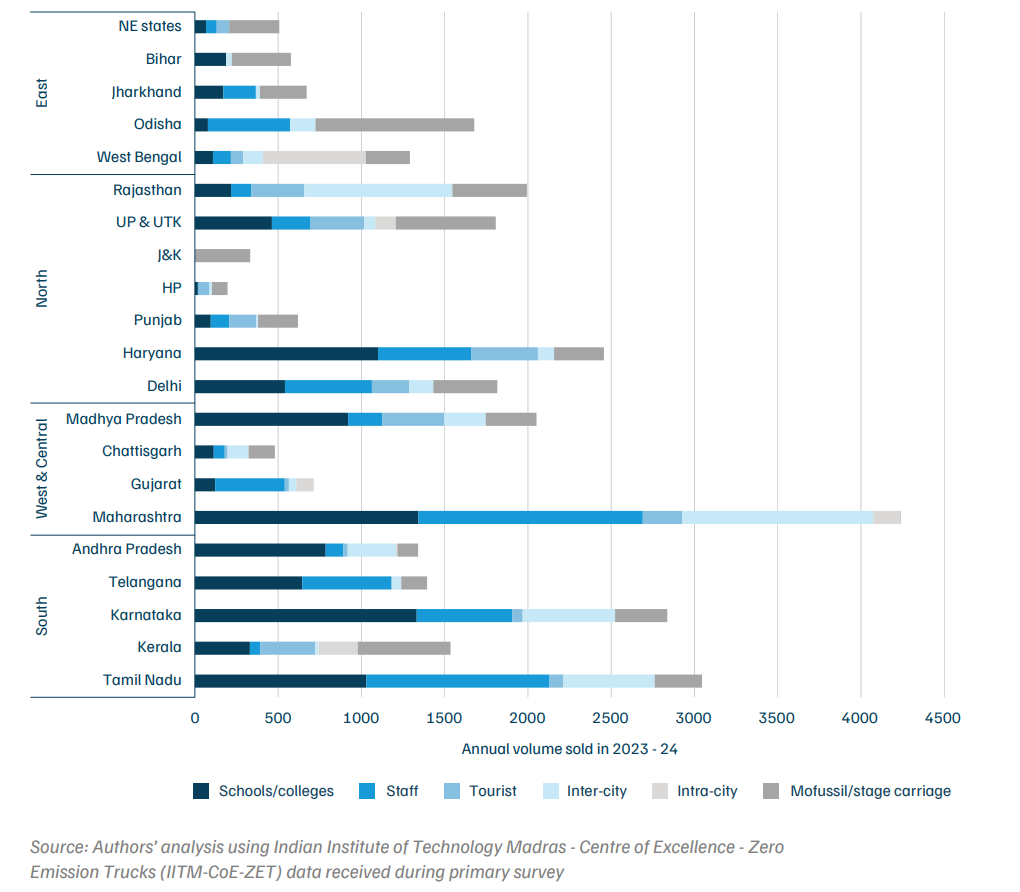
Figure 1. School/college buses, staff buses, and mofussil buses comprised nearly three-fourths of bus operations in 2023–24
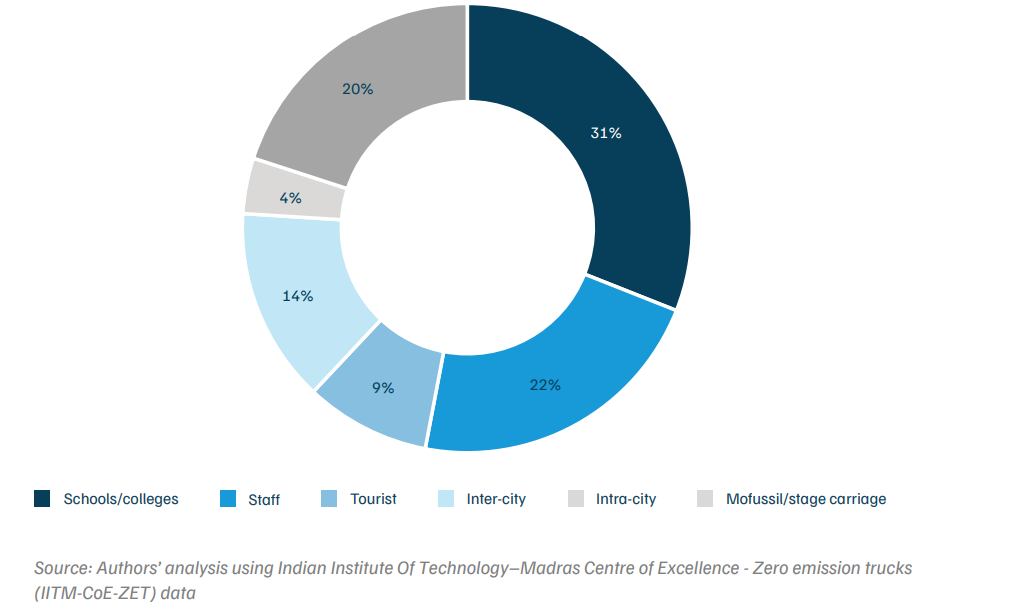
Sales data for 2023–24 (Figure 1) indicate that school/college buses remain the most common use case, followed by staff buses and mofussil/stage carriage buses. The data highlight geographic variations across states in terms of bus volumes (Figures 2 and 3). Around 52 per cent of all buses registered in 2023–24 were concentrated in six states: Maharashtra (13.4%), Tamil Nadu (9.6%), Karnataka (9%), Haryana (7.8%), Madhya Pradesh (6.5%) and Rajasthan (6.3%). Approximately 60 per cent of school, college, and staff buses are registered in the South and Central-West regions of the country, with Maharashtra, Tamil Nadu, Karnataka, and Haryana being the leading states. In contrast, nearly 75 per cent of all tourist buses are concentrated in North and Central-West India, with Haryana, Uttar Pradesh, Rajasthan, and Madhya Pradesh emerging as the dominant states in this segment.
Figure 2. Maharashtra records the highest medium-and heavy-duty ICE and e-bus registrations in India (2001–2024)
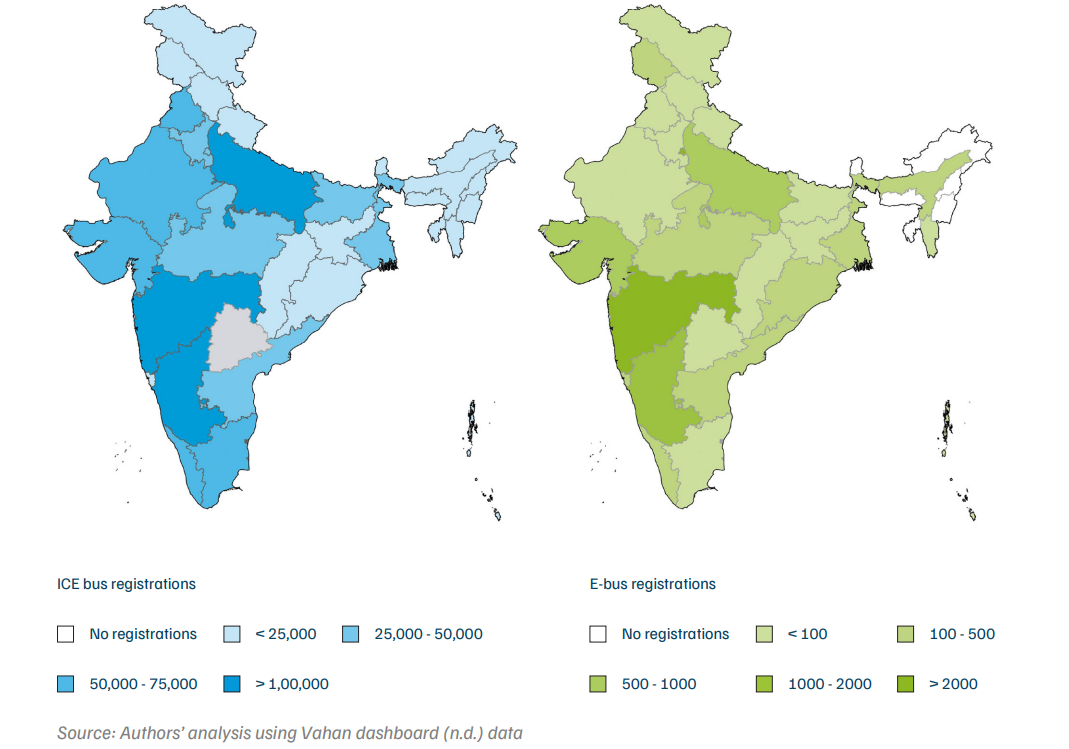
Figure 3. High variations in bus volume and use cases are observed across states and regions in India
India’s bus market, marked by dynamic changes in technology, policy, and environmental initiatives, is transforming. Our analysis of historical registration data for light6 (LDV), medium7 (MDV), and heavy8 (HDV) duty buses reveals that the market is dominated by diesel vehicles. However, over the past 15 years, the bus market has experienced a clean-tech transition, with annual e-bus sales rising from fewer than 5 units before 2015 to 4,025 units sold in 2024 (Figure 5).
Figure 4. The proportionate market of LDV, MDV and HDV buses has continuously increased post-COVID
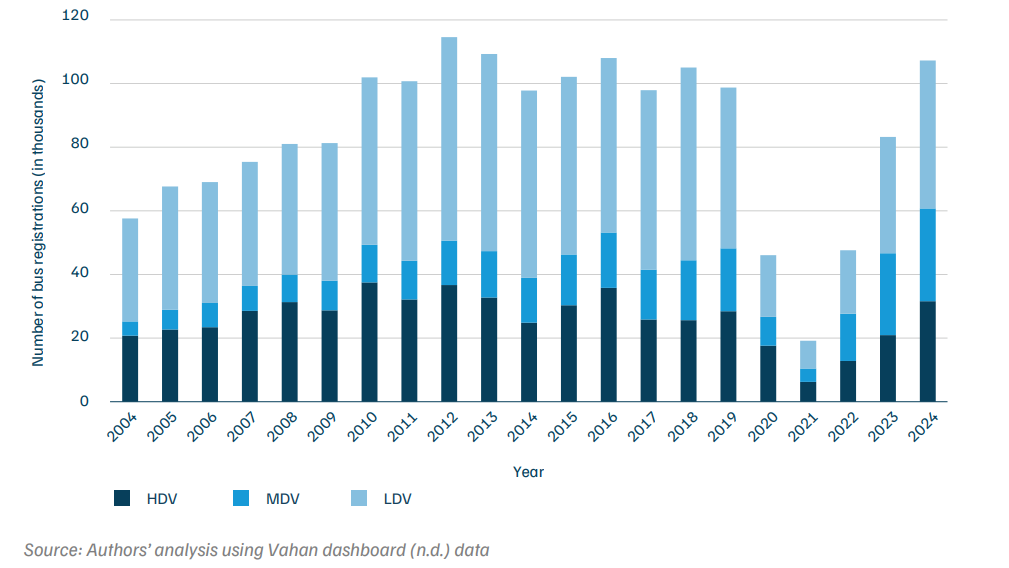
India has been a market of about 0.1 million (one lakh) new buses every year since 2010. The bus market suffered notably during COVID-19, between the years 2020 and 2022, but bounced back in 2024 (Figure 5).
Figure 5. The bus market recovered fully in 2024 from the COVID impact, reaching one lakh registrations per year
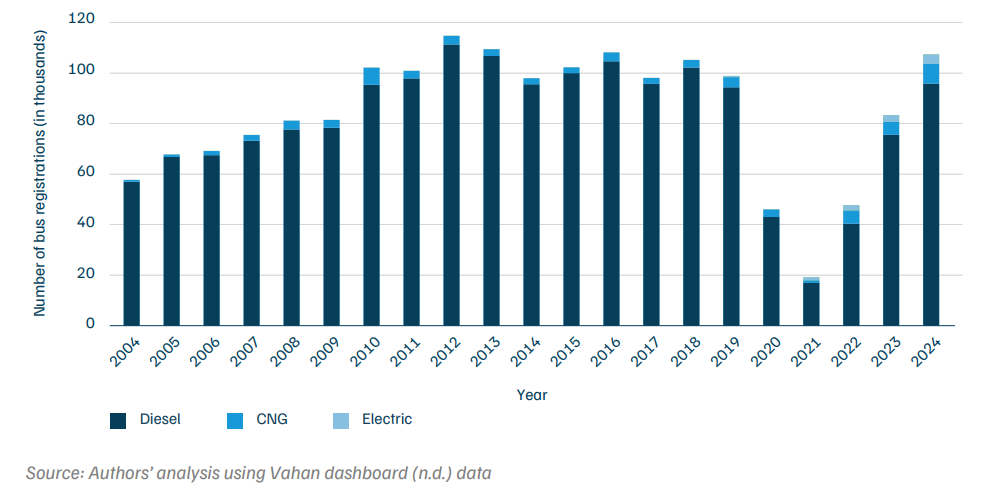
Figure 6. The number of original equipment manufacturers providing electric variants has rapidly increased since national e-bus schemes were announced post-COVID
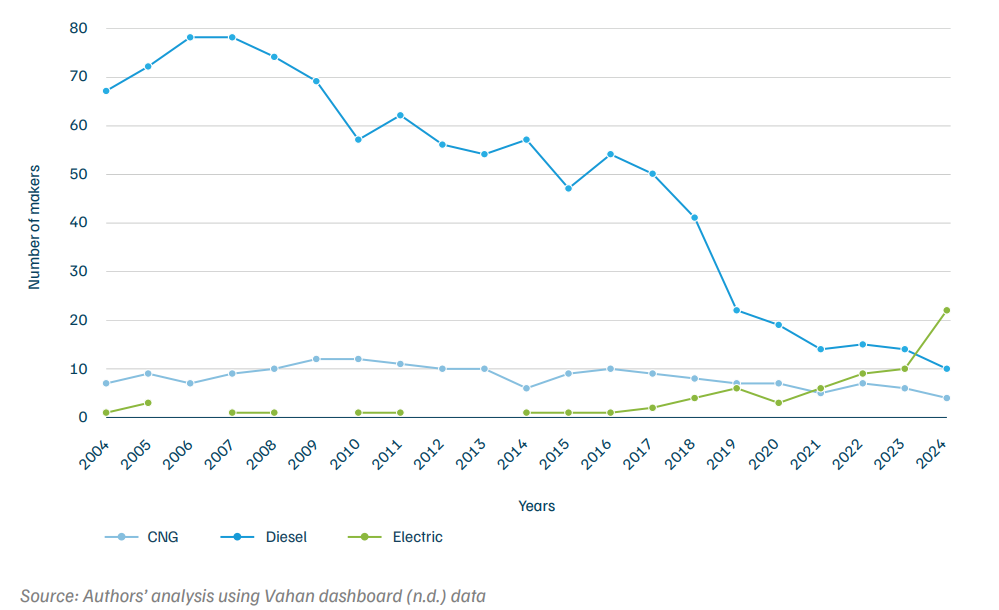
Backed by the success of the government’s 2021 Product-linked Incentive (PLI)-Auto scheme, by 2024, the number of bus makers (OEMs) producing e-buses surpassed those producing diesel buses for the first time (Figure 6). An analysis of bus registration data and companies highlights that traditional ICE bus manufacturers are shifting to e-bus manufacturing. Also, several newer OEMs are trying to gain e-bus market share.
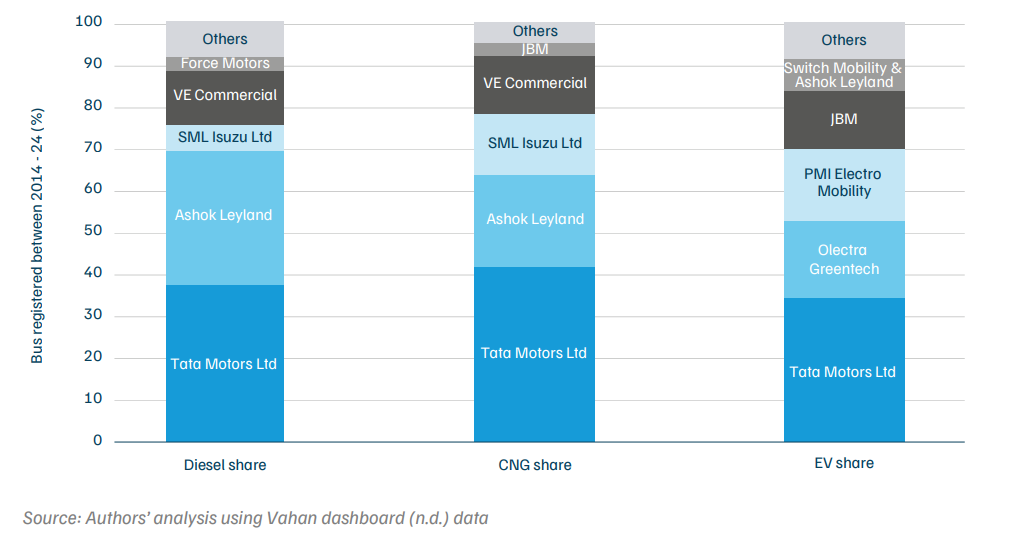
A comparative analysis of the Indian bus market over the last 10 years (2014–2024) shows that there are around 0.85 million (8.56 lakh) diesel buses operational in India produced by more than 152 manufacturers. Conversely, the CNG bus market has experienced a fairly modest uptake, with approximately 40,000 units sold by 16 manufacturers. However, in contrast to their ICE counterparts, more e-bus makers are entering the market year-on-year (Figure 6). Our study indicates that the Indian bus market is fairly consolidated, with the top five companies dominating 91.3 per cent of registrations across the three fuel types (Figure 7). However, newer OEMs have managed to capture a significant market share (approximately 30 per cent) of e-bus demand.
Figure 7. Indian bus market is fairly consolidated, with top five companies dominating 91.3% of registrations across the three fuel types
India has also emerged as the second-largest exporter of e-buses globally. Between March 2023 and February 2024, India shipped 1,529 e-buses, recording annual growth of 80 per cent despite a decline in February 2024 (Volza Grow Global 2024). Key destinations include Vietnam, the United States, Nigeria, and the UAE, reflecting India’s expanding global footprint in the e-bus market.
Government initiatives like the National Electric Mobility Mission Plan (NEMMP), the Faster Adoption and Manufacturing of Hybrid and Electric Vehicles (FAME) schemes, the PM-eBus Sewa scheme, and state subsidies have led to the deployment of thousands of e-buses across India. Convergence Energy Services Limited (CESL), a green energy focused venture of The EESL Group owned by central public sector undertakings under the Ministry of Power, New and Renewable Energy, has established centralised bulk e-bus procurement tenders for cities and states, ensuring that manufacturers can secure medium-term supply orders that provide exact bus specifications through aggregation, removing the need for individual contract negotiations with cities. In turn, cities enjoy lower costs due to economies of scale and collective negotiation powers, which aid in streamlining business models, contract clauses, and performance benchmarks. This has helped reduce public investments for STUs procuring e-bus assets, increased the pace of the EV transition at the city and state level, and enabled quicker investment recovery for OEMs.
Electric buses reduce operating costs by 31 per cent and 18 per cent, respectively, when compared to traditional diesel and CNG buses (CESL 2022). As the share of e-buses increases in fleets, CTUs’ reliance on fossil fuels has reduced. E-buses are thus helping reduce emissions from bus fleets, enhancing air quality in urban areas.
Many Indian cities have started making e-buses as part of their fleet. Delhi, the second-most populous megacity in the world (UN Report 2018), has emerged as a leader in e-bus adoption, with approximately 2,000 e-buses in operation in December 2024, and an additional 1,000 e-buses planned to be made operational by March 2025 (Hindustan Times 2025). Under the Grand Challenge Phase-II tender, the Government of the National Capital Territory of Delhi (GNCTD) plans to procure 6,380 more e-buses, increasing their share in Delhi’s fleet from just 2 per cent in 2022 to an ambitious 70 per cent by 2025 (DDC-D et al. 2022). Beyond Delhi, several Indian cities and eco-sensitive zones have made e-buses part of their tourism plan.
These efforts across multiple geographical regions and use cases have strengthened confidence among state and local governments in adopting e-bus fleets to support their decarbonisation efforts.
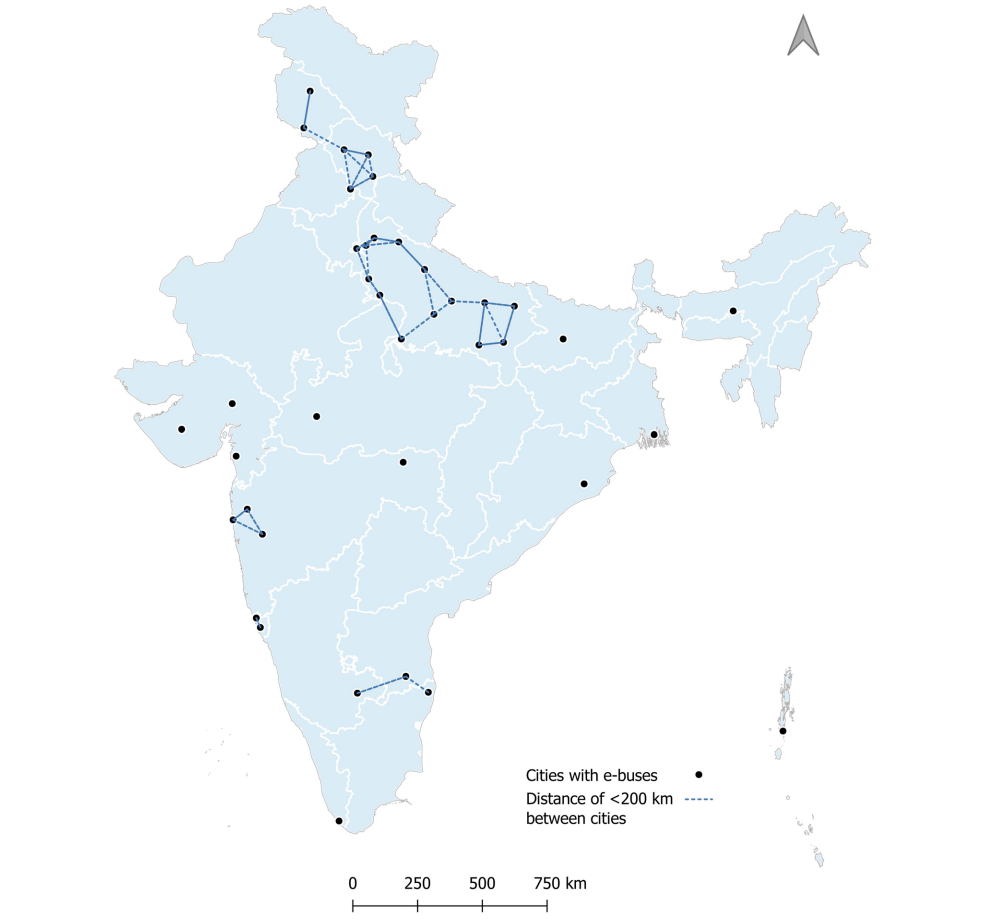
An analysis of e-bus registrations (Figure 8) highlights the geographical variation across the country. Bus registration data from 2014–2024 at the regional transportation office (RTO) level highlights that e-bus adoption remains concentrated in a few state capitals and large urban agglomerations in Uttar Pradesh, Maharashtra, Gujarat, Delhi, and Himachal Pradesh. Except for Assam and Mizoram, other states in the Northeast are yet to procure e-buses. We find that most of the other states have fewer than 500 e-buses.
Figure 8. E-bus penetration remains consolidated across urban hubs (2014–2024)
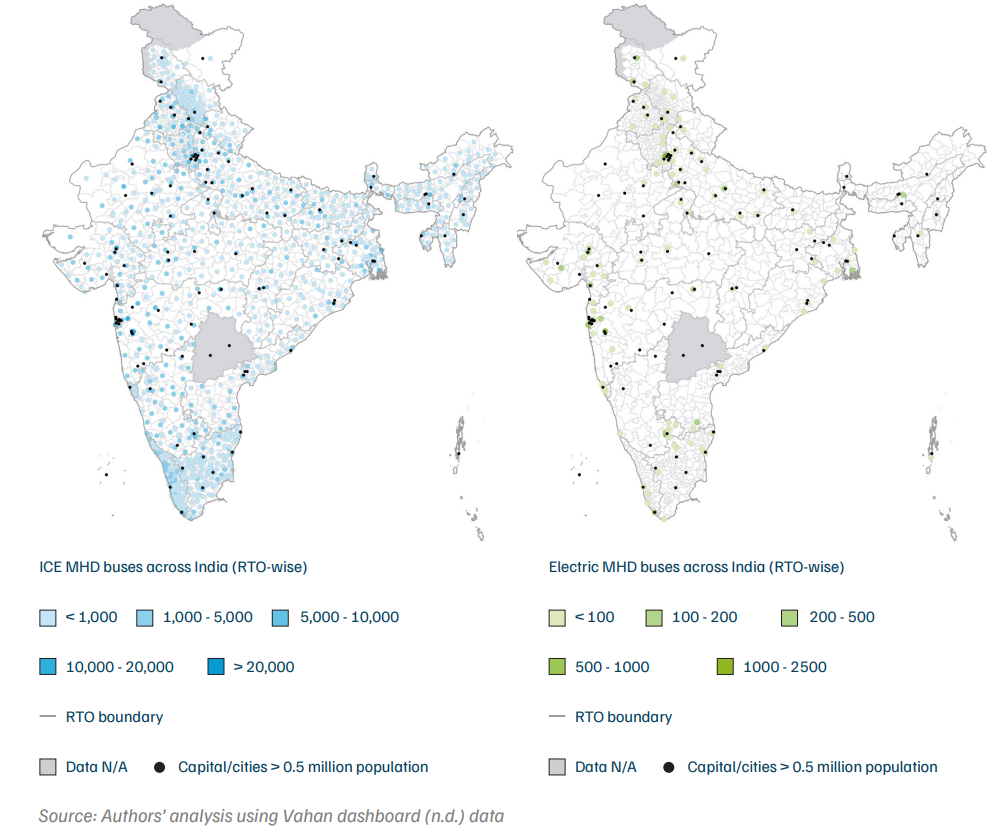
Table 1. Delhi’s regional transport office (DL51) recorded the highest ICE bus registrations between 2014 and 2024, followed by Pune (MH12) and Gandhinagar (GJ18)
Source: Authors’ analysis using Vahan dashboard (n.d.) data
Table 2. Delhi’s regional transport office (DL00) recorded the highest e-bus registrations between 2014 and 2024, followed by Bengaluru South (KA5) and Pune (MH12)
Source: Authors’ analysis using Vahan dashboard (n.d.) data
CEEW’s TFFM projects vehicle sales, refuelling infrastructure, and fuel demand in the transport sector till 2050. It forecasts the growth of vehicle stock using the Gompertz function, informed by local GDP, population growth, and historical vehicle sales trends (2001–2023). The model allocates fuel-technology decisions for new vehicles sold based on the total cost of ownership9 (TCO), refuelling infrastructure constraints, and overall sentiments/perceptions obtained from Delphi; details can be found in Annexure 1. The model uses vehicle sales trends from 2013 to 2019, backed by comprehensive discussions with industry leaders, government stakeholders, and specialists, to ensure consistency with real-world situations and industry plans. We adopt the vehicle sales projections and fuel technology choice decisions for the next 20 years from the TFFM model.
The TFFM findings project that the on-road bus stock across the country will increase to approximately 3.34 million (33.4 lakh) buses by 2047. Diesel buses will likely continue to lead the market with around 2.87 million (28.7 lakh) buses, representing 71 per cent of the overall bus stock. In this timeframe, electric and hydrogen fuel cell electric buses (HFCEVs) may collectively account for a significant 29 per cent share.
Our analysis predicts a projected CAGR of around 10.7 per cent for the e-bus market between 2025 and 2047, indicating that India’s e-bus market is poised for rapid expansion. Beyond the environmental benefits, e-buses will also create new job opportunities in the market.
Buses remain the only crucial means of affordable mobility for several million households in India. E-buses are poised to not only alter the market landscape but also reset public transport perceptions due to their comfort, attractiveness, and popularity. We explore the potential for manufacturing and operational job creation in the sector and its capacity to provide livelihoods across India.
The Ministry of Skill Development and Entrepreneurship estimates that the EV industry could generate 10 million (1 crore) direct jobs and 50 million (5 crore) indirect jobs by 2030 (Economic Survey 2023). These jobs span various domains, including the supply chain, operations, analytics, design, and research and development.
As per the Economic Survey 2025, India’s automobile industry recorded a 12.5 per cent domestic sales growth in FY24, with the passenger vehicle (bus) segment growing 4.2 per cent between April and November 2024.
Our TTFM estimates that there were 1.1 million (11 lakh) on-road buses in 2024, which will rise to 1.65 million (16.5 lakh) buses and 3.3 million (33 lakh) buses by 2030 and 2047, respectively. Using these figures, we forecast pre-procurement (manufacturing) and post-procurement (operational) jobs associated with bus operations. It is crucial to note that the exercise uses domestic bus stock demand to assess the jobs generated; hence, this study does not consider manufacturing jobs generated due to the export of buses produced domestically or those lost due to the import of buses.
Estimated jobs in manufacturing
The bus manufacturing sector in India comprises light passenger vehicles (LPVs), medium passenger vehicles (MPVs), and heavy passenger vehicles (HPVs). Using CEEW’s TFFM annual bus fleet registration forecasts, we estimate the potential increase in manufacturing jobs (Table 4) using the coefficients presented in Table 3. Job coefficients from the European Union (EU) have been used, as the number of buses sold in the EU market is comparable to that in India.
Table 3. Job coefficient per unit for bus manufacturing
Source: Boston Consulting Group. 2023. Impact Assessment of the Transition to Zero-Emission Trucks in Europe. Transport and Environment
Table 4. Estimated manufacturing jobs till 2047 (in millions)
Source: Authors’ analysis
Figure 9. E-bus manufacturing jobs are expected to have steady growth while ICE bus manufacturing will stagnate
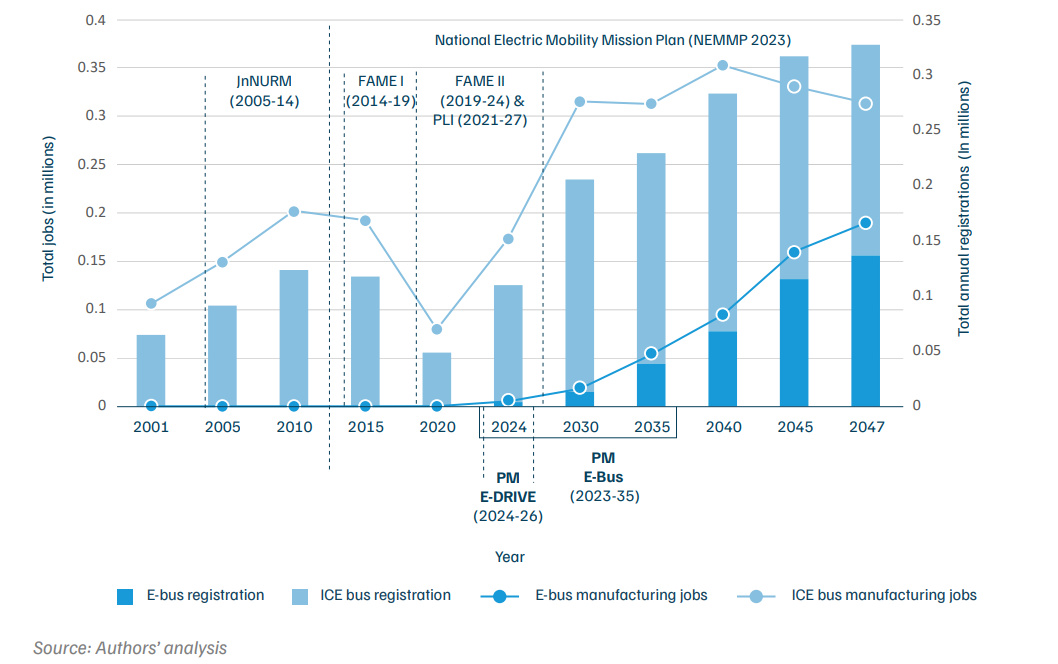
Based on the TFFM bus stock, we estimate that the bus sector will generate 0.34 million (3.4 lakh) manufacturing jobs by 2030, and 0.45 million (4.5 lakh) and 0.51 million (5.1 lakh) manufacturing jobs by 2040 and 2047, respectively. The study estimates that e-bus adoption will create approximately 0.02 million (0.2 lakh) manufacturing jobs by 2030, 0.09 million (0.9 lakh) by 2040, and 0.19 million (19 lakh) manufacturing jobs by 2047. This growth underscores the significant employment potential of the e-bus sector, contributing to sustainable development and the clean energy transition. Our analysis shows that the demand for buses in the domestic market will rise rapidly. Annual bus registrations are projected to increase from approximately 0.1 million (1 lakh) in 2024 to around 0.3 million (3 lakh) by 2047. Between 2025 and 2030, ICE buses will see a steep increase in demand (Figure 9), due to their lower capital costs and lower TCO for widespread use cases, such as school and staff buses, where bus utilisation is lower than 200 km a day. Although ICE bus registrations are expected to peak in 2040, the demand for e-buses will continue to show sustained growth till 2047, backed by the reducing TCO and improving access to charging infrastructure.
According to the literature, in a mature zero-emission truck market, manufacturing jobs will be distributed as follows: suppliers (41 per cent), OEMs (42 per cent), zero-emission vehicle (ZEV) infrastructure (2 per cent), and medium- and heavy-duty vehicle (MHDV) related utilities (15 per cent) (Figure 10). The supply chain is expected to account for a significant share of the jobs created due to the extensive workforce requirements of component manufacturing, including battery cells, power electronics, and drive systems. OEM jobs include those related to vehicle assembly, integration, and quality control. Jobs in the ZEV infrastructure segment will be critical for charging network deployment, and employment in MHDV-related utilities are looking to expand the supply of renewable energy (BCG 2023).
Figure 10. E-bus manufacturing jobs are projected to grow at 13.3% CAGR by 2047, driven by rising supplier and bus OEM jobs
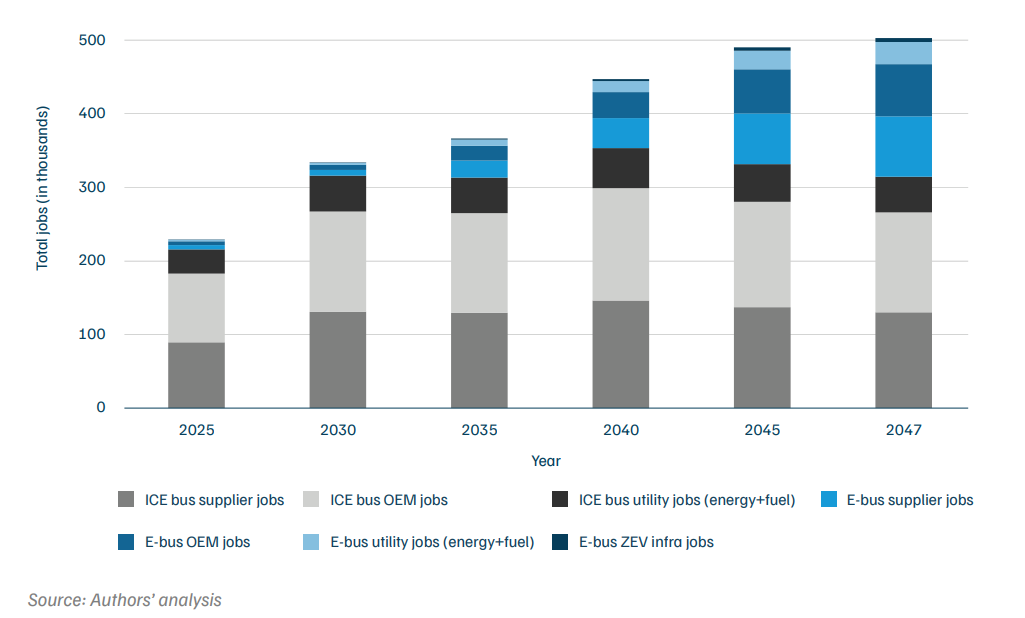
According to our research, jobs in the e-bus supply chain are expected to rise significantly—from approximately 6,000 in 2025 to 82,000 by 2047. In contrast, employment in the ICE bus supply chain is projected to grow at a steadier pace, from about 90,000 in 2025 to nearly 130,000 by 2047, driven by continued demand for new buses. However, the distribution of employment in utility sectors is expected to change at similar pace for both the fuel type over the same period.
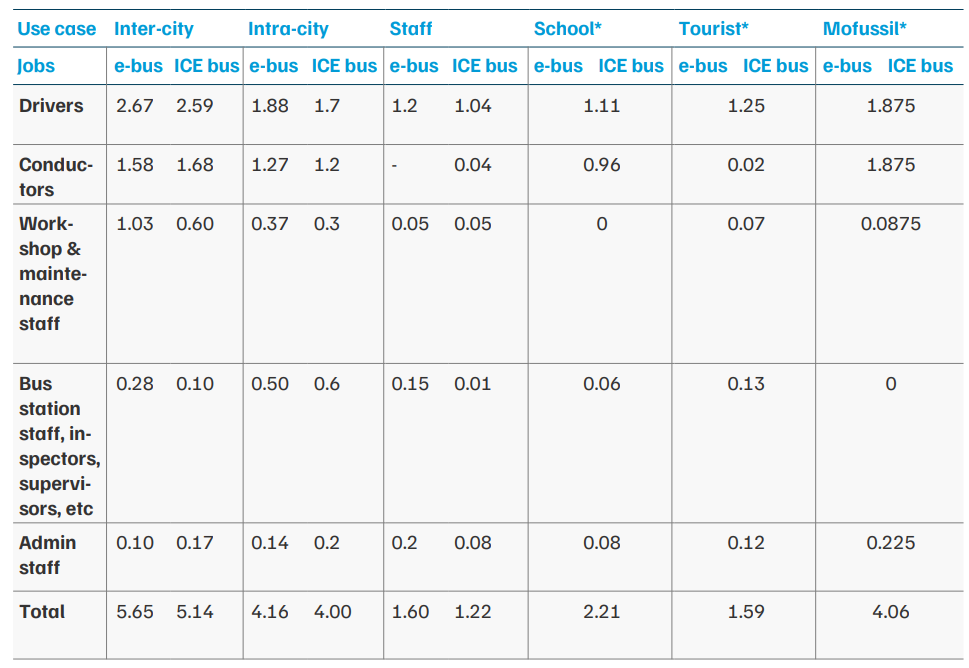
Operational or post-procurement roles within the bus sector include the jobs of drivers, conductors, administration staff, supervisors, and cleaning and maintenance personnel. We identified the operational job coefficient from the staff-to-bus ratio that was identified for ICE and e-buses using primary data collection for the various job heads and use cases, as highlighted in Table 5. To estimate operational jobs, we calculate the weighted proportion distribution of different bus use cases to the operational coefficient for ICE and e-buses (Table 6).
Table 5. Staff-to-bus ratio for ICE buses and e-buses across various use cases
Source: Authors’ analysis
Note: *Staff-to-bus ratio for e-buses is assumed to be the same as ICE buses due to lack of available data.
Table 6. Use-case-wise job coefficients, utilisation, and estimated daily passenger per bus
Source: Authors’ compilation (primary data; CoE-ZET IITM data)
Note: *coefficients were assumed due to data unavailability.
We find that a total of 2.99 persons are required to operate an e-bus, while 2.82 persons are required per ICE bus. Thus, the job intensity of e-buses is greater than that of ICE owing to the need for charging staff.
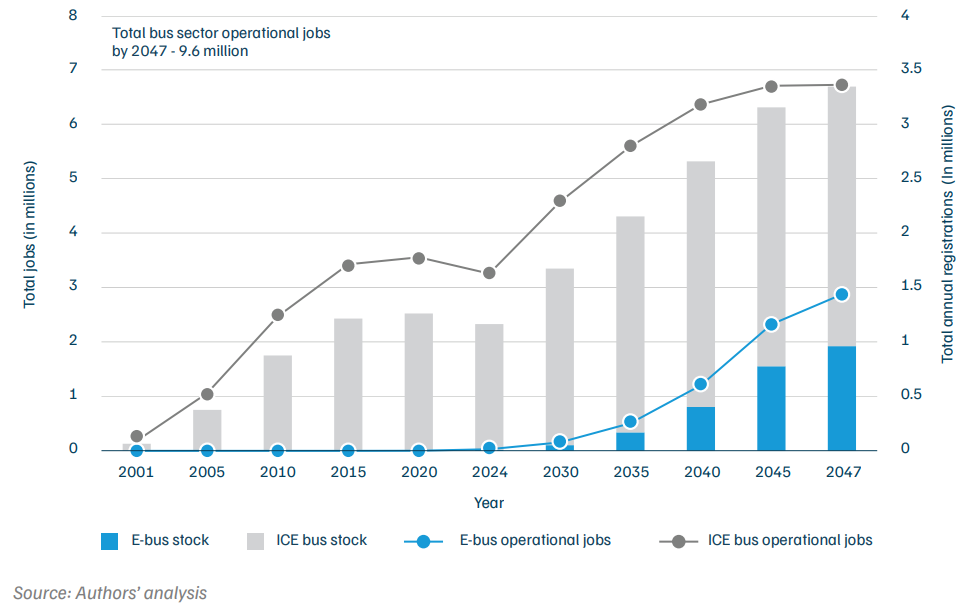
The TFFM model estimates the year-on-year (YoY) growth in new registrations and the on-road bus stock till 2047. The on-road bus stock is predicted to be 1.67 million (16.7 lakh), 2.67 million (26.7 lakh), and 3.34 million (33.4 lakh) by 2030, 2040, and 2047, respectively. The proportion of e-buses in the total bus stock is estimated to be 3 per cent, 15 per cent, and 29 per cent by 2030, 2040, and 2047, respectively. The aggregated weighted proportion of various operational coefficients in the various use cases is used to estimate the growth in operational jobs in the ICE and e-bus segments for the years 2030, 2040, and 2047 (Table 7). The bus sector is estimated to generate 9.6 million operational jobs by 2047 (Table 7).
Table 7. Estimated operational jobs by 2047 in the Indian bus sector (in millions)
Source: Authors’ analysis
Figure 11. E-bus operations jobs are expected to have steady growth while that of ICE bus will stagnate
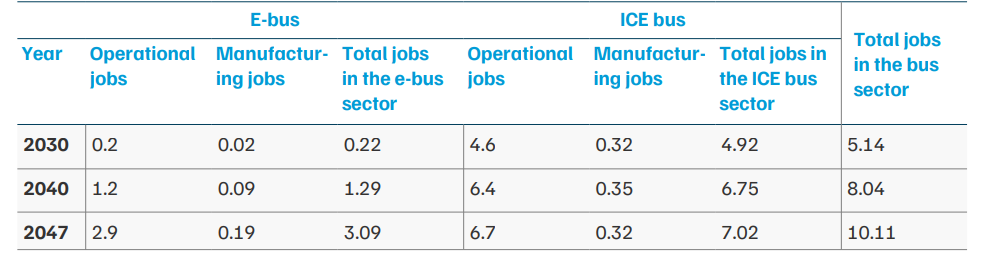
The study estimates that the bus sector (e-bus and ICE bus) has the potential to generate gross employment (operational and manufacturing jobs) of 5.14 million (51.4 lakh), 8.4 million (84 lakhs), and 10.11 million (1.01 crore) jobs by 2030, 2040, and 2047, respectively (Table 8). Assuming a projected total population of 1.7 billion (approx. 170 crore) by 2047 (NAREDCO, Knight Frank 2023, 7–8) and an average household size of 4.1 (compared to the current average of 4.2), the bus sector is expected to support the livelihoods of approximately 2.3 per cent of India’s future population.
Table 8. Overall estimated jobs by 2047 (in millions) in the bus sector
Source: Authors’ analysis
However, under the BAU scenario, we find that the proportion of e-buses (including LDV, MDV, and HDV segments) in new sales (registrations) is expected to be only 6 per cent in 2030 and 42 per cent in 2047. This is significantly lower than NITI Aayog’s policy target of 13–16 per cent e-bus penetration by FY30 (NITI Aayog et al., 2022). For sales to increase substantially over the next five years, it is crucial to identify and address the barriers to e-bus adoption. Thus, we study the early e-bus initiatives across the country.
The transition to electric buses in India faces several challenges, spanning operational, financial, technological, and infrastructural domains. These include high capital costs, range and power concerns, lack of operational know-how, uncertainty around battery life, high land and infrastructure costs, limited availability of battery management data, and the absence of widely accessible public charging facilities (SAREP 2024; Sharma 2023; Khurana 2024).
Recognising these barriers, this study aims to document how different stakeholders across the country are attempting to address them. We identified a pool of 20 case studies where specific initiatives have been undertaken to tackle such challenges on the ground, or new avenues for e-bus deployment have been explored. From this pool, eight case studies were selected based on multiple criteria, including thematic diversity, geographic distribution, availability of reliable data for analysis, and necessary permissions from local stakeholders. Details of the stakeholders are provided in Annexure 2, while Table 9 outlines the thematic areas and case studies covered in this study.
Table 9. Selected case studies across India
Source: Authors’ analysis
Deductive content analysis was employed to gain a deeper understanding of the subject. It systematically categorises and compares the dynamics across the two fuel technologies (ICE and e-buses) from the standpoint of various operation models and use cases (Bingham and Witkowsky 2022).
Guwahati city, the largest city in the state of Assam, spreads over 216 sq km, making it the biggest metropolis in Northeast India. It has a population of one million people and is an educational, religious, administrative, cultural, and tourism hub, attracting various kinds of travellers. Buses are the major mode of public transport serving intra-city trips. Other shared modes, like hand-driven rickshaws, e-rickshaws, auto-rickshaws, TATA Magic cabs, and private taxis also cater to the city‘s travel demand.
Table 10. City statistics of Guwahati, Assam
Source: Office of the Registrar General & Census Commissioner, India. Census of India 2011: Provisional Population Totals. New Delhi: Government of India, 2011 and Guwahati Master Plan 2025
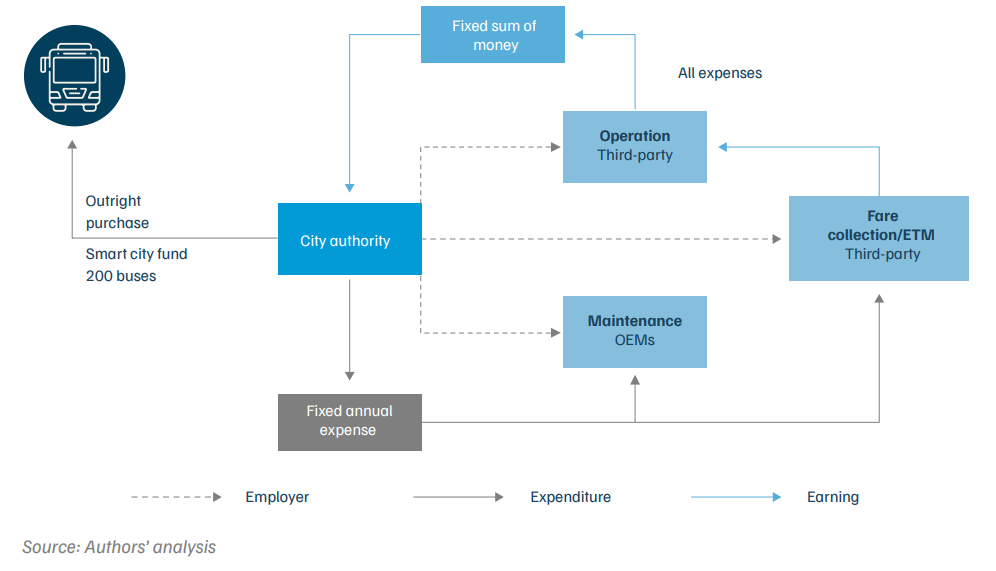
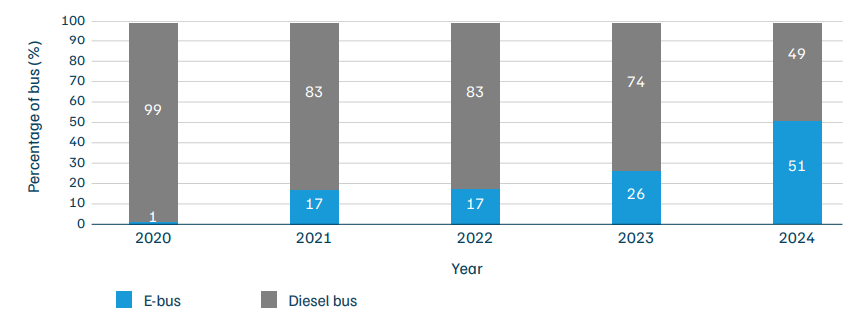
In line with the country’s net-zero emissions targets, the state government has announced ambitious plans to make Guwahati the first city in India with a green public transportation system by 2025 (Times of India 2024). The state plans to roll out electric and CNG buses, which are significantly less polluting than diesel buses. The Assam State Transport Corporation (ASTC) manages Guwahati‘s inter- and intra-city bus systems. As of January 2024, the intra-city fleet comprised 100 CNG buses, 15 e-buses procured under the FAME I scheme, and 200 e-buses funded by the Guwahati Smart City Project. The diesel buses are now used only for inter-city operations. With the addition of 56 new e-buses in January 2025, the city now has a total of 271 e-buses. Further, the city plans to add another 100 e-buses to its fleet by 2026 under the PM e-Bus Sewa scheme.
Table 11. Bus operation specifications of intra-city buses in Guwahati
Source: Assam State Transport Corporations, RB enterprises and Multitech Engineering
Table 12. Bus fleet specifications of intra-city buses in Guwahati
Source: Assam State Transport Corporations, RB enterprises and Multitech Engineering
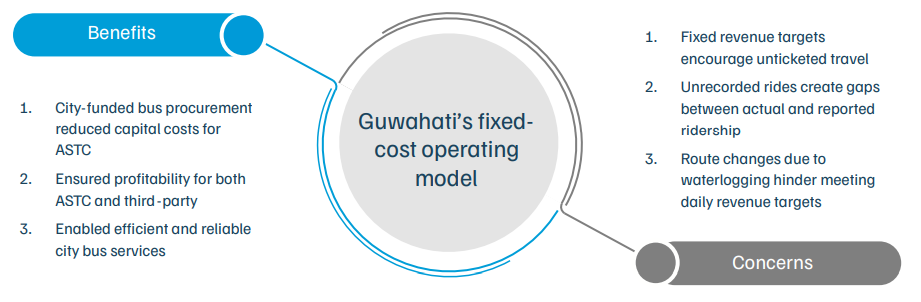
E-buses remain cost-prohibitive due to their high capital cost – they are over two - four times more expensive than diesel buses. The ‘gross cost contract model11’ of e-bus operations has been widely practised across cities since the Grand Challenge, an initiative led by CESL that aggregated demand for e-buses supported under the government’s FAME-II scheme. The model helps convert the capital cost of e-buses into a predictable operational cost, as shown in the case of Surat. However, ASTC’s e-bus fleet operations in Guwahati use a distinctive model that prioritises efficiency and economic viability. By implementing a fixed-revenue structure, ASTC ensures profitability for itself, including third-party operators. Guwahati was able to implement this model as the e-buses were procured using the Guwahati Smart City Fund, eliminating capital costs concerns for ASTC. The operators pay fixed standing and running charges to the ASTC, which guarantees a stable income of around INR 7.5 million (INR 75 lakh) per month. This model enables the ASTC to avoid the complexities associated with e-bus operations. In contrast, ASTC owns and operates its CNG buses, incurring revenue losses in their operation.
As per the contractual agreement, the operators are responsible for daily operations, staffing, and energy costs, while maintenance is covered under a five-year annual maintenance contract (AMC) with the OEMs. Our interviews with the operators, highlight that the drivers and conductors are given revenue targets based on route length and ridership to maximise operational efficiency. Ticket sales are logged at the end of each shift using electronic ticketing machines (ETMs). Operators are further incentivised to boost ridership and operational efficiencies through a revenue-sharing model, allowing them to retain any fare collected beyond the set target; however, failure to meet these targets will lead to a salary reduction. As the system motivates them to maximise ridership and maintain high service quality, buses are operated effectively, and users benefit from reliable and comfortable services, further boosting ridership. It is worth noting that the routes and fare is decided by ASTC while the scheduling is managed by the operators. However, having fixed revenue targets leads to unticketed travel – any revenue collected beyond the fixed target is retained by drivers and conductors, incentivising them to operate additional trips and extend their driving hours – as the fare collected during these extra trips often goes unrecorded, giving rise to discrepancies between actual and recorded ridership (Choudhury 2025).
The fixed-revenue model presents a balanced approach to ensuring operational consistency, minimising financial risks for all parties, and supporting Guwahati’s green and sustainable transport system vision. The model can serve as a case example for enhancing contracts and operational efficiency.
Figures 12, 13, and 14 show the typical operational models of bus operations: the outright purchase model12, the net cost contract (NCC) model13, and the gross cost contract (GCC) model, respectively. For comparison, the operational model of buses in Guwahati is shown in Figure 15.
Figure 12. Typical outright purchase model
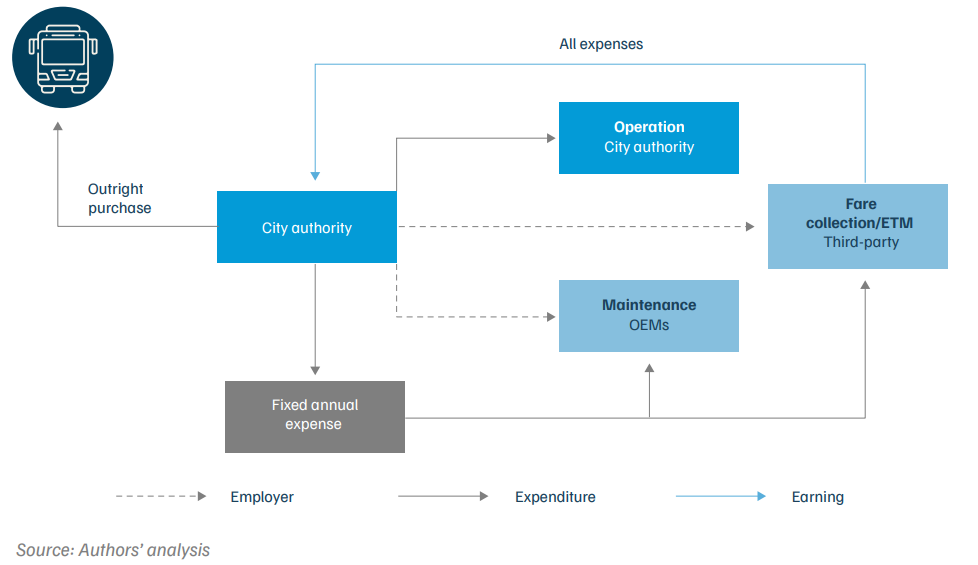
Figure 13. Typical net cost contract operations
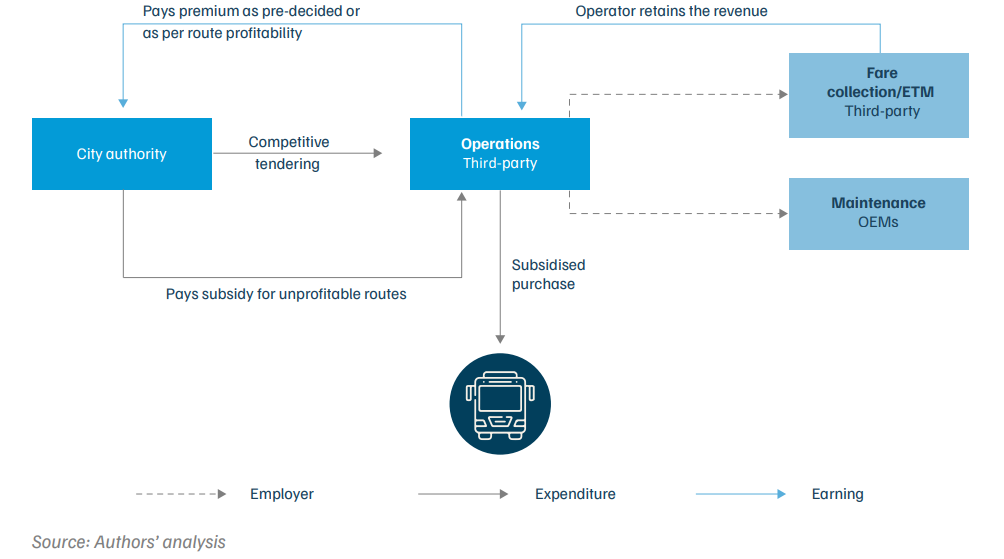
Figure 14. Typical gross cost contract operations
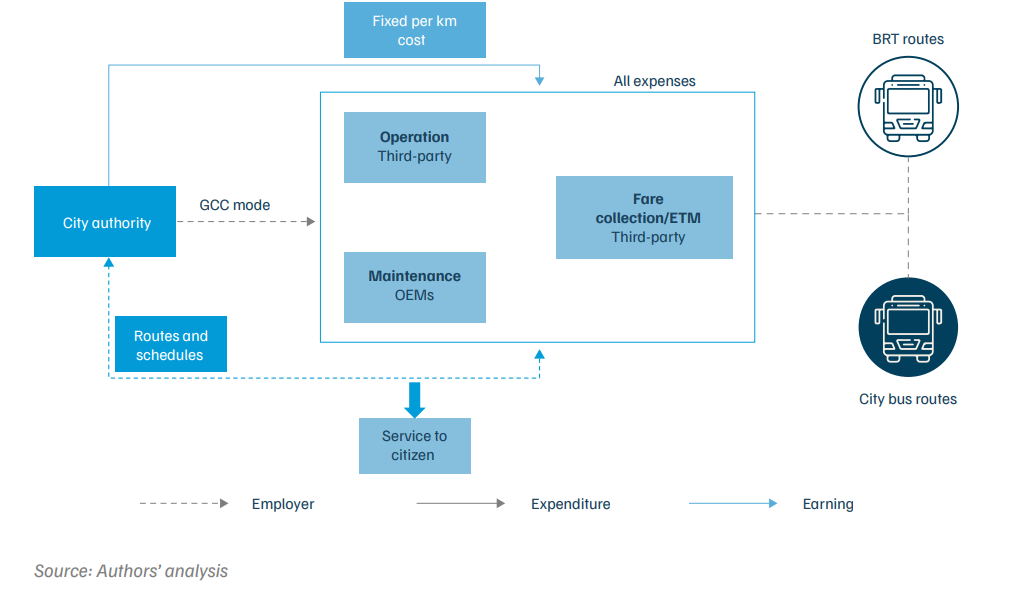
Figure 15. Guwahati’s fixed-revenue model
Box 2. How is Guwahati’s model different from other prevalent models
As presented in the charts above, Guwahati follows a hybrid operational model that incorporates elements from multiple models. Key features include:
Stated challenges
Figure 16. Benefits and concerns regarding Guwahati’s fixed cost operating model
Source: Authors’ analysis
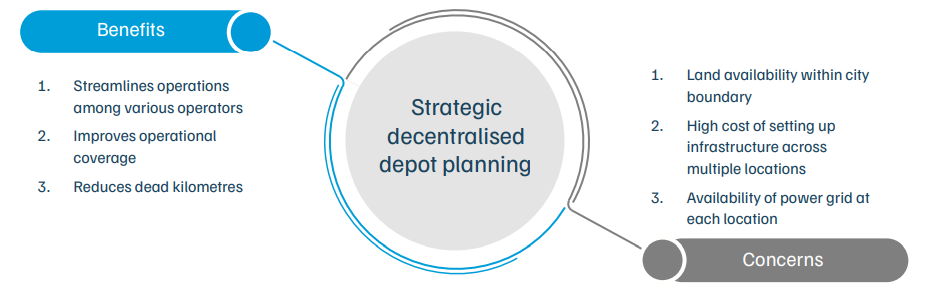
Decentralised depot and service planning
Surat, Gujarat, India’s first city with the largest ‘fully–electrified’ bus rapid transit services (BRTS) corridor, covers an area of 462 sq km and has a population of 4.46 million (44.6 lakh), as per the most recent Census (2011). Surat City is a hub of economic activity driven by its textile, diamond, and IT industries. It is one of India’s fastest-growing cities, with over 50 per cent of its population coming from other parts of India (Times of India 2019). Thus, the city authority’s focus on strengthening the public transport system is vital to meet the growing travel demand and arrest the growth of private vehicles.
Surat Sitilink Ltd. (SSL), a Special Purpose Vehicle (SPV), is formed by the Surat Municipal Corporation (SMC) as a fully-owned subsidiary company, to manage mass public transportation. Currently, SSL operates the city bus services (CBS), BRTS, and the high mobility corridor (HMC) on a gross cost–basis in Surat. By incorporating e-buses into the BRTS, the city aims to be a role model for other cities. Presently, SSL operates a total fleet of 873 buses – 425 diesel and 15 e-buses ply on city bus routes, whereas 433 e-buses operate in the BRTS corridor. SSL aims to phase out the existing fleet of diesel buses by 2026 and increase its e-bus fleet size to 1,300 e-buses by 2030.
Table 13. City statistics of Surat, Gujarat
| Attribute | Value |
|---|---|
| Area | 462 sq km |
| Population (Census 2011) | 44,66,826 |
| Popular modes of travel | BRTS buses, city buses, autorickshaws, taxis |
| Modal share of buses | - |
Source: Office of the Registrar General & Census Commissioner, India. Census of India 2011: Provisional Population Totals. New Delhi: Government of India, 2011
Table 14. Bus operation specifications of Surat Sitilink Ltd
| Fleet type | Diesel buses | E-buses |
|---|---|---|
| Area of operation | Intra-city | Intra-city |
| Year of operation | 2014 (14) and 2024 (425) | 2020 (4) and 2024 (450) |
| Fleet size | 425 | 450 |
| Number of routes | 45 | 13 BRTS routes and 4 city bus routes (common with diesel bus) |
| Route length in km (min–max) | 916 (8–29) | 305 (8–34) |
| Age of fleet (in years) | 7 years' contract | 2 years on average |
| Number of depots | 4 | 6 |
| Number of chargers | - | 65 fast, 58 slow |
| Total manpower (O:F:M) | 1,364 | 1,710 (419 BRT staff) |
| Gender ratio (O:F:M) | 0:1:22 | 0:1:58 |
| Number of drivers | 464 | 939 |
| Driver avg. experience | - | 8+ years |
| Mandatory experience | - | 5 years |
| Number of conductors | 714 | 419 |
| Maintenance staff | 186 | 352 |
| Utilisation per bus per day | 202 | 204 |
| Unit Cost of power (INR per kWh) | - | INR 6.9 (subsidised) |
Source: Surat Sitilink Ltd.
Table 15. Bus fleet specifications of Surat Sitilink Ltd
| SSL | Diesel bus | E-bus |
|---|---|---|
| Operated by | Hansa, Maruti | Chakra, SSP, Greencell, Maha Voyage |
| Drivers employed by | Hansa, Maruti | Chakra, SSP, Greencell, Maha Voyage |
| Salary: driver (INR per month) | - | 18,500 |
| Salary: conductor | - | - |
| Maintained by | MJ, Sukani, Akar | Akar |
Table 16. E-bus fleet specifications of Surat Sitilink Ltd
| OEM | Bus type | Fleet size | Scheme | Procurement model |
|---|---|---|---|---|
| Olectra | 9 m | 150 | FAME II | GCC |
| Greencell | 9 m | 150 | FAME II | GCC |
| JBM | 12 m | 150 | NEBP CESL | GCC |
Source: Surat Sitilink Ltd.
Figure 17. Surat Sitilink Ltd has been steadily electrifying its bus fleet
Source: Authors’ analysis
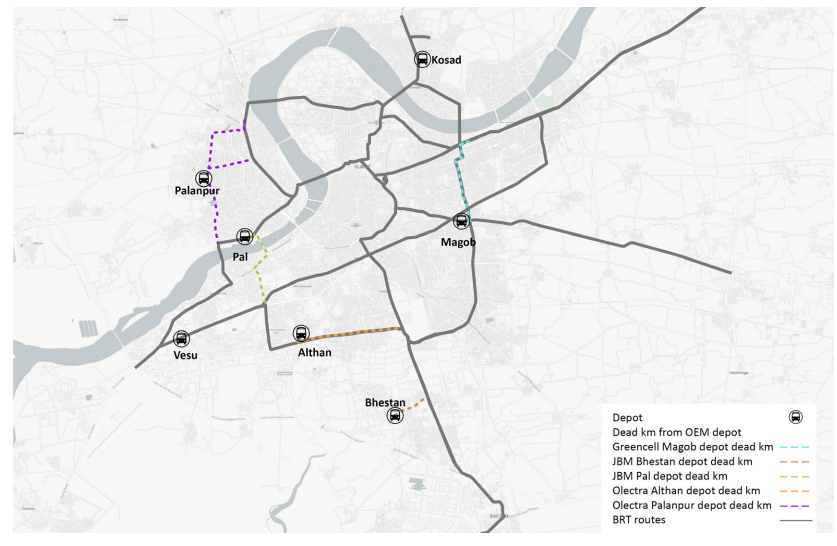
Surat City’s public transport system is organised into nine administrative zones. There are 10 depots strategically distributed across these zones to optimise bus operations and minimise dead kilometres. ‘Dead kilometres’ refers to the distance travelled by a public transit vehicle without any boarding/alighting of passengers, typically when moving from a depot to the starting point of a route or from the ending point of a route to the depot. SMC provides land and develops civil infrastructure, while the respective OEMs handle the development of charging and safety facilities. This collaborative approach ensures that efficient operations and safety standards, along with other necessary features, are developed by the respective OEMs across all depots.
Table 17. Surat charging infrastructure specifications
| Depot name | Bus accommodated | Bus OEM | Bus operator | Number of buses | Number of chargers | Type of chargers | Charger capacity (Kwh) |
|---|---|---|---|---|---|---|---|
| Bhestan Garden | ICE | Ashok Leyland | Maruti | 75 | - | - | - |
| Kosad | ICE | TATA | Hansa | 220 | - | - | - |
| VIP Road | ICE | TATA | Hansa | 100 | - | - | - |
| Punagam | ICE | TATA | Hansa | 30 | - | - | - |
| Palanpur | e-bus | Olectra | Maha Voyage | 75 | 32 AC, 5 DC | Fast/slow | 80/150/180 |
| Althan | e-bus | JBM | SSP | 25 | 5 | Fast | 240 |
| Magob | e-bus | PMI | Greencell | 90 | 12 | Fast | 180 |
| Vesu | e-bus | PMI | Greencell | 65 | 12 | Fast | 180 |
| Bhestan BRTS | e-bus | JBM | SSP | 75 | 15 | Fast | 240 |
| Pal | e-bus | JBM | Chakra | 50 | 10 | Fast | 240 |
Source: Surat Sitilink Ltd.
To promote sustainable transit and reduce emissions, six of these depots are dedicated to e-buses while the remaining four cater to diesel buses. Each e-bus depot has charging infrastructure installed by the OEMs to support e-bus operations. These depots consume about 0.1 million (1.3 lakh) units of electricity monthly, supplied by Dakshin Gujarat Vij Company Limited (DGVCL) at a rate of INR 6.85 per unit. Efforts to integrate renewable energy are underway, including plans to integrate a pilot 100 kW solar installation at the Althan Depot. This initiative aims to enhance sustainability and reduce dependency on conventional energy sources. Additionally, all OEMs are required to maintain a reserve fleet that can be utilised in case of delays in breakdown resolution.
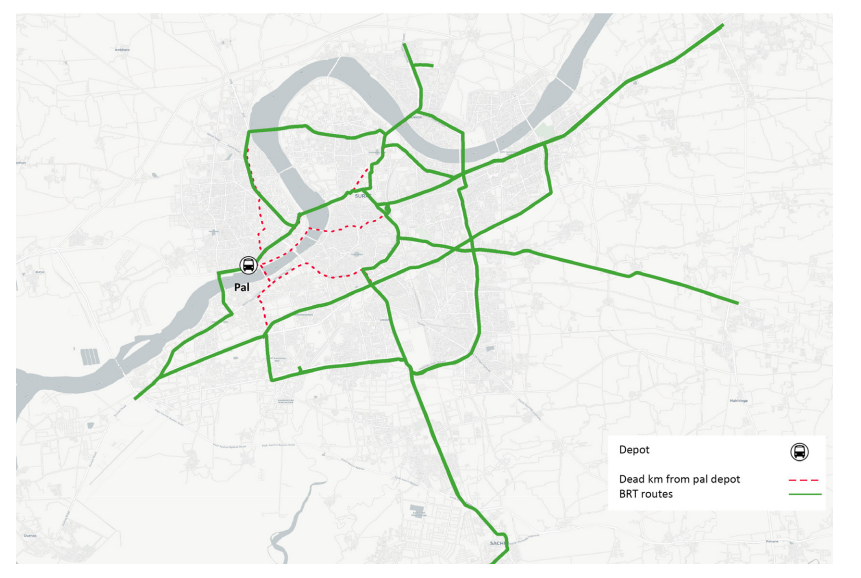
Our scenario analysis shows that decentralised depot allocation keeps the average dead kilometres per trip at 2.2 km, ranging between 0.9 and 2.8 km. This is nearly half the dead kilometres that would result from a centralised depot system—assessed using the Pal depot, which is well located within the city and has the scope of expansion. Thus, decentralised planning has reduced dead kilometres by 50 per cent, leading to improved route efficiency and lower operational costs (Table 18).
Table 18. Decentralised depot planning helps reduce dead kilometres per route
| Depot planning case | Depot | Route ID | OEM | Average dead km per route (min–max) |
|---|---|---|---|---|
| Existing decentralised depot planning (BAU) (Figure 18) | Pal, Bhestan, Althan | 14, 20, 11, 12, 15AC, 15C | JBM | 2.2 km (0.9–2.8 km) |
| Palanpur, Althan | 13, 17A, 23, 21 | Olectra | ||
| Magob, Vesu | 13, 16, 18, 19, 22, 136, 706, 106, 15C | Greencell PMI | ||
| S1 – Centralised depot planning case (Scenario 1) (Figure 19) | Pal | all routes | all OEMs | 4.7 km (2.2–10 km) |
Source: Authors’ analysis
Figure 18. In the existing scenario with decentralised depots in Surat, the average dead kilometre is ~2.2 km
Source: Authors’ analysis
Figure 19. With a centralised depot, the average dead kilometre in Surat doubles
Source: Authors’ analysis
Stated challenges
Figure 20. Benefits and concerns regarding decentralised depot planning
Source: Authors’ analysis
4.3 Opportunity charging for degraded batteries
Chartered Speed, one of India’s largest bus operators, provides services across various states in India, including Gujarat, Maharashtra, Madhya Pradesh, Odisha, Rajasthan, and Assam. It operates across the B2B,14 B2C,15 and B2G16 segments. Chartered Speed offers a range of transport solutions, such as city buses, BRTS, school buses, staff buses, airport buses, taxis, and bike-sharing services. Established in 2010 with an initial fleet of 50 buses, the company has grown significantly and now manages a fleet of 2,200 buses.
Chartered Speed introduced its first set of e-buses in 2019 through a partnership with Atal Indore City Transport Service Limited (AiCTSL), with the aim of electrifying intra-city bus services in Indore. AiCTSL floated a tender under the NCC model, requesting operators to specify the viability gap funding (VGF) needed for operating e-buses.
Chartered Speed adopted a hybrid approach and quoted the lowest VGF, valued at INR 0.3 million (INR 3 lakh) per month for operating 40 e-buses, securing the tender. The company’s motivation to transition to electric buses stemmed from achieving cost parity with diesel buses, facilitated by leveraging state and central subsidies. Through the FAME I scheme and Madhya Pradesh state subsidy, Chartered Speed secured a combined subsidy of INR 6 million (INR 60 lakh), reducing the purchase cost of each e-bus to INR 3 million (INR 30 lakh) – which was on par with the cost of a diesel bus. Additionally, under the hybrid NCC model, AiCTSL facilitated land acquisition for the depot and the installation of a charging station.
AiCTSL also pays for e-bus charging costs. Under the contract, AiCTSL decides bus fares and routes, while Chartered Speed handles scheduling and fare collection. Chartered Speed has to operate a distance of at least 150 km per bus daily, which is monitored daily by AiCTSL. E-buses operate on four routes within the city, covering a total route length of 63.25 km. As mentioned by Chartered Speed, in 2024, 33 e-buses were operational in Indore, catering to around 0.15–0.2 million (1.5–2 lakh) people monthly. Initially, the buses with 120 kWh batteries offered 90–95 km on a single charge, but now this has been reduced to 65–70 km.
Table 19. City specifications of Indore, Madhya Pradesh
| Attribute | Value |
|---|---|
| Area | 530 sq km |
| Population (Census 2011) | 19,94,397 |
| Popular modes of travel | BRTS buses, city buses, autorickshaws, bicycles |
| Modal share of buses (CMP Indore, 2012) | 19% |
Source: Office of the Registrar General & Census Commissioner, India. Census of India 2011: Provisional Population Totals. New Delhi: Government of India, 2011., Comprehensive Mobility Plan Indore, 2012
Table 20. Bus fleet and operation specifications of Chartered Speed Pvt. Ltd. in Indore
| Fleet type | E-bus (Chartered Speed) |
|---|---|
| Area of operation | Intra-city |
| Year of operation and fleet size | Began in 2019 with 40 buses; 33 operational as of 2024 |
| Number of routes | 4 |
| Route length (min–max) km | 64 (14–18) |
| Age of fleet (in years) | 5 |
| Number of depots | 1 |
| Number of chargers | 12 fast |
| Total manpower | 110 |
| Gender ratio (O:F:M) | 0:0:110 |
| Number of drivers | 48 |
| Avg. driver experience | - |
| Mandatory experience | 5 years |
| Number of conductors | 50 |
| Maintenance staff | 12 |
| Utilisation per bus per day | 152 |
| Avg. monthly fuel/power consumption | ~ 0.3 million (3 lakh) |
| Cost of energy per km | - |
| Unit cost of power | INR 6.9 (surcharge of 20% on normal rate) |
Source: Chartered Speed Pvt. Ltd.
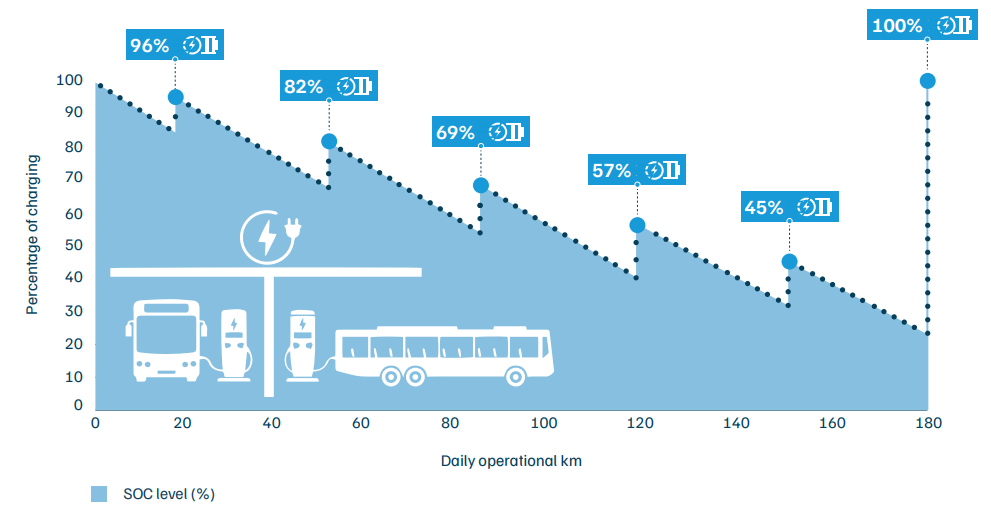
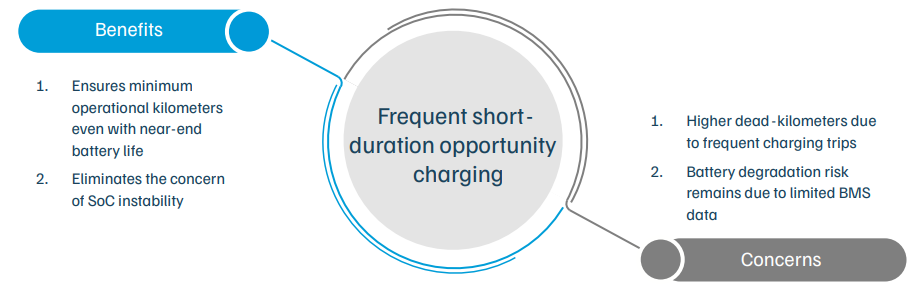
How has Chartered Speed ensured that each bus covers 150 km per day despite battery’s depleting age?
Chartered Speed’s e-buses in Indore are now five years old. Their batteries are approaching end-of-life. Due to this, buses often experience sudden drops in state of charge17 (SOC) during operations, which poses challenges for effective operation. Chartered Speed adopted an innovative approach to improve bus utilisation in such situations. They designed the bus schedules such that each bus could return to the depot every hour or after riding 16–20 km for 15–20 minutes of opportunity charging, which boosted the SOC by 15 per cent. This arrangement helped prevent breakdowns during the trip. In addition to the 14 chargers installed at the depot, Chartered Speed installed three opportunity chargers in the city at the start and end of a few routes to support the opportunity-charging process.
Although this system increases dead kilometres, as buses have to return to the chargers frequently, it ensures that the minimum required operational kilometres are met. As Chartered Speed is responsible for bus timing and scheduling, this process is managed efficiently to balance service quality with operational needs. Figure 21 shows the SOC pattern due to hourly charging throughout the day.
Figure 21. Opportunity charging after every one hour or 20–30 km of operation boosts the battery’s state of charge by 15%
Source: Authors’ analysis
Concerns regarding battery degradation
Battery degradation is a significant concern for e-bus operations; frequent charging cycles and shorter cooling periods due to strict scheduling can hasten degradation. Insights from previous case studies highlight that more than half of the buses procured under FAME I in cities such as Guwahati and Lucknow have been retired, primarily due to degraded batteries. In contrast, over 85 per cent of the e-bus fleet procured by Chartered Speed in Indore is still operational. Chartered Speed has reportedly mentioned that there has been minimal battery degradation in its e-buses despite multiple opportunity-charging cycles.
A key challenge in assessing battery degradation is linked to the inaccessibility of accurate battery management system (BMS) data, which is locked and controlled by the OEMs. Hence, forcing operators to rely on estimations that may not align with OEM-calculated metrics. For instance, in Indore, Chartered Speed reported that short-duration opportunity charging, such as charging from 20–40 per cent SOC and again from 40–60 per cent SOC are considered as two separate charging cycles by them, but the OEM’s BMS consolidates both events as a half charge cycle. This discrepancy makes it difficult to draw accurate conclusions about battery degradation patterns.
Stated challenges
Figure 22. Benefits and concerns regarding frequent short-duration opportunity charging
Source: Authors’ analysis
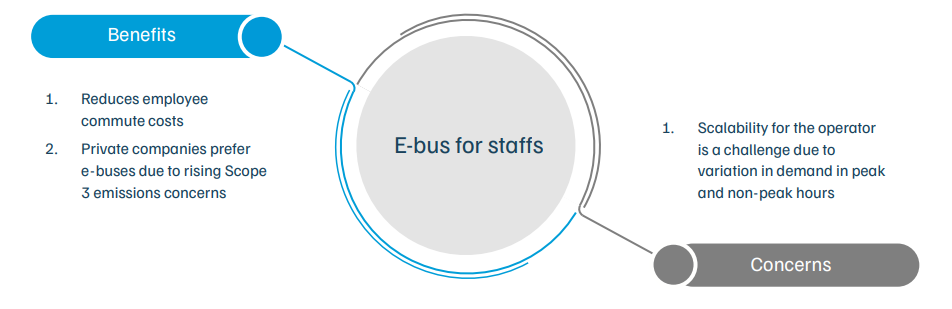
E-buses for staff transport services
Chartered Speed began operating dedicated e-buses for staff in mid-2022. The operation commenced with a fleet of four e-buses operating between Ahmedabad and Gujarat International Finance Tec-City (GIFT City), and it has now expanded to 10 e-buses operating in multiple shifts, making two to four round trips daily, catering to employees who travel between Ahmedabad and GIFT City for work. The e-buses are owned by Chartered Speed and were procured under a CAPEX model, with financing obtained at an interest rate of 9.4 per cent. Each bus cost INR 12 million (INR 1.2 crore), and no subsidies were provided for the procurement.
Chartered Speed aims to support the development of a green mobility zone (GMZ) in GIFT City, particularly in the special economic zone (SEZ) area. Additionally, by providing electric staff buses, Chartered Speed helps organisations reduce the emissions associated with employee commutes, as outlined in their Scope 3 declarations.
In 2022, GIFT City had approximately 12,000 employees. The absence of public transit services within the city posed significant challenges for commuting. Employees primarily commuted using private cars, with an average occupancy of two people per vehicle. This led to around 5,000 cars entering the city daily, occupying nearly one million sq ft (10 lakh sq ft) of space, which is worth INR 2 billion (INR 200 crore), estimated based on the local market rate of INR 2,000 per square foot.
Additionally, around 70–80 per cent of employees travelled daily in private vehicles between Ahmedabad and GIFT City, resulting in heavy traffic on the Ahmedabad-Gandhinagar Highway. Chartered Speed operates its staff buses on business-to-customer (B2C) and business-tobusiness (B2B) models. In the B2C model, staff can pre-book their preferred seats online via the Chartered Speed application. They can book a one-way ticket, a day pass that allows unlimited travel on that day, or a monthly pass that allows unlimited travel in the month. The subscription cost (exclusive of GST) for each type of booking is mentioned here:
Under the B2B model, Chartered Speed partnered with companies like Adani Airport Holdings and Befree Business Resourcing LLP in Ahmedabad and GIFT City to operate dedicated e-buses for their employees based on the routes and schedules provided by these companies.
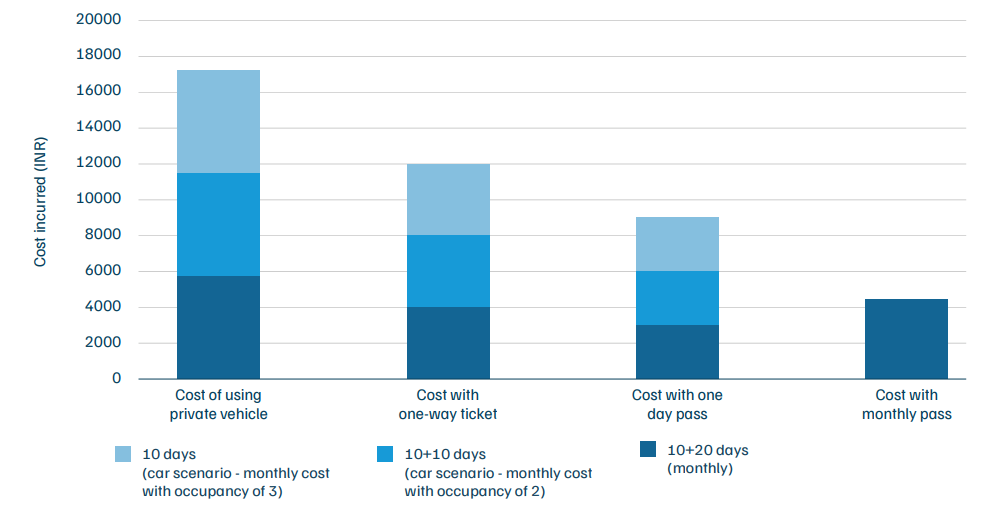
The monthly pass system is the most economical option for commuters from Ahmedabad to GIFT City, offered at a monthly subscription of INR 4425 per passenger. For an employee using a private vehicle with an effective mileage of 12 km per litre, a 70-km round trip will consume 6 litres of fuel, which will incur a daily cost of INR 576 (@INR 96 per litre), amounting to a monthly expense of INR 17,000 or more. The staff bus arrangement will reduce travel expenditure by almost 75 per cent (if opted for individually) (Figure 23) and also benefit partner companies, as it will help reduce the cost of travel allowances and help organisations fulfil sustainability targets.
Figure 23. Cost of commuting with a monthly pass is nearly one-fourth that of using a private vehicle
Source: Authors’ analysis
The staff bus subscription model by Chartered Speed offers services at INR 2 per km – in this pricing model, staff buses may break even in 3–4 years if they have 100 passengers across three up and down trips. For instance, assuming the cost of a new e-bus is INR 1.2 crore, with a seating capacity of 30 commuters and one driver. Chartered Speed aims to accommodate at least 100 passengers per bus per month on a monthly subscription basis, which will provide a fixed revenue of INR 53 lakh annually. The major components of operational expenditure are power and manpower costs. An e-bus must serve to commute three batches of staff (100 passengers) from Ahmedabad to GIFT city and back to Ahmedabad each day, i.e. six trips of 70 km. The average power consumption of an e-bus is 1.2–1.3 kWh/km, resulting in an energy requirement of 500 units per day, costing INR 9.7 lakh annually (@INR 7/unit). As per the staff requirement of 4.71 per e-bus, the annual manpower expense will be 9.3 lakh, assuming a salary of INR 16,500/staff. This will result in an effective income of INR 34 lakh annually, and the break-even point is expected to be achieved in 3-4 years (Figure 24).
Figure 24. Break-even is estimated to be achieved within 3 to 4 years under the targeted subscription model
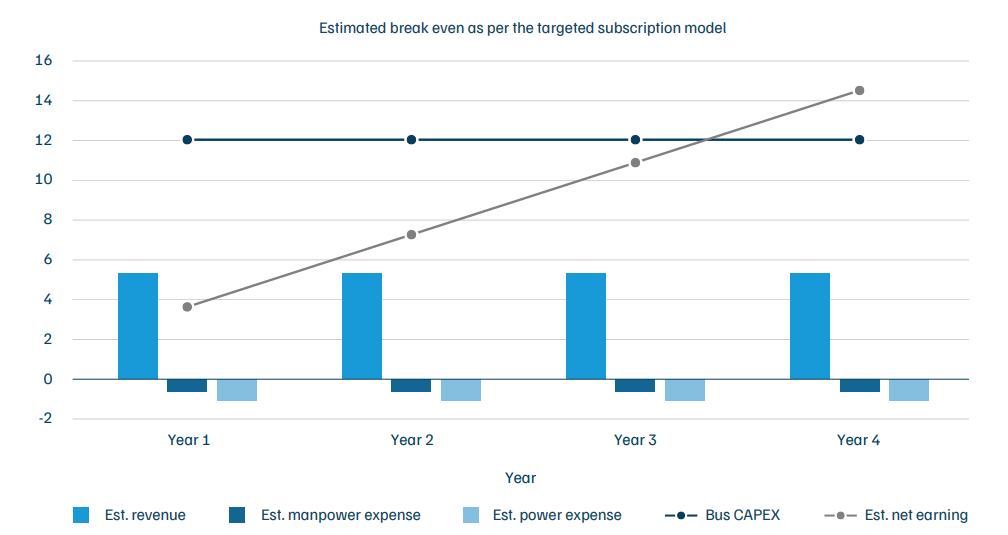
Source: Authors’ analysis
Stated challenges
Figure 25. Benefits and concerns regarding e-bus for staffs
Source: Authors’ analysis
Retrofitted e-bus initiatives
Kalyani Powertrain Limited (KPTL), a subsidiary of Bharat Forge DNA, has been driving the electrification of two-wheelers, buses, and trucks since 2021, focusing on commercial, environmental, and operational benefits. With a strong emphasis on retrofitting19 ICE vehicles to transform them into EVs, the company is ambitiously targeting a significant global market share.
Its primary goal is to electrify medium and heavy-duty vehicles (MHDVs) in the 7–18 ton GVW segment, which comprises 7 m (25-seater) to 12 m (45-seater) buses, particularly those aged 5 to 15 years. The company caters mainly to B2B clients but also provides limited B2C services, converting small fleets of 4–6 buses. They have successfully retrofitted school buses, staff buses and inter-city buses, details of which can be found in Table 21.
Table 21. E-buses retrofitted by Kalyani Powertrain
| S. no. | Vehicle type | Length/seater | AC/non-AC | Range per charge | ARAI certificate | City of operation (trials with customers) |
|---|---|---|---|---|---|---|
| 1 | School bus | 7 m/25 | Non-AC | 100+ km | In progress | Pune |
| 2 | Staff bus | 9 m/35 | AC | 150+ km | Yes | Mumbai |
| 3 | STU/inter-city | 12 m/45 | AC | 220+ km | Yes | Kanpur, Pune - Mumbai |
Source: Authors’ analysis
The company aims to significantly reduce overall electrification costs. Kalyani Powertrain has partnered with financial institutions to address the high upfront costs of vehicle electrification, particularly for trucks, providing a ‘one-stop solution’, from fleet electrification to financing alternatives at reduced interest. This partnership ensures cost recovery within three years, alleviating the concerns of hesitant investors and encouraging the adoption of electric solutions.
Business model and operation
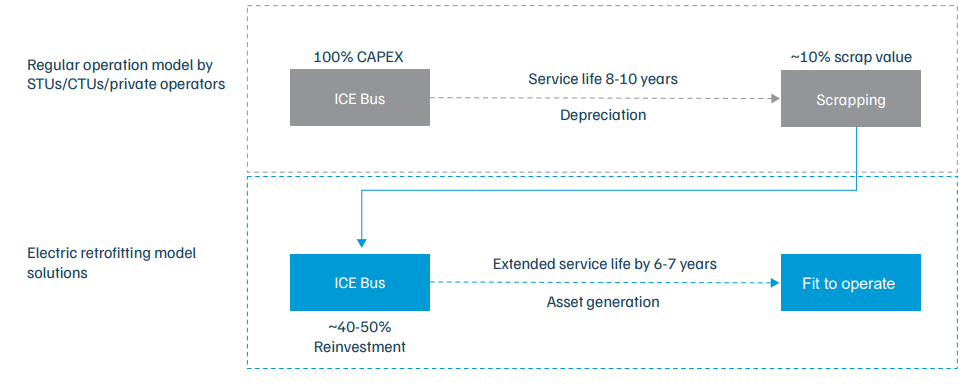
Kalyani Powertrain offers electric retrofitting for buses that are about to retire after about 5 to 15 years of service. After the necessary approvals have been obtained, all ICE components, including the engine, are removed, a new EV kit is installed, and the internal structure and layout are redesigned. The refurbished bus model undergoes testing by the Automotive Research Association of India (ARAI). The approval process includes tests for vehicle weight changes, gradeability, brake performance, noise levels, motor power, the safety compliance of traction batteries, and functional safety. Further, wiring harnesses and connectors are tested for durability, voltage resistance, and compatibility with various conditions. The whole process generally takes around two months to complete, including the first-time homologation20 process. After the one-time homologation of a particular model manufactured in a particular year is completed, it takes less than a month to convert a diesel bus into an e-bus. Kalyani claims that their retrofitted buses and trucks offer an efficiency of 0.6–0.8 kWh per kilometre on plains and 1.1–1.3 kWh per kilometre across varied terrains and slopes. The initiative focuses on converting inter-state ICE buses to EVs. While these ICE buses ideally have a lifespan of around 15 years, they are typically taken off the road after 8–10 years of operation. This is often due to a degraded chassis or frequent engine breakdowns. KPTL states that retrofitted e-buses offer the government a cost-effective solution, costing only 40 – 50 per cent of the price of a new e-bus—approximately INR 7 million (INR 70 lakh), compared to around INR 15 million (INR 1.5 crore) for a new e-bus. Additionally, retrofitting can extend the lifespan of a bus by another 6–7 years, thereby ensuring that the vehicles are utilised to their full intended lifespan of approximately 15 years (Figure 26).
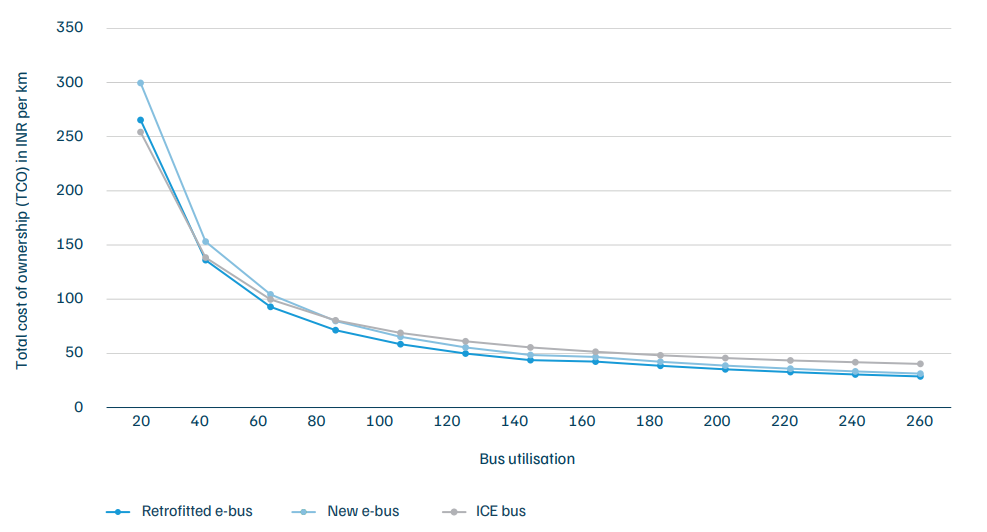
Using the CEEW’s e-bus viability model, the study found that the TCO of retrofit buses is lowest after 40 km of utilisation per day, and would be 20–23 per cent lower than that of ICE buses for a daily bus utilisation of 180–200 km (Figure 27). Hence, retrofitted e-buses can be a viable solution for intra-city and inter-city buses based on the use-case-wise bus utilisation shown in Table 6.
Figure 26. Retrofitting ensures the utilisation of vehicles until their ideal lifespan of ~15 years
Source: Authors’ analysis
Figure 27. Retrofitted e-buses offer a lower total cost of ownership (TCO) for daily utilisation exceeding 40 km in comparision to ICE bus and new e-bus
Source: Authors’ analysis
Stated challenges
Figure 28. Benefits and concerns regarding retrofitted e-buses
Source: Authors’ analysis
4.6 Battery-swappable e-bus pilots
The high upfront cost of e-buses is a significant challenge to their uptake. The capital cost of an e-bus is two to three times higher than that of conventional buses (Kumar, Mulukutla, and Doshi 2024). Batteries alone account for about 40 per cent of the cost of e-buses (WRI India 2024). Using battery-swapping technology significantly lowers the upfront cost of e-buses, enhancing their cost competitiveness with conventional vehicles.
Battery-swapping technology, which was primarily used for two- and three-wheelers in India, has now been expanded to larger vehicles. In 2019, Ashok Leyland led the first efforts to deploy 18 swap-capable e-buses in Ahmedabad in association with SUN Mobility, a leading batteryswapping operator (ITDP 2022).
The primary motivation for Ahmedabad‘s one-year-long battery-swapping in buses pilot was to trial the utilisation of lighter batteries, enabling higher passenger loads without compromising performance and minimising downtime, as swapping allows buses to resume operations quickly, similar to ICE buses.
Pilot in Ahmedabad: 2019
In 2018, India’s first swap-capable bus, the Circuit-S, was uniquely designed for Indian mass transport with compact and lightweight batteries that could be easily swapped at the end of a route, while also creating more passenger space and standing room. In 2019, the Ahmedabad Municipal Corporation (AMC) tendered 18 of these buses from Ashok Leyland under the gross cost model, where Ashok Leyland owned, operated, and maintained the buses. AMC paid the company INR 12.5 per kilometre (WRI and SHAKTI 2021). However, by early 2022, all the swapcapable buses had been converted to operate with plug-in charging due to several issues
Industrial pilot in Bengaluru: 2024
After the battery-swapping pilot in Ahmedabad, an industrial pilot of swap-capable e-buses was launched in Bengaluru, showcasing advancements in battery-swapping solutions for heavy vehicles. The pilot utilises 10.5 m e-buses developed by Veera Vahana, with swapping services provided by SUN Mobility, which owns the batteries and swapping station.
The same bus model accommodates two battery configuration options – 100kWh + 100kWh or 100kWh + 50kWh – which offers operators the flexibility to deploy the buses on inter-city and mofussil routes. During the ongoing pilot, the bus operates in a closed-loop setup within a campus environment without passengers, allowing evaluation of vehicle performance, battery efficiency, and operational range. The observed ranges are approximately 85–90 km for the 100 kWh battery and 40–50 km for the 50 kWh variant. The swapping time is reported to be between 2.5–3.0 minutes, and the cost of the swap-capable e-bus without battery stands at INR 6–7 million (60–70 lakh).
Fixed battery vs swappable battery for buses
Our TCO calculation (Figure 29) also suggests that bus battery swapping is more attractive than fixed charging and diesel alternatives.
Figure 29. The total cost of ownership for intra-city swap-capable buses is lower than that of fixed-point charging buses
Source: Authors’ analysis
Challenges in Ahmedabad’s battery-swapping pilot
Figure 30. Benefits and concerns regarding battery swapping in e-buses
Source: Authors’ analysis
4.7 Gender inclusion in the e-bus workforce
NueGo, India’s first inter-city e-bus service, launched by Greencell Mobility in 2022 is operating in over 100 cities across the country. It aims to provide clean, quiet transportation for all. It aims to integrate and create powerful connected platforms/ecosystems across the products and services in the value chain, offering a robust e-mobility infrastructure in the B2G, B2C, and B2B domains.
As of 2024, NueGo operates over 300 buses with around 450 daily departures on more than 100 routes. It employs more than 1,500 staff, including coach captains (drivers) and cabin hosts. Out of this, around 10 per cent of the staff are women and members of the LGBTQIA+ community. The female coach captains, along with male or female cabin hosts, operate mainly on the Delhi– Agra and Delhi–Chandigarh routes as an initiative to empower women and ensure their safety.
Table 22. Operations of NueGo inter-city e-buses
| Attribute | Value |
|---|---|
| Fleet type | E-bus |
| Area of operation | Inter-city |
| Year of operation | 2022 |
| Year of employing women drivers | 2023 |
| Fleet size | 250+ |
| Number of routes | 100+ |
| Route length (min–max) (km) | 150–500 |
| Age of fleet (in years) | 2 |
| Average daily utilisation (in km) | 650 |
| Workforce size | 1500+ |
| Experience requirement | Min 5 years |
Source: Authors’ compilation from Focus Group Discussion
Women as bus drivers
Bus driving has traditionally been a male-dominated sector. However, the ease of driving an e-bus has opened up opportunities for women to participate in the driving workforce. To promote equal pay and inclusive employment, Greencell Mobility has on-boarded women across various roles, including coach captains, cabin hosts, depot heads, senior managers, and board members.
The female coach captains are highly skilled and experienced in driving heavy vehicles. They have three to five years of heavy vehicle driving experience. While there is no minimum education criteria, most have at least passed the intermediate grade or hold a graduate degree. At the time of joining, before being deployed to the field, they undergo a mandatory 5–7 days training programme conducted by Greencell. This includes three days of theory classes and simulator training to build driving confidence, followed by practical driving experience at the depot and supervised trial runs on the route with an experienced driver and trainer. This one-time training concludes with a theory exam, which must be passed to qualify for the job. The training modules and patterns remain the same for both male and female pilots. Some of the measures implemented by NueGo to encourage and retain female pilots are as follows:
How is the training at NueGo different from the training offered by other OEMs?
Table 23. Comparison of drivers’ training offered by various OEMs
| TATA | Olectra | JBM | NueGo | |
|---|---|---|---|---|
| Training duration (in days) | 3 | 3–5 | 3 | 7 |
| Training modules/ pattern | - | - | Day 1: A. Vehicle familiarisation B. Confidence build-up C. Behaviour training Day 2: A. Safe driving practices Day 3: A. Vehicle exploration B. Personal interaction C. Safety rules D. Special-case training like dealing with fire on-board E. 30-question written exam |
11 modules divided across 3–5 days. 1. Know your vehicle 2. Hazard inception 3. Traffic control measure mechanisms 4. Lane management 5. Handling intersections 6. Driving in difficult conditions 7. Speed management 8. Personal factors affecting safe driving 9. Fatigue management 10. Personality development 11. Route risk assessment & defensive driving training |
| Simulator training facility | NA | NA | NA | Yes |
| Minimum experience required for hiring drivers (in years) | 3 | 3 | 5 | 5 |
Source: Authors’ compilation
Motivation for women to become coach captains
In our in-depth interviews (IDIs) with four female coach captains, they mentioned that learning how to drive an e-bus was comparatively easier than learning to drive a CNG or diesel bus. E-buses are also simpler to operate than ICE buses, as changing gears is not a burden here. Driving commands and instructions appear on the dashboard, such as which gear to apply, overspeeding warnings, lane change assistance, forward collision avoidance, and adaptive cruise control. The training on the simulator helped boost driving confidence; thus, it was easier to operate the buses on the road.
Unlike in ICE buses, handling vehicle breakdowns in e-buses is easy. In most cases, restarting the vehicle automatically fixes the issue, reducing stress for the captain. They can even change the tyres of the vehicle alone or with the help of the conductor. This is because of the lighter weight of an e-bus compared to other fuel-powered buses. In the event of a major fault, the back-end team immediately sends a backup vehicle, ensuring minimal disruption of the bus schedule.
Driving convenience
Social benefits
Stated challenges
4.8 Operation of e-buses at mass gathering events
The Maha Kumbh Mela, which happens every 12 years, has been occurring for centuries. The festival finds its roots in the idea of spiritual and physical cleansing, revered deeply in Hindu traditions. The Kumbh Mela, the largest gathering of mankind, was named a UNESCO Intangible Cultural Heritage in 2017. More than 660 million (66 crore) holy dips were counted at the Prayagraj Maha Kumbh 2025, hosted over a period of 45 days.
Table 24. Prayagraj city statistics in the context of Maha Kumbh 2025
| Attribute | Value |
|---|---|
| Area of Prayagraj | 367 sq km |
| Area of tent city | 40 sq km |
| Population of Prayagraj | 11,12,544 |
| Estimated pilgrims | 450 million (45 crore) |
| Mode of travel within the tent city | Walking, two-wheeler, e-rickshaws |
Source: Office of the Registrar General & Census Commissioner, India. Census of India 2011: Provisional Population Totals. New Delhi: Government of India, 2011. , Prayagraj Mela Authority
Table 25. Bus operation specifications of Prayagraj during Maha Kumbh 2025
| Attribute | Value |
|---|---|
| Fleet type | E-bus |
| Area of operation | Intra-city |
| Year of operation | 2025 |
| Fleet size | 200 |
| Number of routes | 17 |
| Route length in km (min–max) | 203 (5–45) |
| Age of fleet (in years) | Avg. 3 years |
| Number of depots | 4 |
| Number of chargers | 40 |
| Number of drivers | 500 |
| Number of conductors | 500 |
| Avg. utilisation per bus per day (km/bus/day) | 149 km per day and maximum 267 km per day |
Transportation during the Maha Kumbh
The Government of Uttar Pradesh anticipated that a huge number of pilgrims will be attending the Maha Kumbh, requiring well-coordinated and integrated infrastructural planning. To achieve this, over 2,600 CCTV cameras were installed for real-time crowd management, supported by AI-driven crowd density mapping to ensure efficient control and safety. An integrated command and control centre (ICCC) was set up at the Maha Kumbh to enable one-stop, real-time monitoring and coordination. In total, 550 intra-city buses, including 200 e-buses, were deployed to ferry pilgrims across the city. The Indian Railways ran 13,450 trains, including special and additional services, to accommodate the massive influx of pilgrims. For inter-city travel, 7,000 UPSRTC buses were deployed to transport pilgrims from various districts across the state and from other states. To enhance connectivity across riverbanks, 30 pontoon bridges facilitated pedestrian movement, reducing pressure on existing road infrastructure.
E-buses in the Maha Kumbh
In a bid to promote sustainable transport, the state government ran 200 e-buses operated by a Greencell/PMI consortium as part of the city’s shuttle bus fleet. These e-buses, with a range of more than 150 km, ran on 17 planned routes that ferried thousands of pilgrims across the city. To achieve this task, the Directorate of Urban Transport, under the aegis of the Department of Urban Development, gathered the fleet from three different cities – 35 buses from the state capital Lucknow, 75 buses from Kanpur, and 40 buses from Agra – adding them to the existing fleet of 50 buses in Prayagraj (Figure 31). These buses offered a safe, affordable, economical, and environmentally sustainable way to move millions of pilgrims while reducing emissions and the reliance on private vehicles. Thus, it demonstrated the potential for e-bus operations in future mass gatherings.
Figure 31. Routes taken by e-buses to reach Prayagraj
Source: Authors’ analysis
State-wide coverage of bus charging infrastructure – potential for rapid expansion
The buses from these three cities made extensive journeys to reach the Maha Kumbh grounds. From Kanpur, fully-charged buses made a 200 km-long journey on a single charge, fully testing their abilities. Buses from Agra made a journey of more than 800 km, using the charging depots of the nearest e-bus operating cities on their way to Prayagraj—Agra, Aligarh, Moradabad, Bareilly, Shahjahanpur, Lucknow, and Ayodhya. Similarly, buses from Lucknow arrived at Prayagraj through Ayodhya. An e-bus can travel from Meerut to Varanasi and from Gorakhpur to Jhansi, making a journey of more than 800 km and 600 km across the extreme ends of the state, by using the current charging infrastructure of city bus services. Thus, Uttar Pradesh can boost e-bus coverage for the entire state due to its strategically-placed depot locations/SPV city e-bus services. Further, this phenomenal journey also shows the state‘s investment in public transportation and charging infrastructure coverage, highlighting the capacity of the state to expand its e-bus network rapidly.
Figure 32. Uttar Pradesh offers state-wide coverage of e-bus charging infrastructure
Source: Authors’ analysis
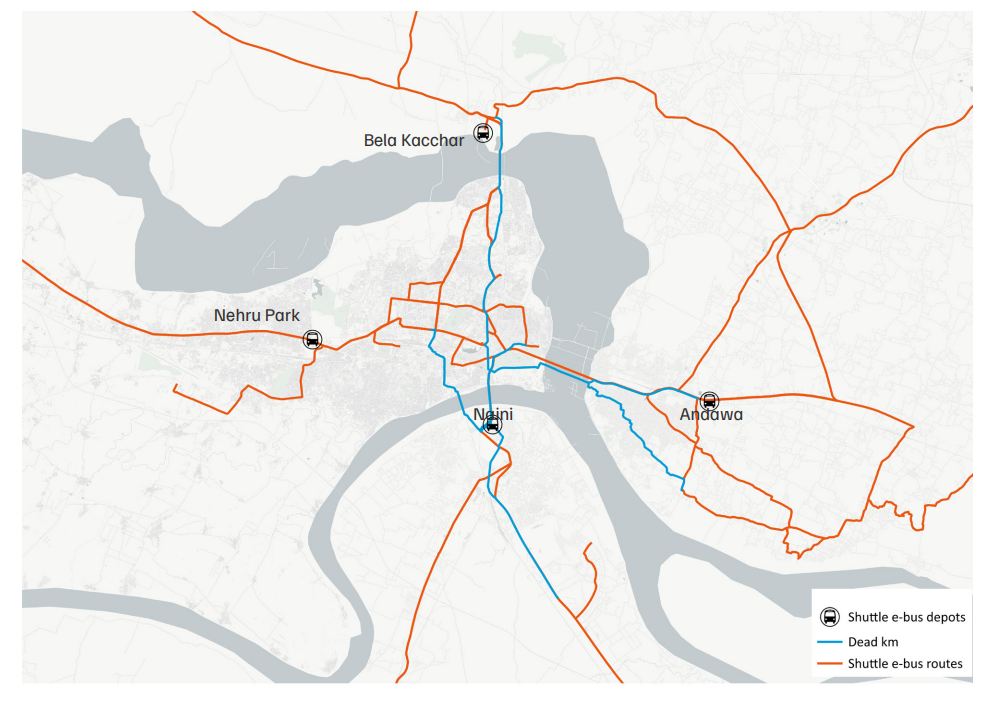
Temporary infrastructure development and deployment of workforce
For the operations of these e-buses in Prayagraj, three temporary charging stations were built at Nehru Park (West), Bela Kachar (North), and Andawa (East), along with the existing charging station at Naini (South). The planning of depots and routes were done on major roads (national highways) and parking to ferry people to the Sangam area. These four stations, located along the city‘s four cardinal directions, provided overnight and opportunity charging, preventing dead kilometres and increasing the efficiency of bus operations. Along with the charging depots, tents and other facilities were also developed for e-bus drivers, conductors, and other staff members near the three temporary depots. The temporary depots eased operations, improved operation time, and reduced dead mileage by 40 per cent (Figure 33).
Figure 33. Decentralised temporary depots minimised dead kilometres by 40% in Prayagraj during Mahakumbh
Source: Authors’ analysis
Table 26. Prayagraj Maha Kumbh charging infrastructure and depot planning
| Depot name | Number of buses | Number of chargers | Type of charger | SPV | Depot planning |
|---|---|---|---|---|---|
| Bela Kachar | 50 | 10 | Fast | Agra (40), Kanpur (10) | Traffic from Lucknow |
| Nehru Park | 50 | 10 | Fast | Kanpur (15), Lucknow (35) | Traffic from Kanpur Highway |
| Andawa depot | 50 | 10 | Fast | Kanpur (50) | Traffic from Ayodhya, Varanasi, Gorakhpur, and Bihar |
| Leprosy/Naini depot | 50 | 10 | Fast | Prayagraj (50) | Traffic from Chitrakoot and Madhya Pradesh |
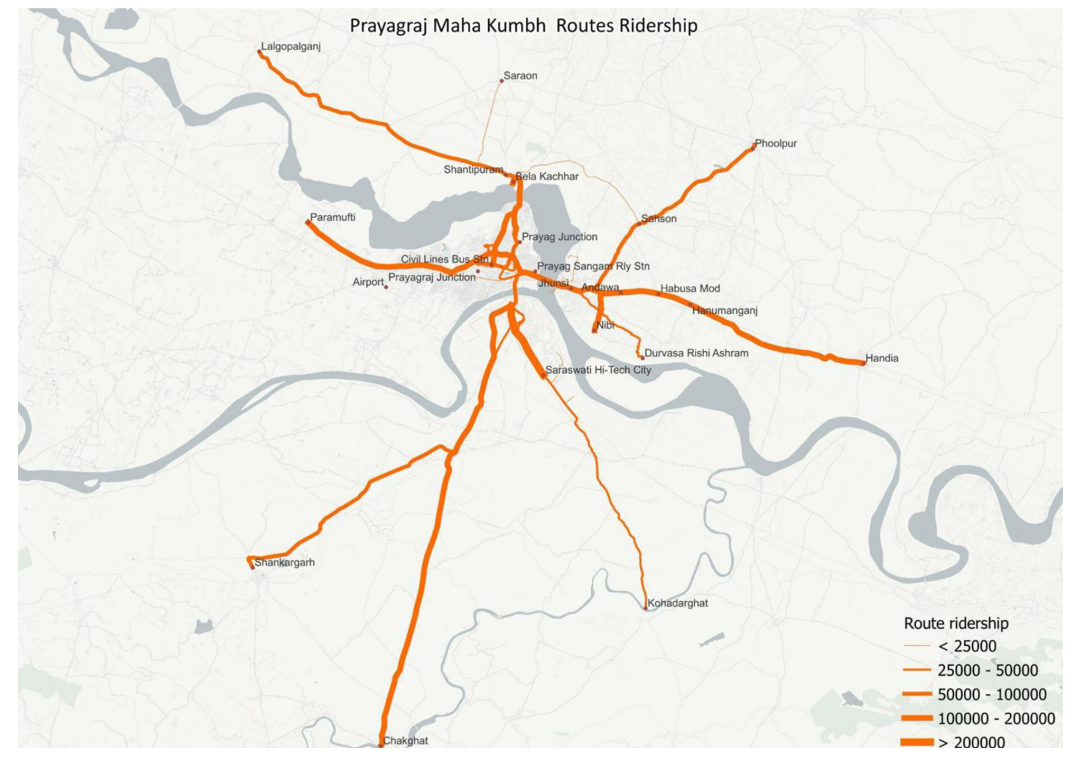
Figure 34. Over 50% passengers were concentrated on 8 ETM routes
Source: CEEW analysis using data from Directorate of Urban Transport and Prayagraj City Transport Service Limited
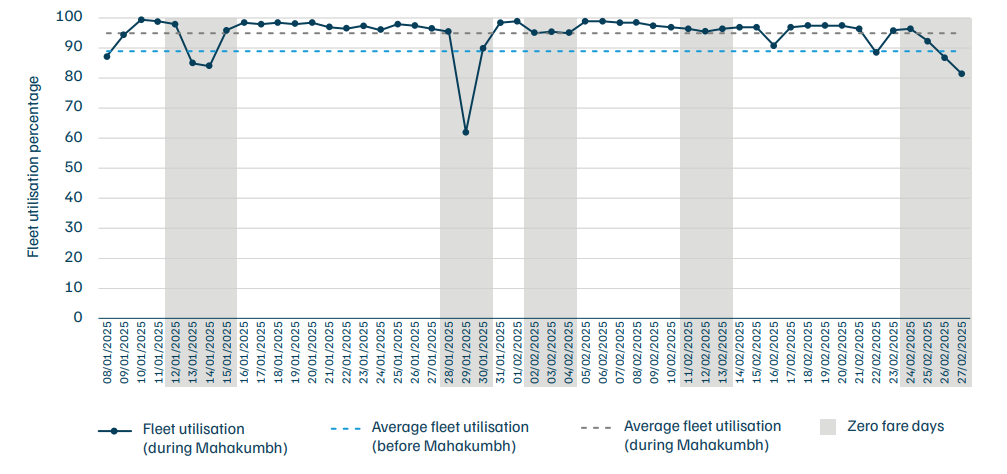
E-buses began operating for the Maha Kumbh on 8 January 2025, with a fleet uptime of over 95 per cent (Figure 35), except during the Amrit Snan of Mauni Amavasya (new moon on 29 January 2025), during which huge number of devotees congregated in the city, which impacted e-bus operation. E-buses operated on a total of 43 ETM routes. Out of this, 8 key routes accommodated 50% of total passengers . These routes linked major halt points (Chakghat, Jhunsi, Puramufti, Bela Kachhar) on the city periphery to the Sangam area.
Figure 35. Fleet utilisation stayed consistently above 95% during the Mela period, except on some zero-fare days due to high pilgrim rush
Source: CEEW analysis using data from Directorate of Urban Transport and Prayagraj City Transport Service Limited
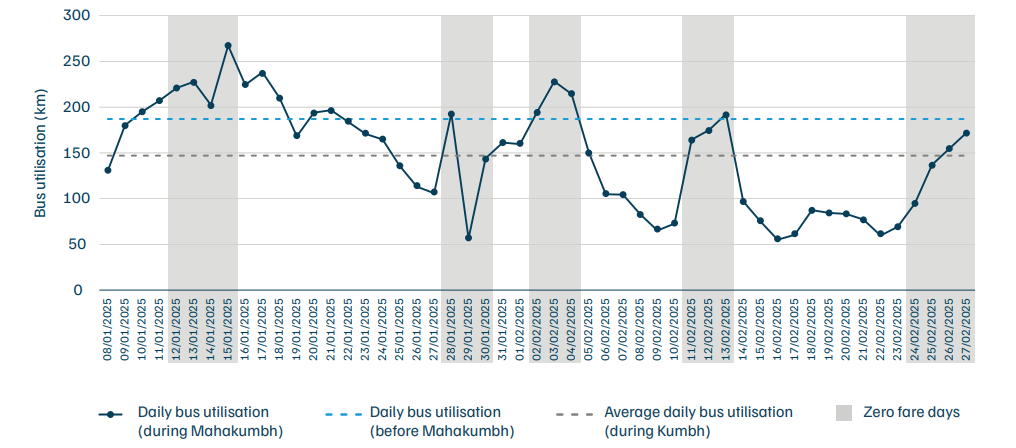
Figure 36. Bus utilisation during the Maha Kumbh was lower than pre-Kumbh levels, primarily due to increased pilgrim rush
Source: CEEW analysis using data from Directorate of Urban Transport and Prayagraj City Transport Service Limited
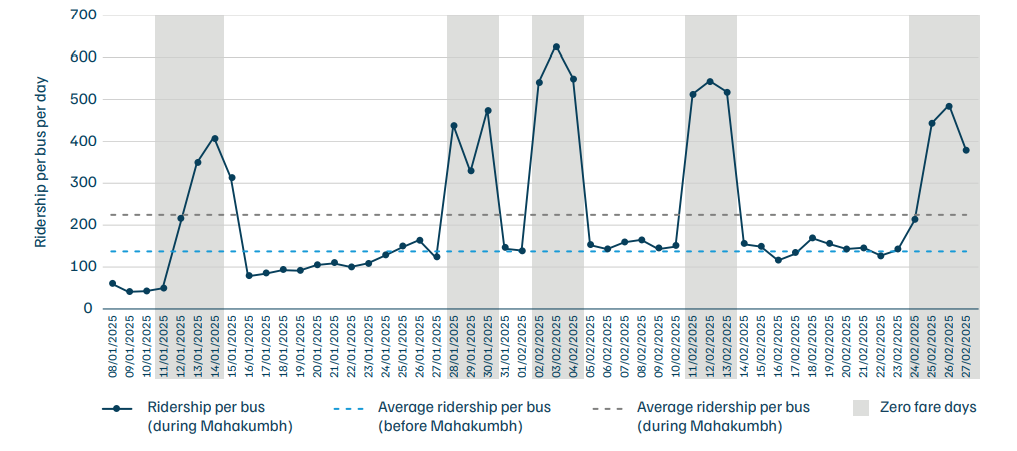
Operating from 8 January onwards, 200 e-buses consistently completed 1.48 million (14.8 lakh) km or more as per ETM records , making the average bus utilisation 147 km per bus per day during the Maha Kumbh. Also, the maximum bus utilisation crossed 250 km on 15 January 2025 (Figure 36), which has rarely been achieved since the launch of these e-buses in UP. Congestion, in fact, led to the under-utilisation of buses. More than 2.1 million (21 lakh) people travelled in shuttle e-buses (Figure 37). Based on field visits and expert insights, actual ridership is estimated at ~400 passengers per bus per day, compared to the recorded 224—this is likely underreported due to overcrowding which caused difficulty in ticketing. Further, shuttle e-buses operated with zero fare on Snan days, as well as the day before and after. A major spike in ridership–approximately 60 per cent of the total ridership–was recorded during these days (Amrit Snan days with zero fare). SPV-wise ridership shows that buses of Agra SPV ferried the most passengers (0.62 million), followed by Kanpur (0.6 million), Prayagraj (0.53 million), and Lucknow (0.37 million) (approximate figures). A maximum of only four buses faced minor breakdowns on any particular day, with an average daily breakdown rate of 3.5 buses per day.
Figure 37. Average ridership during Amrit snan days was recorded to be 2 - 3 times higher than the average ridership during the Kumbh
Source: CEEW analysis using data from Directorate of Urban Transport and Prayagraj City Transport Service Limited
During the Maha Kumbh, the operation of e-buses presented both challenges and benefits for both its users and staff. Given the overwhelming number of pilgrims from diverse backgrounds, managing smooth operations from 5 a.m. to 10 p.m. was a demanding task for the staff. The staff was well-trained and managed to provide a seamless service and convenience to passengers despite the crowds. On interacting with pilgrims who had used the e-buses, we learnt that the e-buses had offered a cost-effective alternative, as private operators had charged super-high fares for e-rickshaws and two-wheelers, making them unaffordable. The air-conditioned buses with comfortable seating provided a much-needed respite from the congestion and chaos; however, overcrowding remained an issue due to the high demand.
Table 27. Emissions averted with e-buses during the Mahakumbh
| Emission type | Operated kms | Emission per km | Total emissions averted (in kgs) |
|---|---|---|---|
| PM | 14,80,371 | 0.0172 | 25.5 |
| NOx | 0.7908 | 1170.7 | |
| CO | 4.7273 | 6998.8 |
Emission factor source: Automotive Research Association of India (ARAI)
E-bus operations during the Mahakumbh resulted in fuel savings of about 3.7 lakh litres of diesel (at fuel efficiency of 4 km per litres), leading to substantial financial and environmental benefits. The shift to e-buses helped avert about 26 kgs of PM, 1171 kgs of NOx and 7000 kgs of CO.
Stated challenges
Despite the smooth completion of the herculean task of operating buses at the Prayagraj Maha Kumbh, officials, staff, and passengers of e-buses stated the following challenges:
Buses remain a critical mode of transport across the country, providing access to jobs, education, healthcare, and recreation venues. Most buses (over 50 per cent) are deployed for school, staff, and public transport–related services. CEEW’s TTFM model predicts that by 2047, around 3.34 million (33.4 lakh) buses will be on-road. In a BAU scenario, it estimates that 42 per cent of new sales of buses will be electric and that about 30 per cent of the on-road stock will be electric in 2047.
With the introduction of national schemes like the PM e-Bus Sewa scheme, the intra-city e-bus sector has grown over the past decade. The projected annual supply of over 40,000 e-buses highlights that India’s e-bus market is poised for rapid expansion. The study finds that bus manufacturing and its operations will create annual total jobs to the tune of about 5.14 million (51.4 lakh) jobs by 2030 and 10.11 million (1.01 crore) jobs by 2047. Thus, e-buses are bound to bring sweeping changes across the bus sector. However, it is crucial to understand the key characteristics, learnings, and issues of early e-bus initiatives.
E-buses are cost-prohibitive for upcoming CTUs due to their high capital costs, exacerbated by charging and range limitations. Schemes like FAME II and PM e-Bus Sewa can help address the issues using GCC models, but the eligibility-based distribution of subsidy and the sunset clause imply that scale-up is limited. Here, Guwahati’s new contractual model, the ‘fixed-cost operating model’ of utilising Smart Cities funds to procure e-buses can assist aspirational cities in ramping up their public transport.
By implementing a fixed-revenue structure, ASTC ensures profitability for itself, including third-party operators. The fixed-revenue model of operation was made possible as the e-buses were procured using the Guwahati Smart City Fund, making the capital costs competitive for ASTC. To materialise the revenue, the operators pay fixed standing and running charges to ASTC, which guarantees a stable income of around INR 75 lakh per month without any burden of e-bus operations.
Despite challenges like infrastructure demands, high operational costs, and occasional schedule disruptions, the city authority can successfully make an earning of INR 9 crore annually, which can break even in 10 years while providing efficient public transport services.
E-bus uptake has been limited to intra-city bus operations, as most government schemes provide e-bus subsidies to public bus operating companies. However, private operators represent over 80 per cent of the bus market. Learnings from private operators highlight that with rising voluntary non-financial environment declarations under Scope 3, companies are willing to invest in e-buses for their employees’ transport needs. Further, inter-city luxury e-bus services by the private operators highlight that e-bus utilisation is increasing across more use cases and operators. These new avenues, like staff and inter-city e-bus operations for businesses, have attracted private-sector investments in e-bus operations, making both an environment and business case for the involved stakeholders.
Following the introduction and operation of intra-city e-buses in Indore, Chartered Speed added another set of 10 e-buses to its fleet in 2022, which operate as staff buses between GIFT City and Ahmedabad. It aims to electrify its entire bus fleet of approximately 2,000 buses in the coming years, which is in line with the country’s net-zero vision. The transition will begin with its inter-city fleets, replacing the existing 350 diesel buses operating in B2C mode. As part of the first phase, the company has already placed an order of 900 e-buses.
In 2024, SUN Mobility, a key provider of swapping infrastructure, partnered with Veera Vahana to introduce the first 10.5-metre swappable buses for inter-city routes and mofussil routes in Bengaluru. Swappable-battery buses cost significantly lesser (INR 60–75 lakh per bus) than fixed-battery buses (INR 1.8 crore per bus), reducing upfront costs and encouraging commercial EV adoption.
As observed in Gandhinagar and Surat city bus operations, high battery replacement costs pose significant challenges for the long-term viability of e-buses. Further, battery degradation challenges, as seen in Indore’s and Guwahati‘s city e-bus operations experience, as well as e-buses’ susceptibility to breakdown during waterlogging, highlight the technology‘s limitations. However, the efforts of CTUs in Prayagraj, Surat, and Indore, to decentralise charging infrastructure and optimise the charging schedule, along with learnings from battery-swapping and batteryretrofitting models, highlight that operational and technological innovations can reduce the burdens faced.
The study documents a series of initiatives that highlight the growing preference for e-buses among various stakeholders, including operators, industry partners, drivers, and riders. However, catapulting the technology‘s adoption requires coordinated efforts. Thus, we suggest a three-pronged approach to strengthen this nascent sector – more private investment, pilot projects, and robust research and development (R&D) – as explained below.
Facilitate mandatory data sharing on battery cycle utilisation
Promote shared charging infrastructure
Mandate niche use cases
This study presents learnings from India’s early e-bus initiatives, highlighting how different cities have tackled key operational and technology challenges, including showcasing newer operational avenues of e-buses. It highlights innovative strategies adopted by CTUs/STUs and private players to tackle challenges like high upfront capital costs, declining battery efficiency at the end of life and high dead kilometres. The report further explores emerging operational avenues in the e-bus sector, including staff and intercity luxury buses, along with unique innovations by private players such as bus retrofitment and battery swapping.
Despite these promising developments, several challenges persist. These include limited visibility and data of battery usage, degradation and lack of preferred location land for depots, difficulties in achieving financial viability before and including battery replacement, and the scalability challenges of battery swapping and retrofitment technologies. To add to the concerns - the EVs are still a comparatively nascent sector and newer battery chemisteries, and energy storage technologies are rapidly evolving. While several countries have adopted a single focus to EVs, India has adopted a multi-fuel strategy, thus only specific bus usecases that gain substantial economic and environmental benefits are likely to transition to e-buses. Given the evolution, the sector will mature and stabilize only over the next decade.
We plan to further deep-dive in high potential use-cases over their life to document and study in detail various aspects including battery cycles, degradations, and viable financial and operational models. While documenting case study supplies adequate data and real-life situations to model, addressing these issues will require coordinated efforts from national and state governments, transit agencies, OEMs, and service providers.
E-buses are central to India’s clean mobility transition because buses remain the most affordable and widely used form of public transport, carrying nearly 390 million passengers daily. Diesel buses still dominate, accounting for 95 per cent of sales, but they contribute heavily to oil imports and urban air pollution. By switching to e-buses, India can cut fuel dependency, reduce greenhouse gas emissions, and improve urban air quality. At the same time, electric buses lower operating costs - 31 per cent cheaper than diesel and 18% cheaper than CNG buses—making them more economical in the long run.
Every new bus adds 4-5 jobs and supports employment alongside climate action. According to CEEW’s Transportation Fuel Forecasting Model (TFFM), by 2047, India will have around 3.34 million buses on the road, of which nearly one-third will be electric. This expansion will generate 10.1 million jobs (1.01 crore) in total, with 9.6 million in operations (drivers, conductors, cleaners, depot staff) and 0.5 million in manufacturing. E-buses are slightly more job-intensive than diesel buses, as they require additional staff for charging and their maintenance. This means the shift to electrification will directly support livelihoods while boosting domestic manufacturing of batteries, electronics, and bus components.
The uptake of buses varies widely across states. Maharashtra (13.4 per cent), Tamil Nadu and Karnataka (9 per cent each), Haryana (7.8 per cent), Madhya Pradesh (6.5 per cent), and Rajasthan (6.3 per cent) accounted for 52 per cent of registrations in 2023-24. Delhi has emerged as a national e-bus leader, operating nearly 2,000 e-buses by 2024 with another 1,000 planned in early 2025. Under the Grand Challenge Phase-II tender, Delhi aims to raise the share of e-buses in its fleet from 2 per cent in 2022 to 70 per cent by 2025. Other promising zones include Gujarat’s Kevadia (India’s first EV-only tourist zone) and Himachal Pradesh’s Rohtang Pass, where diesel buses are restricted in favor of e-buses.
How States can Build Capacity for Urban Mobility Officials:
Can Indian Highways Support Zero-Emission Trucking?
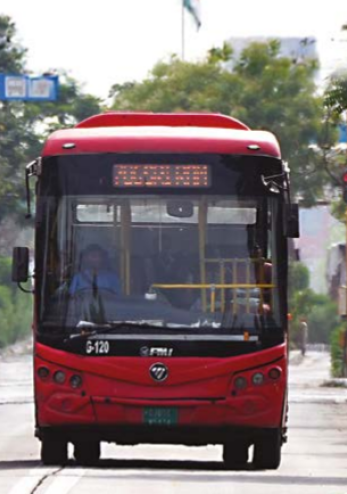
India On The Move:Stories of people driving the bus sector
How can India Accelerate Electric Three-wheeler Adoption?
How can India Make the Electric Three-wheeler Transition Gender-inclusive?