Council on Energy, Environment and Water Integrated | International | Independent
Suggested Citation: Gupta, Suhani, Ankita Borah and Eshita Kochhar. 2025. Understanding Trends in Dietary Diversity in India: Moving Towards Sustainable Consumption. New Delhi: Council on Energy, Environment and Water.
Over the past 70 years, India has prioritised food security, marked by milestones such as the Green Revolution and the National Food Security Act, 2013, which significantly expanded access to staple grains for millions. As the country continues its development journey, there is a growing consensus that nutrition security, anchored in diverse and balanced diets, must take centre stage. Concomitantly, household spending patterns are shifting. Processed foods and beverages now account for the largest share of household food expenditure.
Against this backdrop, this policy brief draws on the National Sample Survey Office (NSSO) Household Consumer Expenditure Surveys (HCESs) (2011–12 and 2023–24) to examine whether Indian households are consuming an adequately nutritious and diverse range of foods at home. We evaluate whether the inter–food group diversity of household diets meets the dietary levels recommended by the National Institute of Nutrition (NIN) and examine how dietary adequacy varies by socioeconomic status and geography.
The findings illustrate that India faces a dietary quality crisis: the average plate is heavily skewed toward cereals and oils, critically lacking in nutrient-dense foods such as pulses, coarse grains, vegetables, fruits, and nuts, and plagued by rising overconsumption of fats, salt, and sugar. Addressing these imbalances requires a multi-pronged, demographically targeted approach that links production, access, and consumption behavior.
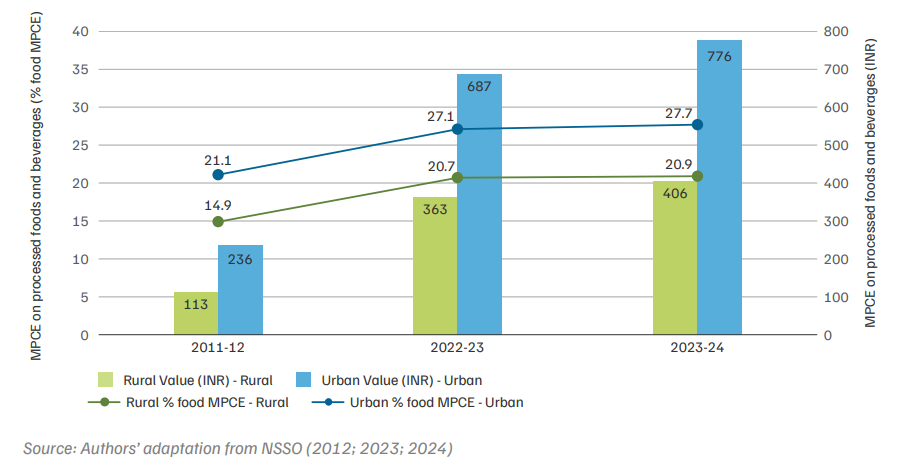
Over the past 70 years, India has prioritised food security, marked by milestones such as the Green Revolution and the National Food Security Act, 2013, which significantly expanded access to staple grains for millions. As the country continues its development journey, there is a growing consensus that nutrition security, anchored in diverse and balanced diets, must take centre stage (Sridharan 2025). Concomitantly, household spending patterns are shifting. Processed foods and beverages now account for the largest share of household food expenditure, as shown in Figure ES1 (NSSO 2024). Against this backdrop, this report draws on the Indian National Sample Survey Office (NSSO) Household Consumer Expenditure Surveys (HCESs) (2011–12 and 2023–24) to examine whether Indian households are consuming an adequately nutritious and diverse range of foods at home.
Figure ES1. Monthly per-capita expenditure (MPCE) on beverages and processed foods has grown to 21 and 28 per cent of the overall food expenditure for rural and urban households, respectively
Research demonstrates that dietary diversity, both within and across food groups, is crucial for enhancing micronutrient intake and improving long-term health outcomes (Bolo et al. 2024). However, a diverse plate does more than nourish people. Dietary diversity also contributes to planetary health by fostering more sustainable patterns of production (Campbell 2019). Amid intensifying climate impacts, the continued narrowing of cropping patterns is making India’s food system increasingly vulnerable. Greater dietary diversity can encourage production diversification and enhance resilience by enabling food systems to adapt to climate and economic shocks (Raveloaritiana and Wanger 2024; Hertel et al. 2021). Resilient systems, in turn, ensure a steady supply of nutritious food while conserving resources, which is a fundamental aspect of sustainability (FAO-INRAE 2020).
Dietary diversity comprises two dimensions: intra–food group diversity and inter–food group diversity.
Together, these forms of diversity reduce the risks of malnutrition, reduce hidden hunger, and lower the risk of diet-related diseases (Chaudhary et al. 2022).
Source: Authors' compilation
This report evaluates whether the inter–food group diversity of Indian household diets meets the dietary levels recommended by the National Institute of Nutrition (NIN). It also examines whether dietary adequacy varies by socioeconomic status. Our analysis is based on direct at-home intake of food items and excludes indirect out-of-home food and nutrient intake from beverages, served processed foods, and packaged processed foods, as the HCES records only expenditure, not quantities, for most of these.
This report evaluates whether the inter–food group diversity of Indian household diets meets the dietary levels recommended by the National Institute of Nutrition (NIN). It also examines whether dietary adequacy varies by socioeconomic status. Our analysis is based on direct at-home intake of food items and excludes indirect out-of-home food and nutrient intake from beverages, served processed foods, and packaged processed foods, as the HCES records only expenditure, not quantities, for most of these.
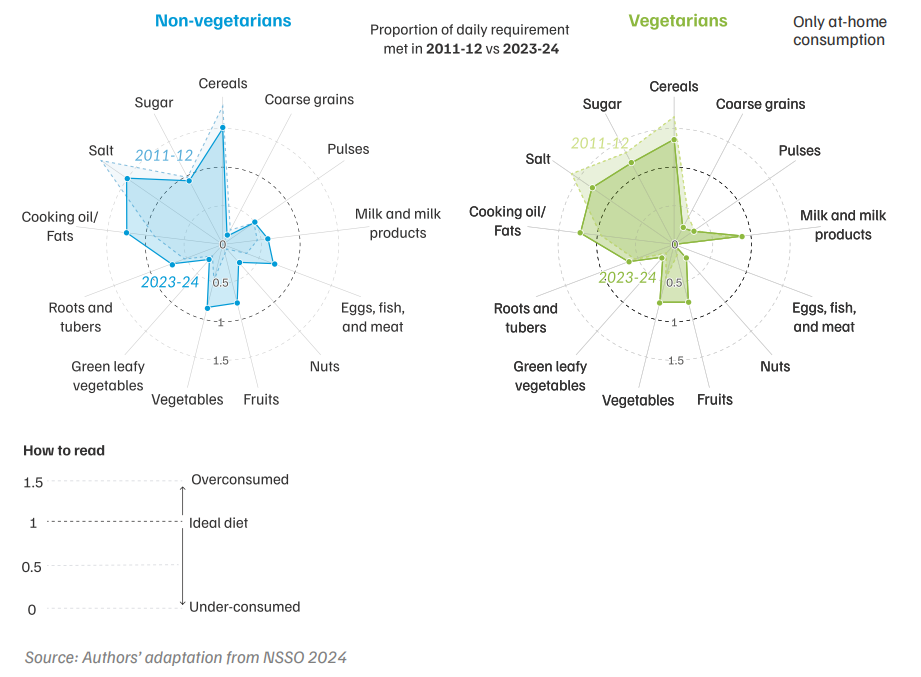
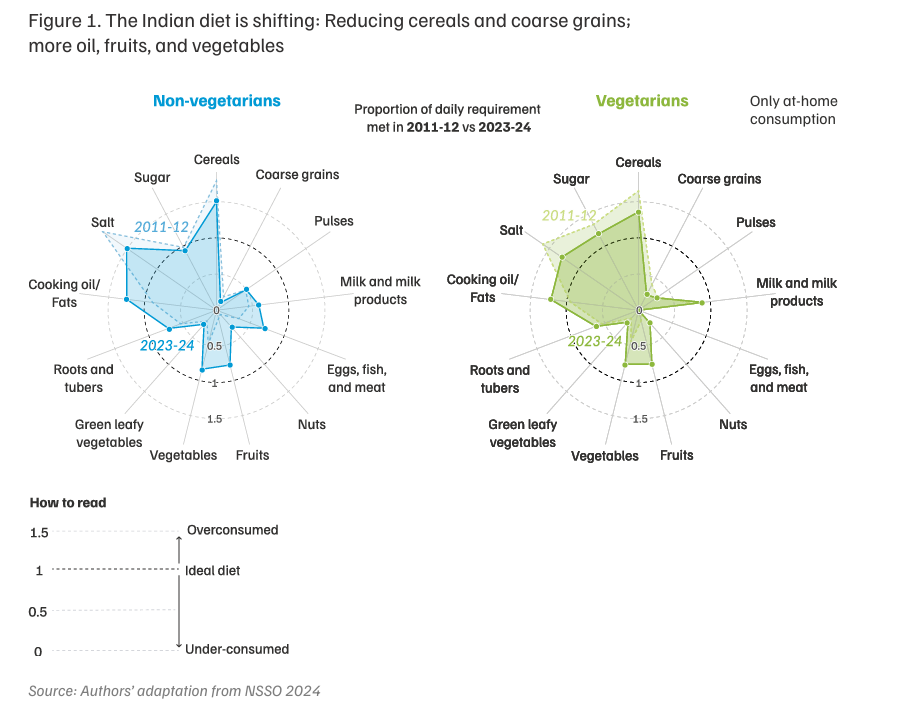
Indians consume approximately 95 per cent of their meals at home, with only 5 per cent eaten outside (MoSPI 2025). Despite some positive shifts over the past decade, the average athome diet remains significantly imbalanced (Figure ES2). Cereals and cooking oil continue to be heavily overconsumed, while nutrient-dense foods, such as coarse grains, green leafy vegetables (GLVs), nuts, roots and tubers, and pulses, remain under-consumed. Additionally, the intake of salt and sugar exceeds recommended levels across demographic groups.
Figure ES2. The Indian diet is shifting: Reducing cereals and coarse grains; more oil, fruits, and vegetables
Here’s how the consumption trends exhibit themselves across primary macronutrients:

According to estimates by the Ministry of Statistics and Programme Implementation (MoSPI), which also include out-of-home and processed food consumption, average daily per-capita protein intake increased only marginally between 2011–12 and 2023–24, from 60.7 g to 61.8 g in rural areas, and from 60.3 g to 63.4 g in urban areas. Our analysis of at-home consumption shows a protein intake of 55.6 g in 2023–24 (Figure ES3), but nearly half of this is derived from cereals (compared to the NIN recommendation of 32 per cent), which are a low-quality protein source. In contrast, high-quality sources such as pulses (11 per cent against a 19 per cent recommendation), dairy, eggs, fish, and meat remain under-consumed.
Dietary diversity comprises two dimensions: intra–food group diversity and inter–food group diversity.
Source: Authors' compilation
While protein diversity has improved overall, it remains inequitable. Protein intake rises with income, with the top decile consuming 1.5 times more protein than the bottom decile. The share of animal-based proteins also increases significantly with income. The lowest decile obtains only half as much of their daily protein from animal sources as the top decile. In the lowest rural decile, direct intake of milk and milk products is just 28 per cent of the RDA, while in the top decile, it exceeds 110 per cent, with actual consumption likely double once processed dairy (ice creams, dairy beverages, sweets, etc.) and out-of-home sources (restaurants, tea stalls, etc.) are included (The Dairy Site 2025). Similarly, for eggs, fish and meat, intake rises from just 38 per cent of the RDA in the lowest rural decile to 123 per cent in the top decile. Pulses remain consistently below the RDA across deciles, from 30 per cent of the RDA in the bottom decile to 62 per cent in the top rural decile. Nationally, the share of pulses in the protein basket has declined over the past decade, while the intake of milk, eggs, fish, and meat has increased, particularly among the higher deciles.
India’s protein intake landscape is also shaped by pronounced regional diversity, particularly across regions with vegetarian and non-vegetarian dietary patterns (Annexure III). Each state relies on one primary source of protein – pulses, dairy, or eggs, fish, and meat – reflecting local food preferences, availability, and cultural norms (Figure ES4). In predominantly vegetarian states in northern India, such as Rajasthan, Haryana, and Gujarat, dairy products emerge as the primary source of high-quality protein. In contrast, in largely non-vegetarian regions, such as the northeast, coastal south, and parts of eastern India, eggs, fish, and meat play a more dominant role. Nevertheless, consumption of quality protein, as defined by NIN norms, remains a concern. Pulses are under-consumed even in states with predominantly vegetarian diets (Annexure IV), and no state achieves near-adequate pulse intake levels. For low-income vegetarians, animal proteins are often unaffordable and/or unacceptable, making pulses the most practical protein source. These patterns underscore the need for regionally tailored nutrition strategies that consider local dietary patterns while promoting increased quality and diversity of protein intake.
Figure ES4. India’s protein plate: Regional preferences for protein sources
Per cent of protein requirement met (low to high) for states meeting at least 50 per cent of the recommended intake in the protein source
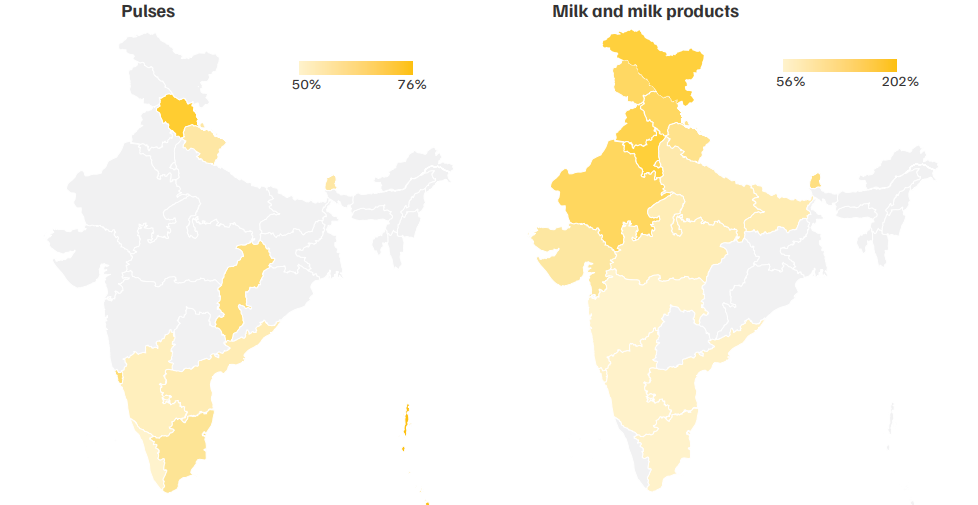
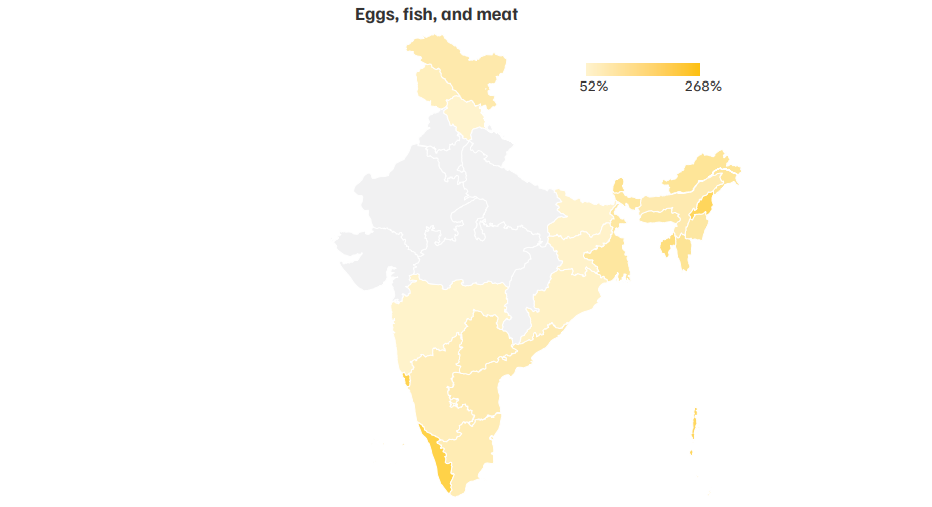
Source: Authors’ adaptation from NSSO 2024
Note: Every state meets at least 50 per cent of the recommended intake in at least one protein source – pulses; dairy; or eggs, fish, and meat – highlighting region-specific protein preferences.
Cereals: Nearly three-fourths of daily carbohydrates
Coarse grains: Sharpest decline in consumption
Sugar: Strong correlation with dietary preferences
Vegetables, pulses, and nuts: Under-consumed across income levels
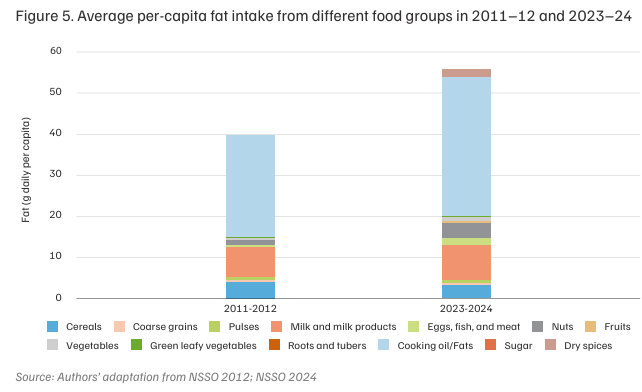
Figure ES6. Cooking oils/Fats dominate dietary fat intake in India
Current average fat intake is nearly 2.5 times the RDA, driven by both direct and indirect sources. Of the total, 55.5 g is consumed directly at the household level (Figure ES6) – up from 39.6 g in the last decade – while an additional 6 g per person per day is estimated to come from refined oils in processed and packaged foods (ICMR-NIN 2020). According to MoSPI, the total daily fat intake is 69.8 g in urban areas and 60.4 g in rural areas (MoSPI 2025).
The overuse of refined cooking oils poses increased cardiovascular and inflammatory risks due to high omega-6 to omega-3 ratios (Gunnars 2025). Additionally, overheating leads to the formation of toxic compounds (Manchanda and Passi 2016; NNMB 2017), processing-related oxidation, and the potential generation of trans fats during repeated heating (Loganathan et al. 2022). Together, these factors elevate the risk of heart disease, obesity, and metabolic disorders (Siri-Tarino et al. 2010).
Source: Authors' compilation
The proportion of households consuming more than 1.5 times the RDA of fat has more than doubled over the past decade, from 32.5 per cent to 67.3 per cent. Fat intake also varies sharply across expenditure deciles, with the top decile consuming almost twice as much fat as the lowest, driven by the higher consumption of edible oil, milk, and nuts.
Nuts, seeds, fish, meat, and eggs – all rich sources of omega‑3s – remain under‑consumed, accounting for only 10 per cent of daily fat intake on average (and just 7 per cent in the lowest decile), compared to the recommended 25 per cent. Diversifying fat sources towards whole foods and minimally processed options with healthier fat profiles by improving intake of nuts and seeds and diversifying within edible oils can reduce cardiovascular risk (Arnesan et al. 2023).
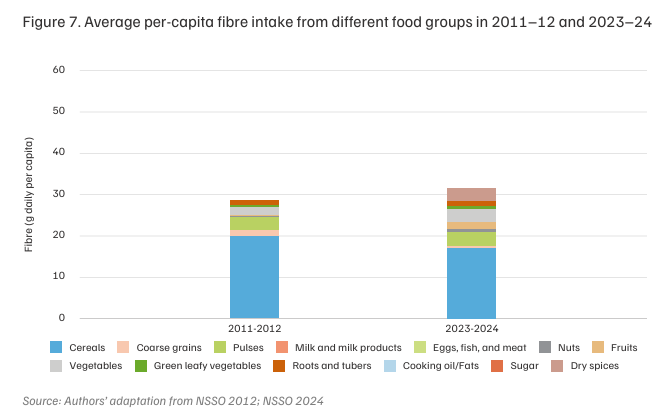
Figure ES7. Most fibre comes from cereals; intake from pulses, nuts, and fruits is below recommended levels
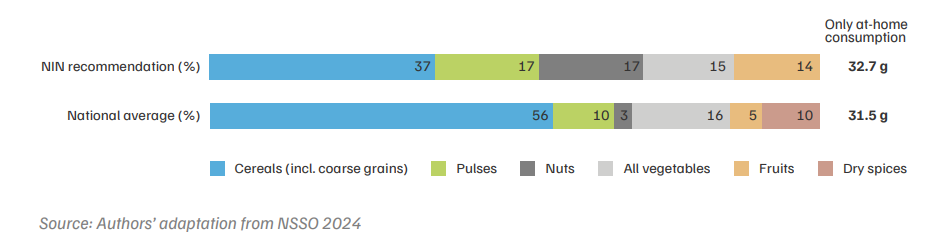
Source: Authors’ adaptation from NSSO 2024
The average fibre intake increased from 28.4 g in 2011–12 to 31.5 g in 2023–24, against an RDA of 32.7 g. However, 42 per cent of households still fall short of daily fibre requirements, consuming less than 90 per cent of the RDA.
The lowest decile sources only 0.7 g of fibre from fruits per day, equivalent to eating two bananas a week. Individuals up to the third decile are unable to meet a daily fibre intake of 30 g, while it is only from the seventh decile onwards that households begin to meet daily fibre requirements. Ideally, around half of daily fibre should come from pulses, fruits, and nuts, but these together contribute only 18 per cent (Figure ES7). Among vegetables, GLVs, which are essential for addressing ‘hidden hunger’ caused by micronutrient deficiencies, remain critically underconsumed. Within roots and tubers, potatoes dominate consumption, and among fresh vegetables, onions and tomatoes account for over 40 per cent of the total consumption, indicating limited intra–food group diversity. Inadequate fibre and low diversity of sources are associated with digestive problems, poor gut microbiota health, and higher risks of chronic conditions such as type-2 diabetes and colorectal cancer (Kaye et al. 2020).
North and northeast India demonstrate a diverse fibre intake, with states such as Himachal Pradesh, Punjab, Sikkim, and Arunachal Pradesh reporting a high and balanced intake of fruits, vegetables, and roots. By contrast, southern diets are weak in GLV intake, while eastern and central India demonstrate low fruit and GLV intake.
Indians consume around 11 g of salt per day, more than double the World Health Organization’s recommended limit of 5 g per day (WHO 2025). Of this, over 7 g comes from at-home consumption, with the remaining 4 g likely sourced from processed and out-of-home foods (Eat Right India n.d.).
Although India’s per capita at-home salt overconsumption has declined over the past decade, this does not account for salt consumed through prepared and processed foods, the consumption of which has doubled in the same period (Food Marketing & Technology 2023; WHO India 2023).
Dietary gaps in India vary widely by income level, geography, and dietary pattern, requiring tailored interventions. We propose three targeted recommendations to promote dietary diversity while addressing distinct dietary risks:
Enabling dietary transformation requires coordinated roles across governments, markets, and society
Several initiatives by these actors are already underway; however, greater coordination, integration, visibility, and focused direction are needed to enhance public health outcomes and mitigate the growing burden of diseases. By addressing the interconnected issues of cereal diversification, protein quality, moderation of fat consumption, and increased intake of micronutrient- and fibre-rich foods, India can transition towards more balanced, nutritious, and sustainable diets.
Understanding dietary patterns and consumption behaviours is essential to addressing India’s public health and nutrition challenges. These challenges are shaped by the country’s cultural diversity, socioeconomic complexities, and regional dietary preferences. While progress has been made in strengthening food security, India continues to face a triple burden of malnutrition, encompassing undernutrition (stunting, wasting, and underweight), overnutrition (non-communicable diseases and obesity), and micronutrient deficiencies, often referred to as ‘hidden hunger’ (WHO 2024; Thomas Ipe et al. 2022).
Dietary diversity is a cornerstone of a well-balanced diet. Consuming a variety of foods within and across food groups ensures a comprehensive intake of essential nutrients for overall health and well-being (Dello Russo et al. 2023). Diversity within a food group enhances micronutrient intake, while diversity across groups provides a balanced intake of macronutrients, including carbohydrates, proteins, and fats (Slavin and Lloyd 2012). Conversely, limited dietary diversity or overreliance on specific food items can lead to a nutritional imbalance (Kennedy et al. 2010). For instance, overconsumption of refined grains may lead to insufficient fibre intake, while diets deficient in protein-rich foods can contribute to protein-energy malnutrition (Slavin 2003; Slavin 2005). To mitigate these risks, the National Institute of Nutrition (NIN) has established daily dietary intake guidelines that emphasise balanced and diverse consumption to meet nutritional needs (ICMR 2024).
This report builds on previous assessments of India’s food and nutritional intake (MoSPI 2025, Kapoor et al. 2024) and aims to evaluate the extent to which daily NIN-recommended intake levels are met across different food groups, nutrients, and population subcategories. Using national datasets, NSSO HCE surveys 2011–12 and 2023–24, the analysis examines food and nutrient adequacy across monthly per capita expenditure (MPCE) percentile groups and seeks to answer the following questions:
By addressing these questions, this report seeks to contribute to a deeper understanding of India’s dietary landscape and to inform strategies that can enhance nutritional outcomes nationwide.
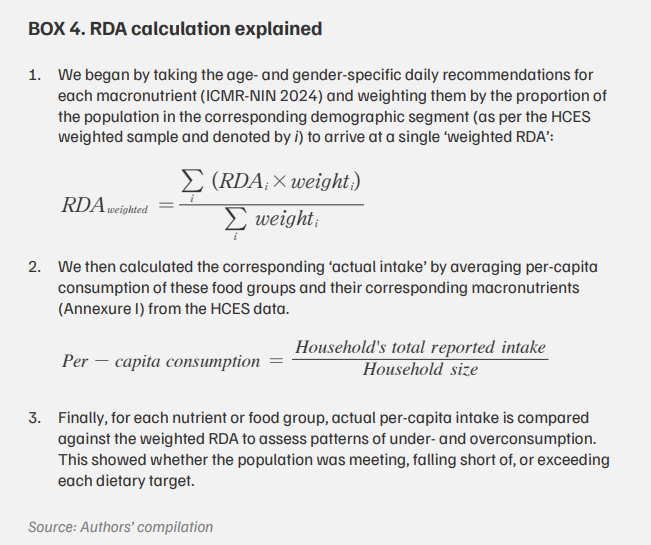
To analyse per-capita dietary and nutritional adequacy in India, we used household food consumption data from the NSSO HCES 2011–12 and 2023–24 datasets. These datasets provide detailed information on food consumption patterns across various socio-economic and geographical contexts. The 2023–24 HCES covers a nationally representative set of 2,61,953 households (1,54,357 rural and 1,07,596 urban) across all states and union territories. The following are the key aspects of our methodology.
Food group intake analysis: We reclassified HCES-defined food items into NIN-defined food groups (such as cereals, pulses, vegetables, and fruits) and adapted their recommended daily minimum dietary requirements (see Table 1). We then assessed under- and overconsumption of these food groups by comparing average per-capita intakes against NIN-recommended daily nutritional intakes.
Table 1. Recommended daily minimum dietary requirements of different food groups
| Food group | For a person who follows a vegetarian diet (in g) |
For a person who follows a non-vegetarian diet (in g) |
|---|---|---|
| Cereals | 188 | 195 |
| Coarse grains | 63 | 65 |
| Pulses | 85 | 55 |
| Milk and milk products | 300 | 300 |
| Eggs, fish, and meat | Not applicable | 70 |
| Nuts | 35 | 30 |
| Fruits | 100 | 100 |
| Vegetables | 199 | 199 |
| Green leafy vegetables | 101 | 101 |
| Roots and tubers | 101 | 101 |
| Cooking oil/Fats | 27 | 27 |
| Salt | 5 | 5 |
| Sugar | 25 | 25 |
Source: Authors’ compilation from ICMR-NIN (2024)
Subsequently, we calculated the proportion of the requirement met for each food group to determine the degree of under- or overconsumption across population groups. For any food group,
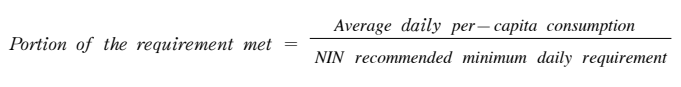
Macronutrient intake analysis: We also calculated the intake of macronutrients (carbohydrates, proteins, and fats) and dietary fibre as derived from the consumption of the reclassified food groups (Annexure I). To identify nutritional gaps, macronutrient intakes are compared against NIN’s recommended daily allowances (RDAs), weighted by population demographics (age and gender).
This report assesses whether food group and macronutrient intake through food directly consumed at home meets recommended dietary levels as prescribed by the NIN, without including the indirect intake of these foods or macronutrients through out-of-home consumption.
BOX 5. A note on the scope of the analysis
a. Our analysis excludes food and nutrient intake from beverages, served processed foods, and packaged processed foods, as the HCES records only expenditure, not quantities, for most of these. For example, while it captures total weekly expenditure on cooked snacks (such as samosas, momos, or dosas), it does not track the quantities consumed.
b. The estimates are derived from direct at-home intake of food and nutrients reported in the HCES, which includes both the total quantity of food commodities used within the household, including their intake in their basic form (e.g., drinking milk) and their use in household preparation of other dishes (e.g., milk used in tea, wheat flour in bread). This is referred to as direct consumption in the context of household-level data. However, indirect consumption, that is, intake through foods prepared or purchased outside the home, such as restaurant meals, packaged snacks, or processed items containing ingredients such as oil, salt, sugar, or milk, is not captured in the HCES. Consequently, total intake of nutrients, such as carbohydrates, fats, sugar, and salt, may be underestimated, since a significant share may come from out-of-home or processed foods. These limitations have been acknowledged, with supplementary insights drawn from relevant secondary sources.
Grouping households by MPCE: Households are grouped by their MPCE percentile into ten uniform decile groups. This approach enables the assessment of the extent of dietary diversity and adequacy across different socioeconomic segments of the population. The deciles, ranging from the lowest 10 percentiles (1–10 per cent) to the highest (91–100 per cent), provide insights into disparities and inequities in food access, affordability, and consumption (Table 2).
Table 2. Distribution of households by MPCE decile groups, ranked in ascending order of expenditure
| MPCE decile group | Percentile group as per MPCE ranked in ascending order |
|---|---|
| 1 | (0,10] |
| 2 | (10,20] |
| 3 | (20,30] |
| 4 | (30,40] |
| 5 | (40,50] |
| 6 | (50,60] |
| 7 | (60,70] |
| 8 | (70,80] |
| 9 | (80,90] |
| 10 | (90,100] |
Source: Authors’ adaptation from NSSO 2024
A comparison of at-home food group consumption between 2011–12 and 2023–24 highlights shifts in dietary patterns across both vegetarian and non-vegetarian households (Figure 1), offering key insights into how diets in India are evolving over time.
3.1 Reduction in cereal overconsumption but worsened coarse grain under-consumption
Average daily per-capita consumption (only at-home) veg: 256 g; non-veg: 293 g (NIN recommendation: veg: 188 g; non-veg: 195 g)
While cereals continue to be overconsumed by a wide margin, about 1.5 times the recommended amount, the extent of overconsumption has declined over the last decade among both vegetarians and non-vegetarians (Figure 1). This suggests a gradual shift away from cereal-heavy diets, aligned with urbanisation research that links higher incomes and changing lifestyles to a diversification of food choices beyond staples. This is a two-staged shift: first towards more diverse, nutrient-rich foods, followed by increasing consumption of processed foods (Pingali et al. 2019). This diversification is accelerating even in rural areas, where the middle class is driving demand for convenience and processed diets (Pandey et al. 2020; Kumar 2022). Together, these insights underline how India’s food landscape is evolving rapidly across both rural and urban contexts.
Within cereals, rice consumption shows a greater decline than wheat, while the consumption of refined starches, such as semolina (suji) and refined wheat flour (maida), has increased. Cereal overconsumption persists across all Indian states (Annexure IV), with particularly high levels in eastern and northeastern states. Manipur reports the highest consumption (195 per cent of the requirement), followed by Chhattisgarh (192 per cent of the requirement).
Coarse grain intake in India has dropped sharply. On average, vegetarians meet only 24 per cent of their daily requirement for coarse grains, while non-vegetarians meet just 12 per cent. This makes coarse grains the most under-consumed food group.
Under-consumption of coarse grains is less severe in states such as Karnataka (74 per cent of the requirement), Rajasthan (52 per cent of the requirement), and Gujarat (44 per cent of the requirement) (Annexure IV), where traditionally grown and preferred coarse grains such as ragi, jowar, and bajra remain a part of local diets. These observations highlight the importance of creating dedicated programmes to encourage cereal diversification and promote the consumption of local coarse grains – not only for their nutritional advantages over staples such as rice and wheat, but also for the environmental co-benefits of their production (Kaur et al. 2012).
3.2 Pulse consumption in decline and deficit
Average daily per-capita consumption (only at-home) veg: 25 g; non-veg: 27 g (NIN recommendation: veg: 85 g; non-veg:55g)
Pulses are an essential source of protein and micronutrients, particularly for vegetarian populations (NIN 2024); yet, they remain the most under-consumed food group in this population segment. Due to the difference in daily pulse requirements between non-vegetarians and vegetarians, the former meet a much higher percentage of their daily pulse requirement (50 per cent) compared to the latter (30 per cent). Arhar (red gram) remains the most consumed pulse, followed by moong (green gram) and masoor (lentil).
Pulses are consistently under-consumed, even in states with predominantly vegetarian diets, with not a single state meeting adequate pulse intake. For lower-income vegetarians, animal proteins are often unaffordable and/or culturally unacceptable, making pulses the most practical and acceptable option, yet they remain under-consumed. Targeted efforts to promote pulse consumption are therefore essential to improve both protein quality and dietary diversity within this population group.
3.3 Milk and animal products showing a rise in adequacy
Milk and milk products - Average daily per-capita consumption (only at-home) veg: 269 g; non-veg: 177 g (NIN recommendation: 300 g)
According to the 2023–24 dataset, individuals following vegetarian diets have increased their at-home dairy consumption to meet 90 per cent of the daily requirement. In contrast, those following non-vegetarian diets meet only 59 per cent of the RDA, with actual consumption likely to double for both groups when processed dairy (such as ice creams, dairy beverages, and sweets) and out-of-home sources (including restaurants, tea stalls, and anganwadis) are included. Liquid milk remains the largest contributor to total dairy consumption, followed by curd and paneer.
Note: For this analysis, we have excluded ghee and butter from the milk products category and instead included them in the cooking oil/fats category.
The consumption of milk and milk products is very high in northern India and very low in eastern and northeastern India. Chandigarh (605 g – 202 per cent of the recommendation) and Haryana (487 g – 162 per cent of the recommendation) exhibit the highest milk consumption, followed by Ladakh, Punjab, Rajasthan, Delhi, Himachal Pradesh, and Jammu and Kashmir. In contrast, Meghalaya (52 g – 17 per cent of the recommendation) and Odisha (62 g – 21 per cent of the recommendation) exhibit a very low dairy intake (Annexure IV).
Eggs, fish, and meat - Average daily per-capita consumption (only at-home) non-veg: 49 g (NIN recommendation: 70 g)
The average at-home consumption of eggs, fish, and meat has increased substantially, rising from 33 per cent of the daily requirement to 70 per cent. Fish and prawns are the main contributors to this category, while eggs remain the least consumed food item by weight. In predominantly vegetarian states in northern India, such as Rajasthan, Haryana, and Gujarat, dairy products emerge as the primary source of high-quality protein. Conversely, in largely non vegetarian regions such as the northeast, coastal south, and parts of eastern India, eggs, fish, and meat play a more dominant role (Annexures III and IV). These regional variations reflect distinct dietary preferences, with either milk or meat functioning as the main protein source. Future dietary recommendations must take these differences into account to effectively address nutritional needs across diverse populations.
3.4 Progress made in nuts and seeds, but potential remains unmet
Average daily per-capita consumption (only at-home) veg: 8 g; non-veg: 9 g (NIN recommendation: veg: 35 g; non-veg: 30 g)
The consumption of nuts and seeds has shown marked improvement, with the share of households meeting adequacy levels increasing from 8 per cent to 31 per cent among non-vegetarians and to 24 per cent among vegetarians since 2011. Groundnuts remain the most consumed type, constituting over half of the daily nut intake, likely due to their affordability and availability.
Although nut consumption has increased, it still falls short of recommended levels of consumption and diversity. Improved market access, greater awareness of health benefits, and rising incomes – particularly in urban areas – have likely contributed to this growth. Continued efforts to promote the availability and consumption of nuts as a healthy source of fat and micronutrients can significantly improve nutritional outcomes and combat diet-related health challenges. Research has linked higher nut consumption to lower risks of chronic diseases, such as cardiovascular conditions and diabetes (Guasch-Ferré et al. 2017).
3.5 Increase in fruit intake but limited diversity
Average daily per-capita consumption (only at-home) veg: 77 g; non-veg: 78 g (NIN recommendation: 100 g)
Fruit consumption has improved significantly over the past decade, with the adequacy of daily requirements being met rising to 78 per cent for non-vegetarians and 77 per cent for vegetarians. Most fruit varieties have shown an increase in intake, with bananas exhibiting the highest increase, rising to an average of 26 g per person per day. However, the consumption of fruits such as berries, litchi, and jackfruit, which are rich in essential vitamins, antioxidants, and dietary fibre, has declined, and together they constitute less than 1 g per person per day (Choudhury et al. 2020).
Despite these improvements, fruit consumption remains below recommended levels. Fruits are critical sources of essential micronutrients, and enhanced efforts to improve their accessibility and affordability can promote better health outcomes and lower diet-related health issues, particularly in states such as Jharkhand and Chhattisgarh, where individuals currently meet only half of the daily fruit requirements (Annexure IV).
3.6 Improvement in fresh vegetable intake; persisting gaps in green leafy vegetables
Average daily per-capita consumption (only at-home) Vegetables - veg: 154 g; non-veg: 168 g (NIN recommendation: 199 g) Roots and tubers - veg: 63 g; non-veg: 71 g (NIN recommendation: 101 g) GLVs - veg: 22 g; non-veg: 27 g (NIN recommendation: 101 g)
Vegetable consumption has improved over the past decade; however, significant gaps still remain. Among the three subcategories – fresh vegetables, roots and tubers, and GLVs – fresh vegetables have the highest average adequacy, followed by roots and tubers. The least adequately consumed food group in 2011–12, GLVs, are now the second least, owing to the even lower consumption of coarse grains. Individuals following non-vegetarian diets meet slightly higher requirements across all three categories of vegetables compared to those following vegetarian diets.
In the case of fresh vegetables, onions and tomatoes account for over 40 per cent of the total consumption for this category, highlighting their central role in Indian diets. However, the prices of tomatoes, onions, and potatoes (collectively known as TOP crops) are more volatile than those of other food groups, such as cereals and pulses. Among these, onion prices are the most unstable (S. et al. 2024). Given their critical role in Indian diets, stabilising their prices remains essential.
For roots and tubers, potatoes dominate consumption, forming the largest share within this category. However, no detailed information is available on the consumption of specific types of potatoes, limiting insights into the dietary diversity within this subgroup.
While essential for addressing ‘hidden hunger’ caused by micronutrient deficiencies, GLVs remain critically under-consumed. Despite modest improvements, 26 per cent adequacy among non vegetarians and 22 per cent among vegetarians, GLVs continue to lag significantly. Their vital role in providing essential vitamins and minerals (UNICEF n.d.; Sreenivasa 2017) makes this deficiency particularly concerning. Additionally, the survey records only common varieties, such as spinach (palak) and cabbage, potentially underreporting traditional and regional varieties of leafy vegetables, such as white goosefoot (bathua), Indian pennywort (brahmi), and dill, which could play a significant role in intra-food group diversity within this category.
The consumption of different types of vegetables is particularly low in western and southern states.
These findings underscore the importance of targeted interventions to promote vegetable consumption, particularly GLVs, as a fundamental component of balanced diets. Efforts to lower costs, improve seasonal availability, and raise awareness about the nutritional benefits of both conventional and traditional leafy vegetables are essential to addressing these deficits effectively.
3.7 Increase in cooking oil intake towards overconsumption
Average daily per-capita consumption (only at-home) veg: 33 g; non-veg: 34 g (NIN recommendation: 27 g)
Current average fat intake is nearly 2.5 times the RDA, driven by both direct and indirect sources. Our analysis of at-home intake indicates that cooking oils have transitioned from being adequately consumed to being overconsumed over the last decade. In 2011–12, non-vegetarians and vegetarians met 89 per cent and 95 per cent of their daily requirements through at-home consumption of cooking oils, respectively, which has now increased to 125 per cent and 122 per cent, respectively. Overconsumption of oils is the highest in Sikkim (185 per cent), Gujarat (177 per cent), and Puducherry (166 per cent), where intake is twice the recommended amount (Annexure IV).
3.8 Salt and sugar remain overconsumed food groups
Salt - Average daily per-capita consumption (only at-home) veg: 6 g; non-veg: 8 g (NIN recommendation: 5 g)
Indians consume around 11 g of salt per day, which is more than double the limits recommended by the WHO and the NIN (5 g per day) (WHO 2025). Of this, over 7 g comes from at-home consumption alone, with the remaining 4 g likely from processed and out-of-home foods (Eat Right India n.d.). At-home salt consumption remains approximately 1.5 times the recommended level among non-vegetarians, despite a decline since 2011–12.
Salt holds a unique place in Indian diets as a primary source of iodine (through iodised salt), which is essential to prevent iodine-deficiency disorders – a significant public health concern (Wu et al. 2002). However, the recommended salt intake of 5 g provides only 75 micrograms (µg) of iodine, which falls short of the daily adult requirement of 150 µg of iodine. Thus, salt intake must remain within safe limits while exploring alternative strategies to maintain adequate iodine levels (Baxter et al. 2022). The WHO recommends replacing regular salt with potassium-enriched substitutes to help reduce blood pressure and cardiovascular risk (WHO 2025).
Sugar - Average daily per-capita consumption (only at-home) veg: 30 g; non-veg: 23 g (NIN recommendation: 25 g)
Sugar overconsumption has declined since 2011. Among vegetarians, at-home sugar intake remains high, at nearly 1.2 times the recommended level, while for non-vegetarians, it stays just within limits. When sugar consumed from processed and out-of-home foods is included, however, total intake is likely to be nearly double the recommended level.
Vegetarian diets in dairy-dominant states often result in excess sugar intake due to a strong positive correlation between milk and sugar consumption (Annexure II), driven by high consumption of tea, sweets, and milk-based processed foods. This process reflects an unintended consequence of limited dietary diversity and cultural preferences. The rising consumption of refined cereals, sugar, salt, and cooking oils presents growing public health concerns, as such dietary patterns are associated with an increased risk of non-communicable diseases (NCDs), including obesity and cardiovascular disorders (Anjana et al. 2022). There is an urgent need for behavioural shifts towards moderated intakes, to help mitigate related health risks.
Overall, non-vegetarians tend to consume slightly more cereals, cooking oil, and salt than the recommendation, but they also achieve higher adequacy in fruits, GLVs, nuts, pulses, roots, tubers, and fresh vegetables. Conversely, vegetarians tend to overconsume sugar and have a higher under-consumption of pulses. However, they also have a higher intake of coarse grains, milk, and milk products.
These findings highlight significant dietary shifts over the past decade, with progress in reducing the overconsumption of cereals, salt, and sugar, as well as an increase in the intake of animal products, fruits, and nuts. However, there is a concerning rise in oil consumption. While these trends reflect changing preferences shaped by urbanisation and economic growth, substantial gaps persist in the consumption of nutrient-dense foods, such as coarse grains, GLVs, and pulses. To better understand the extent of dietary improvement, it is important to examine how many households are meeting the recommended intake levels for key food groups. The following section compares the proportion of households achieving dietary adequacy between 2011–12 and 2023–24, offering deeper insights into changing dietary patterns.
Analysing the proportion of households meeting different levels of daily dietary requirements adds an important layer to the previous average intake analysis, as it captures how intake is distributed across the population. While national per-capita averages indicate overall trends, this analysis reveals how many households meet, fall short of, or exceed recommended dietary norms. It strengthens earlier findings by highlighting the degree of nutritional imbalance present across households, even when average intakes may appear close to recommended levels.
Cereals and coarse grains: The proportion of households consuming more than 1.5 times the recommended amount of cereals declined from 65 per cent in 2011–12 to 45 per cent in 2023–24 (Figure 2). However, high cereal overconsumption remains prevalent among households.
Coarse grains, in contrast, remain severely under-consumed for most households. The proportion of households consuming less than 5 per cent of the coarse grain requirement increased from 76 per cent in 2011–12 to 80 per cent in 2023–24, indicating a worsening trend in foodgrain diversity in India.
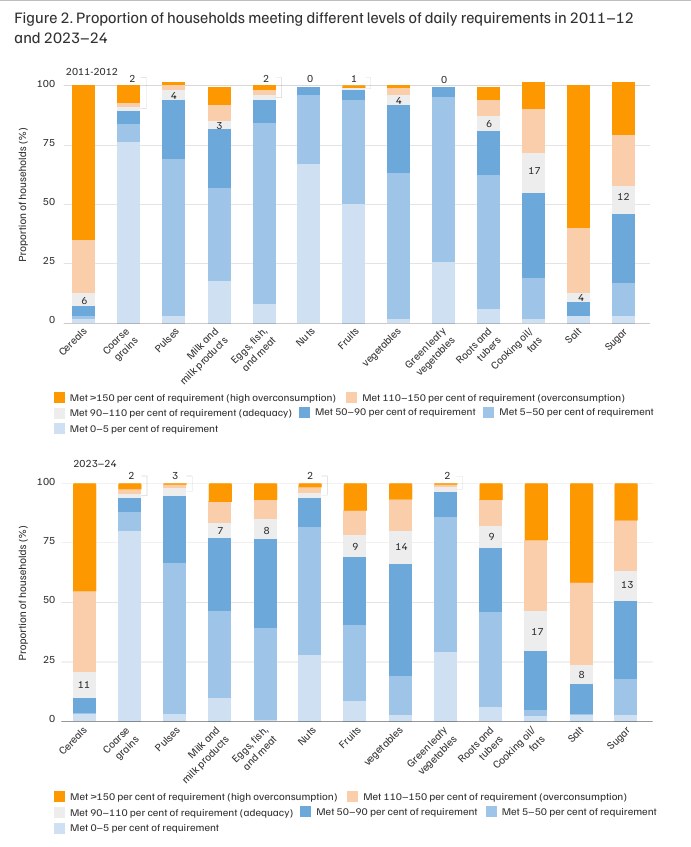
Source: Authors’ adaptation from NSSO 2012; NSSO 2024
Note: The numbers on the grey stacked bars represent the proportion of households meeting 90–110 per cent of the requirement or adequate consumption.
Cooking oils/Fats: Overconsumption has emerged as a growing challenge, with 24 per cent of households consuming more than 150 per cent of the requirement in 2023–24, up from 11 per cent in 2011–12.
Vegetables (Fresh vegetables, GLVs, roots and tubers): Green leafy vegetables remain a challenge, with the share of households consuming less than 5 per cent of their requirement rising from 26 per cent in 2011–12 to 29 per cent in 2023–24.
Roots and tubers, by contrast, have shown improvement, with the proportion of households under-consuming this food group (by less than half of the requirement) decreasing from 62 per cent in 2011–12 to 46 per cent in 2023–24.
Fresh vegetable intake has also improved markedly, with the proportion of households consuming less than half the recommended amount dropping from 64 per cent in 2011–12 to 19 per cent in 2023–24.
Animal products (eggs, fish, meat, and milk): Significant progress has been observed in the consumption of animal-sourced foods. For eggs, fish, and meat, the share of households consuming less than 90 per cent of the recommended daily intake decreased from 94 per cent in 2011–12 to 77 per cent in 2023–24. Furthermore, the proportion of households consuming near-adequate amounts of this food group increased from 2 per cent in 2011 12 to 8 per cent in 2023–24.
The intake of milk and milk products has also improved, with the proportion of under consuming households decreasing from 83 per cent in 2011–12 to 77 per cent in 2023–24.
Fruits and nuts: Fruits and nuts have shown the most significant improvements. For fruits, the proportion of households consuming less than half of the recommended intake declined from 94 per cent in 2011–12 to 41 per cent in 2023–24. Likewise, the proportion of households having an adequate intake increased from just 1 per cent in 2011–12 to 9 per cent in 2023–24.
For nuts, the share of households consuming less than 50 per cent of the requirement dropped from 96 per cent in 2011–12 to 82 per cent in 2023–24.
Salt and sugar: Salt consumption has seen modest improvement. The proportion of households consuming more than 1.5 times the recommended limit fell from 60 per cent in 2011–12 to 42 per cent in 2023–24.
Similarly, visible sugar overconsumption also declined from 22 per cent in 2011–12 to 15 per cent in 2023–24.
In summary, the overconsumption of cereals, sugar, and salt has decreased, whereas the overconsumption of cooking oils has worsened. Concurrently, the under-consumption of nutrient-dense foods has improved, but the under-consumption of coarse grains has worsened.
The following section examines the average daily intake of macronutrients per capita, derived from various food groups, providing a comprehensive view of overall dietary patterns. It also analyses the proportion of households meeting various levels of daily macronutrient requirements, helping reveal how widespread under- or overconsumption are and adding valuable insight into the scale and distribution of nutritional imbalances across the population.
The last decade has seen significant shifts in macronutrient intake trends across Indian households, particularly in the case of fat and protein. The following analysis, which measures the extent of fulfilment of nutrient requirements (as per at-home consumption), has been conducted on a per-capita basis against the nationally weighted RDA as adapted from NIN (Table 3).
Table 3. Macronutrient RDAs as per NIN Dietary Guidelines of India 2024
| Macronutrient | Protein (g) | Fat (g) | Dietary fibre (g) | Carbohydrates (g) |
|---|---|---|---|---|
| National average intake (2011–12) | 51 | 39.6 (24.6 g visible fat) | 28.4 | 316.3 |
| RDA (weighted as per NSSO Sample 2011–12) | 42.2 | 29.8 (only visible fat) | 32.4 | 130 (minimum requirement for bodily functions) |
| National average intake (2023–24) | 55.6 | 55.5 (33.7 g visible fat) | 31.5 | 293.0 |
| RDA (weighted as per NSSO Sample 2023–24) | 43.7 | 29.7 (only visible fat) | 32.7 | 130 (minimum requirement for bodily functions) |
5.1 Protein: Improvement in intake, but quality remains concerning
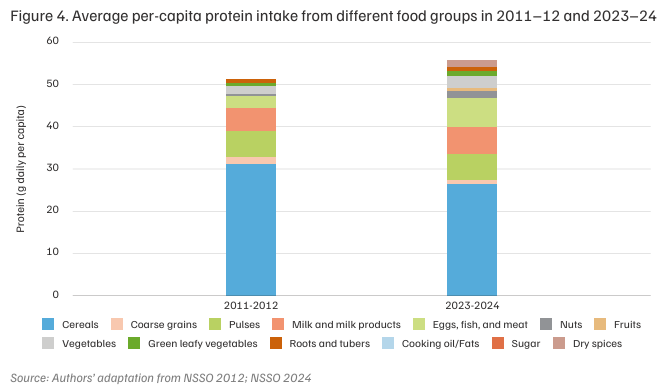
According to MoSPI estimates, which include both at-home and out-of-home consumption, the average daily per-capita protein intake increased from 60.7 g (rural) and 60.3 g (urban) in 2011–12, to 61.8 g and 63.4 g, respectively, in 2023–24.
At-home protein consumption has also improved, with the national average increasing from 51 g in 2011–12 to 55.6 g in 2023–24 (Figure 4). This reflects an overall increase in the consumption of protein-rich foods, such as milk, eggs, fish, and meat, since 2011.
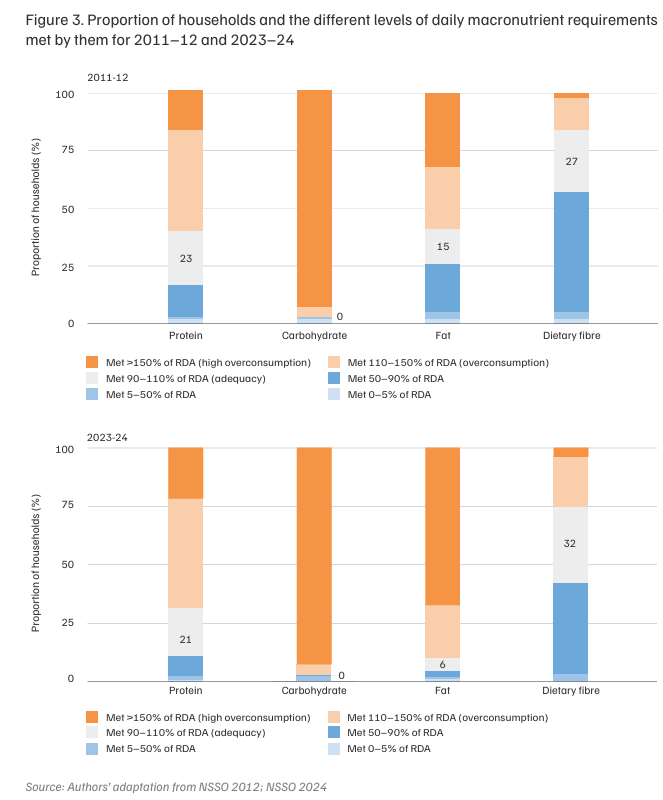
While the proportion of households overconsuming protein has increased from 60.5 per cent to 68.3 per cent in the last decade (Figure 3), a closer examination of protein sources in 2011–12 and 2023–24 reveals that nearly half of the total protein intake continues to be derived from cereals, which are low in high-quality proteins and lack certain essential amino acids (e.g., lysine), such as those found in animal products or specific legumes that are bioavailable. This pattern underscores a crucial need for additional diversification in India’s protein portfolio (Kaur et al. 2022; Rathi et al. 2023).
Diversifying protein sources by incorporating plant-based options, such as pulses, legumes, coarse grains, and nuts, particularly for those following vegetarian diets, and moderate amounts of lean meats, fish, and eggs, as per dietary preferences, thus becomes essential. The focus must also extend to the type and quality of protein to be consumed. For example, excessive consumption of eggs, particularly egg yolks, can elevate cholesterol levels, potentially leading to cardiovascular issues (Zhong et al. 2019). A balanced approach can enhance dietary quality while mitigating potential health issues associated with excessive consumption of certain protein sources.
5.2 Fat: Increase in intake from visible and invisible sources
Note: The NIN prescribes an RDA of 30 g for visible fats, which forms the basis for this analysis. This recommendation excludes invisible fat derived from other food groups, such as milk, nuts, and meat. However, the computation of household-level fat consumption includes all visible and derived fats, which may lead to an overestimated proportion of households that overconsume.
Current average fat intake is nearly 2.5 times the RDA, driven by both direct and indirect sources. At-home direct fat intake has shown a concerning increase, from 39.6 g (~133 per cent of the 2011 RDA) in 2011–12 to 55.5 g (~187 per cent of the 2023 RDA) in 2023–24 (Figure 5).
Moreover, the proportion of households consuming more than 1.5 times the recommended fat intake has more than doubled, rising from 32 per cent to 67 per cent over the past decade (Figure 3). This proportion would likely be even higher if fats from processed foods were taken into account. There has also been a shift towards diets higher in oils, i.e., visible fats, with per capita oil consumption increasing from 24.6 g in 2011 to 33.7 g in 2023.
The rapid increase in fat overconsumption is linked to the shift towards high-fat diets, potentially driven by rising urbanisation, economic growth, and lifestyle changes (Global Nutrition Report 2021; Hawkes et al. 2017). Such dietary patterns are associated with a heightened risk of obesity and cardiovascular diseases (Ranganathan et al. 2016). To mitigate these risks, interventions must promote healthier fat sources, such as nuts, seeds, and fish, while limiting the use of refined oils.
5.3 Carbohydrate: Minimal change in consumption
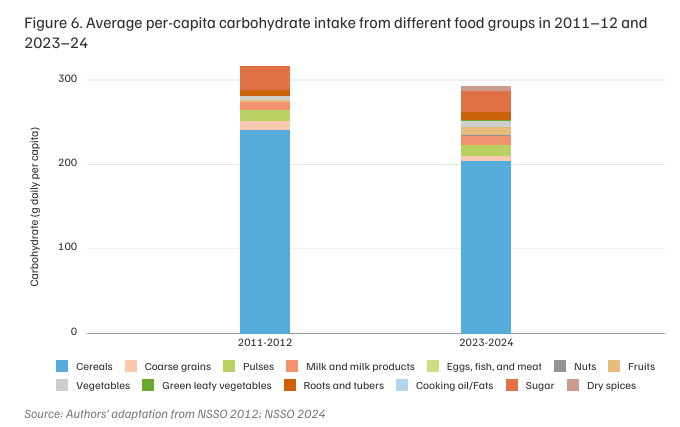
Note: The RDA taken for carbohydrates is 130 g, which is the minimum requirement of carbohydrates for human brain function. However, the acceptable macronutrient distribution range (AMDR) for carbohydrates is 45–65 per cent of total caloric intake (i.e., 250–300 g), which is significantly higher than the RDA and more in line with actual consumption (Slavin and Carlson 2014).
In 2011–12, carbohydrate intake was high, with the national average reaching 316.3 g (243 per cent of the RDA). By 2023–24, this figure decreased to 293 g due to a marginal reduction in cereal consumption (Figure 6). However, over 93 per cent of households continued to consume more than 1.5 times the RDA in 2023–24 (Figure 3). The persistence of high carbohydrate consumption reflects India’s continued dependence on cereal-heavy diets across socioeconomic strata. Efforts to reduce over-reliance on cereals and replace staple foods with whole grains can help diversify the diet to include more nutritionally dense carbohydrates.
5.4 Fibre: Incremental gain, gaps remain
Note: The RDA for fibre has been calculated based on the amount of fibre derived from various food groups, as recommended by the NIN, for different demographic categories.
As of 2023–24, 42 per cent of households were unable to meet adequate daily fibre intake, a figure that has decreased from 57.1 per cent in 2011–12 (Figure 3). However, this number indicates a significant concern that needs to be addressed. Although fibre intake has risen due to a more diverse consumption of fibre sources, it is still below the RDA (Figure 7). Low fibre intake across a high proportion of households reflects insufficient consumption of fruits, vegetables, and whole grains. It is crucial to understand whether this situation arises from factors of food insecurity, such as the inaccessibility of diverse fibre-rich foods. Additionally, the ongoing shift away from coarse grains, a staple of traditional diets, towards refined grains may further exacerbate the decline in fibre consumption.
5.5 Calorie intake: Overall increase
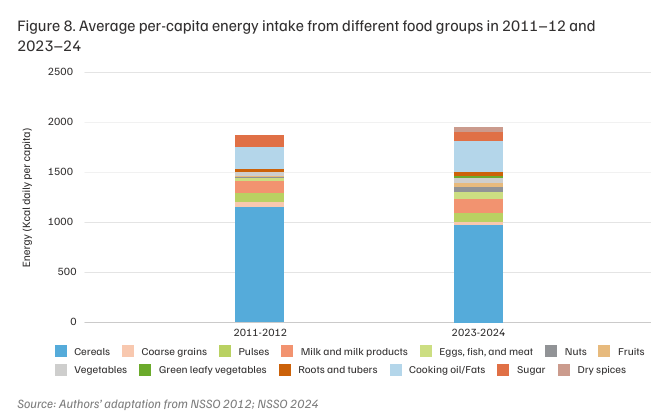
According to MoSPI, the average daily per-capita energy intake in India is 2,212 kcal in rural areas and 2,240 kcal in urban areas. Of this, average at-home consumption accounts for 1,951 kcal, primarily derived from cereals (50 per cent, or 973 kcal, from rice, wheat, etc., and 2 per cent, or 32.5 kcal, from coarse grains), as shown in Figure 8. This heavy reliance raises concerns about nutrient diversity, as high cereal consumption can contribute to micronutrient deficiencies and increase the risk of health issues, such as obesity and diabetes (Yilmaz and Yilmaz 2025)
• Protein sources, including eggs, fish, meat (3 per cent or 64 kcal), and pulses (4 per cent or 87 kcal), remain significantly low, reducing overall dietary quality and indicating a risk of protein–energy malnutrition. The AMDR recommends that 10–35 per cent of total daily calories come from protein, equivalent to 200–700 kcal in a standard 2,000-calorie diet (UC Davis 2018)
• Fruits (2 per cent or 46 kcal) and green leafy vegetables (1 per cent or 11 kcal) are consumed at alarmingly low levels.
• Conversely, cooking oils and fats (16 per cent or 303 kcal) and sugar (5 per cent or 100 kcal) contribute excessively to energy intake, raising concerns about obesity
While total energy intake appears adequate, the quality of this energy remains poor due to limited diversity in food sources. Dietary diversity needs to be enhanced by promoting the consumption of a variety of food groups, such as pulses, fruits, and vegetables, while reducing reliance on cereals and unhealthy fats and sugars.
The following analyses showcase a clear correlation between the MPCE decile group and the ability to meet daily dietary requirements. Households in lower expenditure capacity deciles consistently exhibit greater deficits across most food groups, while those in higher expenditure deciles achieve or exceed recommended intake levels for a wider range of food groups (Figure 9).
A clear and consistent trend across both rural and urban India is the substantial overconsumption of cereals and salt, even among the lowest decile. In rural areas, cereal consumption remains well above recommended levels across deciles (146 per cent of the requirement in Decile 1 and 158 per cent in Decile 9), indicating a strong reliance on staple grains. Urban areas also exceed the recommended cereal intake in lower deciles; however, this figure tapers to 97 per cent by Decile 10, suggesting that as urban households become more affluent, they begin diversifying away from cereals.
In contrast, coarse grains remain under-consumed in both sectors, never exceeding 22 per cent of the requirement in rural areas or 11 per cent in urban areas, and dropping to just 6 per cent in the highest urban decile. This underlines a shift away from traditional grains, especially in urban settings, where diets increasingly emphasise refined grains and other food groups.
Figure 9. Change in consumption (relative to NIN requirement) with expenditure decile across food groups (2023-24)
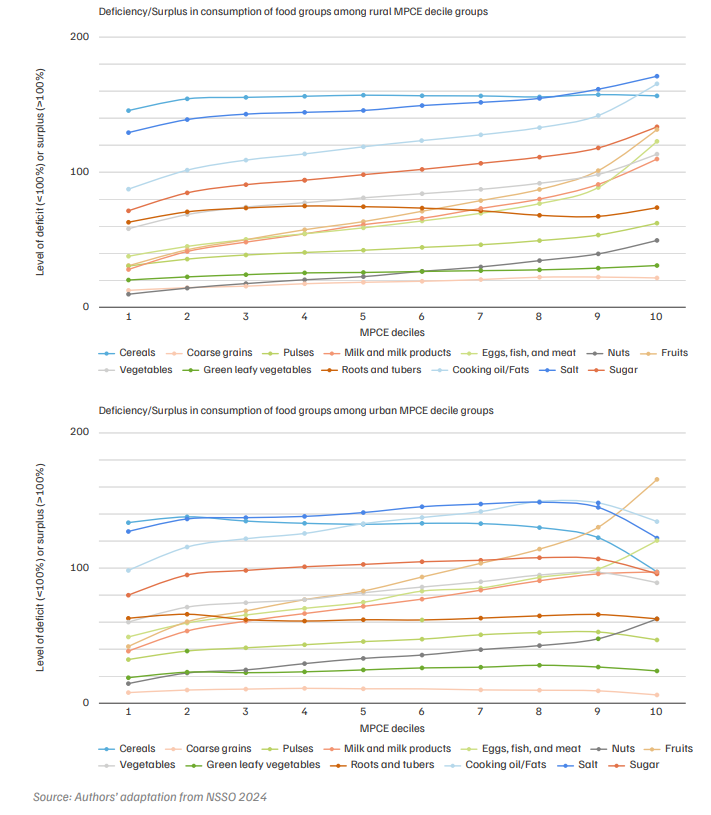
Among other under-consumed categories, GLVs and nuts consistently fall below 100 per cent across all deciles. Green leafy vegetables are particularly low in urban areas, with consumption at only 24 per cent of the requirement in Decile 10, while rural areas reach 31 per cent. Nuts also reflect a stark urban–rural divide: although both sectors see higher consumption in the top deciles, urban Decile 10 reaches 62 per cent of the requirement, compared to 50 per cent in rural Decile 10. This suggests that despite rising income in both settings, access and affordability may be stronger drivers in urban centres.
Pulse consumption remains low across deciles. In rural deciles, intake increases from 30 per cent to 62 per cent of the requirement, whereas in urban areas, it increases more modestly, from 32 per cent to just 47 per cent. This pattern suggests that even as rural households become wealthier, they continue to rely more heavily on pulses as a primary source of protein.
The consumption of milk and milk products also varies with income but reveals notable rural–urban differences. Rural households move from 28 per cent of the requirement in Decile 1 to exceeding the recommended level at 110 per cent in Decile 10, whereas urban households peak at 97 per cent in Decile 10, as seen from at-home consumption. These differences reflect both cultural and regional preferences for dairy, alongside availability and local production patterns that may favour rural markets.
A similar duality also emerges for cooking oil/fats and sugar. In the top rural decile, consumption rises steeply to 166 per cent of the recommended level, surpassing the 135 per cent recorded for urban Decile 10. Sugar shows a particularly sharp increase in rural areas (from 71 per cent to 134 per cent) compared to urban areas (from 80 per cent to 96 per cent). Coupled with salt consumption, which escalates to 171 per cent in the rural top decile but levels off at 122 per cent in the highest urban decile, this trend suggests a potentially higher intake of calorie-dense and heavily seasoned foods among wealthier rural households.
In both sectors, fruit intake shows a strong positive correlation with income; however, the top urban decile (166 per cent) far exceeds the rural equivalent (132 per cent). Vegetable consumption in rural areas barely crosses 100 per cent in the highest decile (114 per cent), while in urban areas, it remains below 100 per cent at every decile (peaking at 97 per cent in Decile 9). This paradox suggests that although urban households may have better market access, they may still consume fewer vegetables in accordance with recommendations, possibly substituting them with other foods.
Overall, these findings illustrate persistent inequities in the consumption of different food groups in India:
The rural–urban contrast is evident in how quickly certain items (e.g., fruits, nuts, cooking oils) exceed recommended levels in urban areas, while pulses, salt, and sugar show stronger upward trends in rural households. Together, these patterns underscore the intricate interplay of income, cultural preferences, market availability, and nutritional awareness that continues to influence dietary patterns across India.
A comprehensive understanding of food sufficiency must incorporate nutrient-wise sufficiency analysis that considers both the variety of food groups consumed and their respective contributions to overall health. Such integration is essential for the development of effective nutrition security–focused policies. Subsequently, we analyse daily per-capita macronutrient intake and its sources to examine the extent of nutrient adequacy and dietary diversity among populations across spending capacities. Beginning with protein, Figure 10 presents protein consumption across expenditure deciles, with the first bar indicating the national average for visual comparison and the blue dotted line representing the RDA. Subsequently, Table 4 presents the NIN-recommended share of different food groups in total protein intake, alongside the actual national averages and the averages for the lowest and highest deciles.
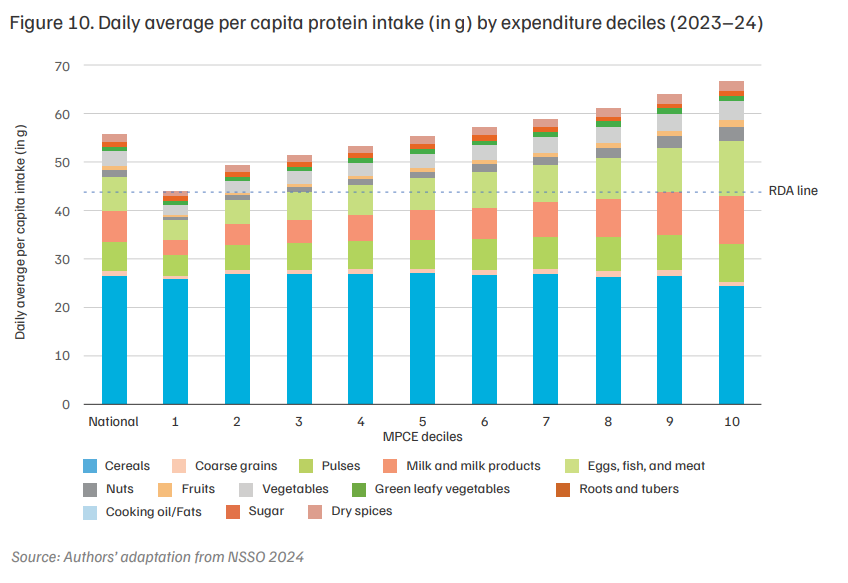
Table 4. Share of food groups in total protein intake
| Food group | NIN recommendation (%) | National average (%) | Bottom 10 per cent (1st decile) (%) | Top 10 per cent (10th decile) (%) |
|---|---|---|---|---|
| Cereals (incl. coarse grains) | 32 | 49 | 60 | 38 |
| Pulses | 19 | 11 | 10 | 12 |
| All vegetables (incl. roots, tubers, and GLVs) | 13 | 9 | 9 | 9 |
| Nuts | 7 | 3 | 1 | 5 |
| Eggs, fish, and meat | 14 | 13 | 9 | 17 |
| Milk and milk products | 13 | 11 | 7 | 15 |
| Fruits | 1 | 1 | 1 | 2 |
All expenditure deciles meet the RDA for protein intake which is approximately 44 g per person on average (Figure 10). The share of protein derived from animal sources (milk and milk products; eggs, fish, and meat) increases as spending capacity increases, with the lowest decile sourcing only half (16 per cent) as much of their daily protein from animal sources as the highest decile (32 per cent) (Table 4).
While India may meet adequacy in the quantity of protein intake, the quality falls short due to an inadequate share of pulses and animal sources in its protein portfolio. Nearly half of the country’s total daily protein intake comes from cereals, against the recommended 32 per cent share. The share of pulses is only 11 per cent against a 19 per cent recommendation, with little inter-decile variation: 10 per cent among the lowest expenditure decile and 12 per cent among the highest.
BOX 6. Not all proteins are equal
Protein quality varies considerably and is measured using the Digestible Indispensable Amino Acid Score (DIAAS), which indicates how effectively the body absorbs and utilises amino acids from different foods. Cereals score low on this index (DIAAS 0.3–0.5), pulses perform better (0.6–0.8), while milk, eggs, fish, and meat represent the highest-quality proteins, with scores greater than 1 (FAO 2013; Philips 2017; Mathai et al. 2017; Pratap et al. 2022; Adhikari 2022; Gaudichon 2024).
Source: Authors’ compilation
Indians’ consumption of pulses is just one-tenth their consumption of cereals by weight, reinforcing the skew in protein intake. This reflects structural barriers, including the significantly higher price of pulses, limited awareness of their nutritional role, cultural preferences, and competing sources of protein.
Cereal dependency is further reinforced by food subsidy programmes (like the PDS) that primarily distribute these grains. Access to diverse protein sources is therefore limited for lower decile groups, with the lowest decile sourcing 60 per cent of their protein from cereals. This can result in suboptimal health outcomes despite reaching recommended protein intake levels (Minocha et al. 2017). However, combining cereals with coarse grains and pulses can provide most amino acids and presents a potential pathway of diversification within the PDS (ICMR-NIN 2024).
BOX 7. Relative cost of protein
Although cereals appear to be the cheapest food option per kg, they become relatively more expensive when adjusted for protein quality. At INR 30–40/kg, cereals such as rice and wheat seem affordable but provide low-quality protein. By comparison, pulses (INR 120/kg), coarse grains (INR 30–84/kg), and milk (INR 60–70/litre) are priced higher per kg, which creates the perception of lower accessibility (NSSO 2024; Press Trust of India 2025). However, when adjusted for protein quality using the DIAAS, the cost advantage of cereals diminishes. A gram of usable protein from cereals is more expensive than that from pulses or coarse grains, and the cost gap with animal proteins such as milk narrows considerably. Thus, while pulses and coarse grains may seem more expensive, they are actually more cost-efficient sources of high-quality protein than rice or wheat. Their persistent under-consumption underscores the need for policy interventions and consumer nudges to encourage households to consider these nutritionally superior options.
Source: Authors’ compilation
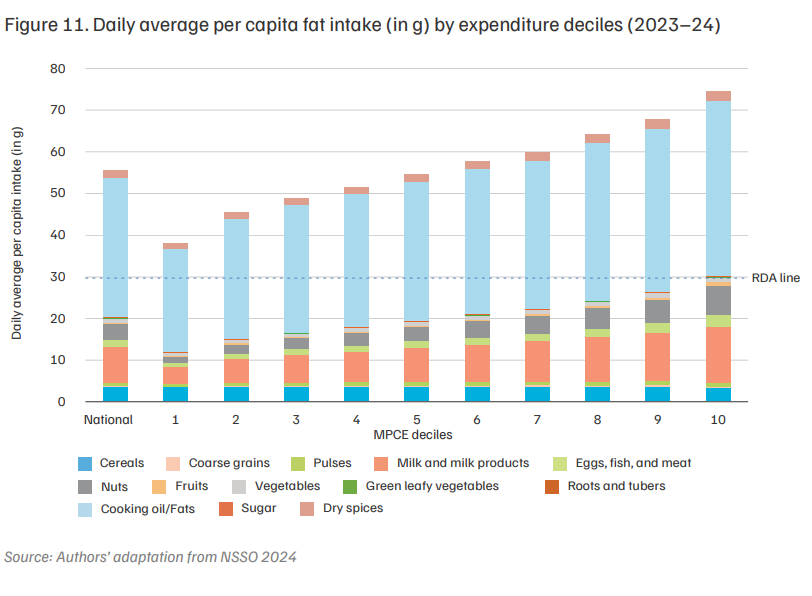
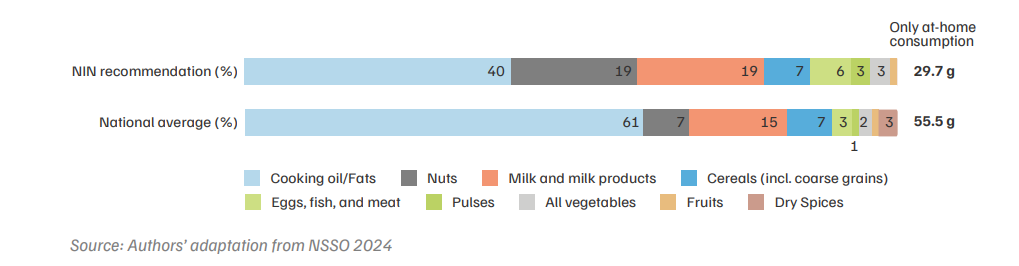
Table 5. Share of food groups in total fat intake
| Food group | NIN recommendation (%) | National average (%) | Bottom 10 per cent (1st decile) (%) | Top 10 per cent (10th decile) (%) |
|---|---|---|---|---|
| Cooking oil/Fats | 40 | 61 | 66 | 56 |
| Nuts | 19 | 7 | 4 | 10 |
| Egg, fish, and meat | 6 | 3 | 3 | 4 |
| Milk and milk products | 19 | 15 | 11 | 18 |
| Cereals (incl. coarse grains) | 7 | 7 | 9 | 5 |
Source: Authors’ adaptation from NSSO 2024
Fat intake presents a stark picture, with the national average share of edible oils at 61 per cent, compared to the recommended 40 per cent (Table 5). In contrast, the share of nuts and eggs, fish, and meat remains below recommended values. Fat intake shows high variations across expenditure deciles, with the topmost decile consuming almost twice as much fat as the lowest, primarily due to higher consumption of edible oils, milk, and nuts (Figure 11).
Indians are overconsuming fat, with the national average reaching 55.5 g against 1,951 kcal – most of it derived from edible oils. This is concerning, given the established association between excessive oil and increased cardiovascular disease risk (Manchanda and Passi 2016). The predominant use of refined oils that are high in polyunsaturated fatty acids (PUFAs), and can produce free radicals and trans fats when subjected to high heat, further exacerbates cardiovascular risks. Their consumption can also lead to an imbalance in essential fatty acids. The PDS predominantly supplies palm and soya oil, which can pose the mentioned health risks. Blending different types of oils can improve the overall fatty acid profile and reduce health risks. For instance, combinations such as rice bran and safflower oil can improve lipid parameters and reduce inflammation (Haldar et al. 2020).
There is also considerable scope to diversify fat intake through greater consumption of nuts and seeds, which can reduce the risk of coronary heart disease and stroke mortality (Arnesan et al. 2023). This is attributed to their healthy fat profile, rich in unsaturated fats that support arterial health and lower bad cholesterol levels.
Figure 12. Daily average per capita carbohydrate intake (in g) by expenditure deciles (2023–24)
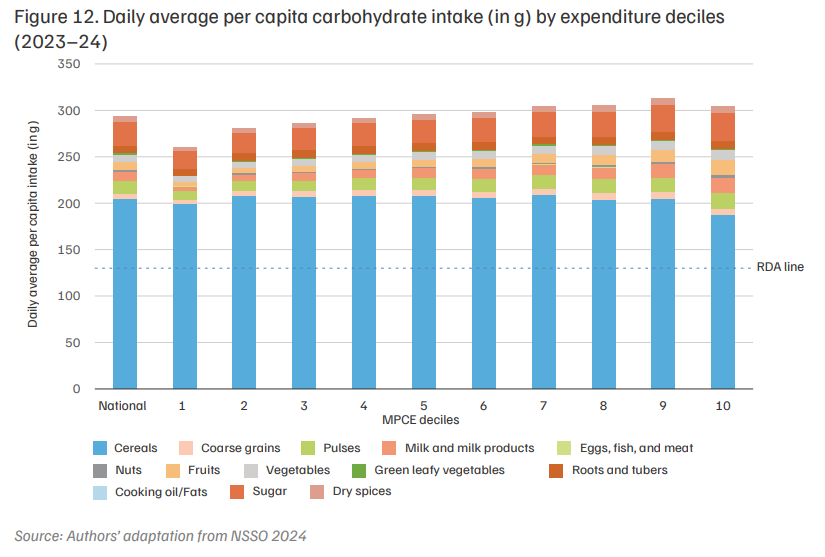
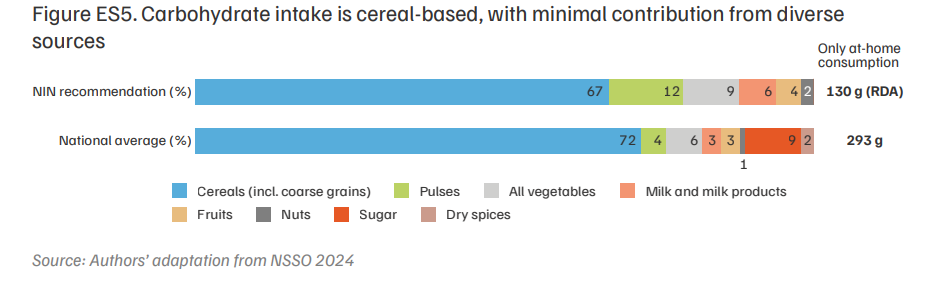
Table 6. Share of food groups in total carbohydrate intake
| Food group | NIN recommendation (%) | National average (%) | Bottom 10 per cent (1st decile) (%) | Top 10 per cent (10th decile) (%) |
|---|---|---|---|---|
| Cereals (incl. coarse grains) | 67 | 72 | 78 | 64 |
| Pulses | 12 | 4 | 4 | 5 |
| All vegetables (incl. roots, tubers, and GLVs) | 9 | 6 | 6 | 7 |
| Fruits | 4 | 3 | 1 | 5 |
| Sugar | 0 | 9 | 7 | 10 |
| Milk and milk products | 6 | 3 | 2 | 5 |
| Nuts | 2 | 1 | 0 | 1 |
Nationally, cereals contribute 72 per cent of the total carbohydrate intake, followed by sugar at 9 per cent (Table 6). The share of cereals in carbohydrate intake is as high as 78 per cent for the lowest decile, while sugar accounts for 10 per cent in the highest (Figure 12). Carbohydrate intake from pulses, vegetables, and nuts remains low across deciles. The NIN recommends that one-fourth of total carbohydrates be derived from fruits, vegetables, and pulses; however, Indians under-consume these sources by 44 per cent. Diversifying carbohydrate sources by incorporating more fruits, vegetables, pulses, and coarse grains can substantially improve the overall nutritional profile of diets (Knorr-WWF 2019).
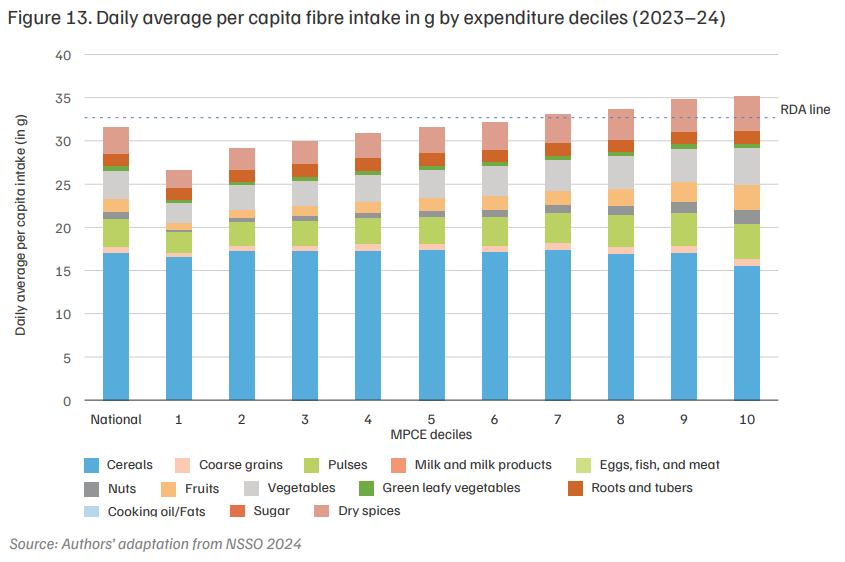
Table 7. Share of food groups in total dietary fibre intake
| Food group | NIN recommendation (%) | National average (%) | Bottom 10 per cent (1st decile) (%) | Top 10 per cent (10th decile) (%) |
|---|---|---|---|---|
| Cereals (incl. coarse grains) | 37 | 56 | 64 | 46 |
| Pulses | 17 | 10 | 9 | 12 |
| Fruits | 14 | 5 | 3 | 8 |
| Nuts | 17 | 3 | 1 | 4 |
| All vegetables (incl. roots, tubers, and GLVs) | 15 | 16 | 15 | 18 |
India continues to consume less than the recommended fibre on an average. Individuals up to the third decile are unable to meet even a daily fibre intake of 30 g (Figure 13).
Cereals remain the primary source of daily dietary fibre in Indian diets, accounting for 56 per cent of total intake (Table 7). Consumption of whole-grain cereals has been shown to protect against a range of lifestyle disorders due to their rich dietary fibre content (Anderson 2003; Fardet 2010; McKevith 2004; Priebe et al. 2008). However, most grains consumed in India are refined, and during the refining process, the bran is separated, resulting in significant losses of dietary fibre as well as several other vitamins and minerals. Consequently, despite high cereal consumption, the actual fibre intake remains much lower than expected (Oghbaei and Prakash 2016).
The contribution of fibre from pulses, fruits, and nuts is insufficient, at just 18 per cent, compared to the recommended 48 per cent. The lowest decile derives only 0.7 g of fibre per day from fruits, equivalent to eating roughly two bananas a week.
The Western diet is typically low in fibre and is a contributing factor to the prevalence of obesity and several other chronic and non-communicable diseases, as it is characterised by the consumption of calorie-dense foods that have low nutritional density (Pi-Sunyer 2009; Mendoza et al. 2007). The adoption of Western dietary patterns within households is increasing, particularly among urban middle-class families (Satija et al. 2015). This can lead to poor gut ecology, and there is extensive evidence that a high-fibre diet is associated with rich gut microbiota and a lower risk of cancer and heart diseases (Makki et al. 2018; Malnick and Knobler 2006). Viscous fibre also influences body weight, body mass index (BMI), and waist circumference by increasing satiety and suppressing appetite, thereby contributing to weight reduction (Jovanovski et al. 2020; Borkoles et al. 2022). Furthermore, individuals with a high intake of plant-based fibre (>30 different plant types per week) display significantly greater gut microbial diversity than those with a limited intake (<10 different plant types per week) (McDonald et al. 2018). Incorporating different sources of fibre and a variety of cereals, pulses, fruits, vegetables, and nuts is important for both microbial diversity and supporting key gut microbiota (Calatayud et al. 2021)
To address the identified dietary imbalances and nutritional challenges, this report proposes three primary, evidence-based recommendations. Each is designed to target specific gaps within the population, from awareness-driven deficits in affluent groups to access-based deficits in vulnerable communities. This section elaborates on the rationale, strategic interventions, and key implementing actors for each recommendation.
Drive demand for diverse foods by promoting nutrient-dense coarse grains, pulses, fruits, and vegetables through targeted strategies.
Rationale and evidence: Significant dietary gaps persist even among higher-income groups, indicating that awareness, food habits, and cultural preferences – and not just affordability – are key constraints to healthy consumption.
This indicates that even the most affluent urban consumers fall short of the required dietary diversity.
Key interventions
Launch campaigns built around simple, memorable heuristics such as ‘One Local Millet a Day’, ‘Eating a Rainbow Every Meal’, ‘One Green and One Bean Rule’, ‘Half Plate Vegetables’, and ‘2 Fruits a Day’. These messages should encourage households to integrate coarse grains, pulses, fruits, and vegetables into daily meals, improving fibre, protein, and micronutrient intake. The campaign must emphasise both inter-food group diversity (promoting nutrient-dense under-consumed groups) and intra-food group diversity (promoting seasonal and traditional varieties of fibre- and micronutrient-rich foods). Different population groups will require different approaches to effectively transmit these messages.
Dissemination strategy
Rural and semi-urban middle-income groups may require more community-based or local retail nudges. In contrast, urban high-income groups are better engaged through influencerdriven and retail packaging channels.
Lead actors
Ministry of Education, Ministry of Health and Family Welfare, Ministry of Information and Broadcasting, state nutrition missions, community health workers, Food Safety and Standards Authority of India’s (FSSAI) Eat Right campaign, FMCGs, civil society organisations (CSOs), corporate consumer social responsibility (CSR) arms.
Enable consumers to moderate their intake of high fat, salt, and sugar (HFSS) foods.
Rationale and evidence: Wealthier households are showing a marked drift towards processed, heavily seasoned, and calorie-dense diets. Processed foods and beverages account for the largest share of food expenditure across all income groups, but the trend is most pronounced in the top decile, where nearly 30 per cent of food expenditure is towards this category. The rural top decile significantly overconsumes cooking oil (166 per cent of the RDA), sugar (134 per cent of the RDA), and salt (171 per cent of the RDA). This highlights an urgent need to educate and enable consumers to moderate their intake of HFSS foods from all sources, both direct (table salt/sugar) and indirect (hidden in processed foods).
Key interventions: The approach must combine public education with practical strategies for households and policy-level interventions. As in the previous recommendation, targeting wealthier households first requires shifting from purely public channels to influence-based, lifestyle-oriented, and market-leveraging mechanisms. Public education and messaging should focus on:
Dissemination strategy
Household and market strategies: Promote practical household strategies like monthly “kitchen audits” to assess oil/salt/sugar use and meal-planning to substitute processed snacks. Partner with retail/e-commerce platforms, run demonstration meals through SHGs and Resident Welfare Associations (RWAs), and embed nudges in wellness and food delivery apps.
Policy levers: Implement clear front-of-pack nutrition labelling with warning symbols for packaged foods to provide a simple, essential nudge at the point of purchase. Improve access and awareness of fresh and minimally processed foods to reduce reliance on salt and sugar as preservatives in shelf-stable products.
Lead actors
FSSAI; private healthcare and wellness platforms; influencers and lifestyle media (chefs, fitness coaches, social media creators); retail, e-commerce, and FMCG players; community groups: RWAs (urban) and SHGs/FPOs (rural)
Diversify major public food programmes to correct dietary imbalances among low-income populations.
Rationale and evidence: India’s public food programmes are critical safety nets but are currently misaligned with dietary needs, reinforcing cereal dominance among the most vulnerable. The PDS, reaching over 800 million people, is dominated by rice and wheat. PDS beneficiaries derive 56% (rural) and 50% (urban) of their total energy from cereals, far exceeding recommended limits. In the lowest rural decile, PDS beneficiaries’ per-capita cereal intake is 1,030 kcal, versus 791 kcal for non-PDS households. Conversely, protein-rich coarse grains and pulses contribute just 1-2% and under 6%, respectively, to the energy intake of PDS households. Simultaneously, PM POSHAN and POSHAN 2.0 cover 220 million children and mothers, providing a direct channel to address protein and micronutrient deficiencies from a young age.
Key interventions
Lead actors
Ministry of Consumer Affairs, Food and Public Distribution; Ministry of Education; Ministry of Women and Child Development; Ministry of Health and Family Welfare; state food commissions
Conclusion
For sustainable and nutritionally adequate consumption, India must adopt a multi-pronged, demographically targeted approach linking production, access, and consumption behaviour. This requires granular studies that map regional production–consumption mismatches, identifying where nutrient-dense foods such as coarse grains, pulses, and green leafy vegetables are produced but remain absent from local diets, and subsequently, realigning food programmes, such as the Public Distribution System and school meal schemes, to promote regionally grown, nutrient-rich foods beyond rice and wheat. Interventions must be tailored to address specific dietary risks across demographic, income, and regional groups. Urban and higher-income groups require targeted campaigns to reduce excessive intake of salt, sugar, and fat through influence-based and retail-oriented channels. Meanwhile, low- and middle-income households, especially in cereal-dependent rural regions, require stronger nudges and provisioning mechanisms to increase their intake of local pulses, millets, and vegetables. Understanding behavioural drivers, such as taste preferences, cultural beliefs, convenience, and marketing influence, and generating granular data on these will be critical for designing effective, tailored interventions. Importantly, regulatory oversight of ultra-processed and packaged foods, which increasingly dominate both urban and rural diets, must be strengthened through clear labelling, responsible advertising, and limits on unhealthy ingredients. By integrating these coordinated actions across food, agriculture, health, and education policies, India can build a more diverse, equitable, and sustainable food system.
This CEEW study analyzes NSSO HCES data (2011–12; 2023–2024) to show India has shifted from a calorie crisis to a dietary quality crisis. Key findings include the skewed protein intake (nearly 50% of protein comes from low-quality cereals, far above the 32% recommendation), surging fat overconsumption (2.5x RDA), and under-consumption of pulses, coarse grains, and green leafy vegetables. The report urges policy reform to diversify public food programs and use targeted messaging to promote nutrient-rich foods across all income groups.
While India's average at-home protein intake is adequate in quantity (55.6 g per day), its quality remains poor because nearly half of it is derived from cereals, which are a low-quality protein source due to their incomplete amino acid profile, which lacks lysine. This crowds out higher-quality proteins like pulses (contributing just 11% vs. 19% recommended) and animal-based sources, leading to suboptimal nutrition despite sufficient total grams.
Nutrient intake rises significantly with income, with the top expenditure decile consuming 1.5 times more protein than the poorest. This gap is most pronounced for nutrient-dense foods: the lowest rural decile meets only 28 per cent of the RDA for milk, 31 per cent for fruits, and 38 per cent for eggs, fish, and meat, while the top decile overconsumes beyond the RDA in all three categories.
The study highlights three major overconsumption risks: 1) Fat: At-home intake is nearly 2.5 times the RDA, driven by cooking oils. 2) Salt: Consumption is around 11 g per day, more than double the WHO limit of 5 g. 3) Sugar: Total intake is approximately double the recommended limit, largely due to indirect consumption through processed foods. This overconsumption is accelerating rapidly among higher-decile rural and urban groups.
At the systems level, reforming major public food programmes, including the PDS, PM POSHAN, and Saksham Anganwadi & POSHAN 2.0, is essential to shift away from cereal-dominant provisioning and expand access to coarse grains, pulses, fruits, and vegetables, and enhancing protein diversity in school meals with milk or eggs. Delivering this transformation requires coordinated action across governments, markets, and civil society: aligning procurement with regional nutritious foods, embedding behaviour-change efforts in schools and community platforms, reformulating healthier food offerings in the private sector, and leveraging media and digital influencers to reshape dietary preferences. With stronger convergence and visibility, India can move beyond calorie sufficiency towards more balanced, diverse, and sustainable diets that improve long-term public health.

Water, Nature, Progress: Solutions for a New India
Cattle and Community in a Changing Climate
Adapting Agricultural Water Resources Management for a Changing Climate