Council on Energy, Environment and Water Integrated | International | Independent
Suggested citation: Kumar, Arvind, Mohammed Sahbaz Ahmed, Arpan Patra, Sandeep Narang, and Abhishek Kar. 2025. Reducing Air Pollution from Construction: Learnings from a Behavioural
Intervention Pilot in Gurugram. New Delhi: Council on Energy, Environment and Water.
India's growing construction market is a significant source of fugitive dust, contributing to air pollution, particularly in urban areas like the NCR. This pollution carries health risks and has resulted in temporary construction bans, impacting incomes and livelihoods. Existing "hard" policy measures are often reactive and do not address the continuous drivers of non-compliant practices. Adopting a behavioural science lens can offer insights into the drivers of low compliance, noting that behaviour change strategies for emission reduction, especially in the construction sector, have not been extensively explored in India. This report presents a pilot study conducted by CEEW in Gurugram. The pilot leveraged behavioural science to improve compliance with dust mitigation practices, focusing on vehicular speeding by heavy-duty vehicle drivers, identified as a primary source of particulate matter on construction sites. The study aimed to quantify the effectiveness of this behaviour change approach in reducing air pollution at an active construction site.
India’s construction market size, valued at INR 72,000 crore (USD 8.5 billion) in 2023, is predicted to reach INR 1,79,000 crore (USD 21 billion) by 2030, at a compound annual growth rate (CAGR) of 12.6 per cent from 2024 to 2030 (NMSC 2024). However, the growth of construction and demolition (C&D) activities has brought high fugitive dust1 levels, especially in urban clusters. Emissions during C&D activities contribute around 4 per cent of the annual particulate matter (PM10) concentration in the National Capital Region (NCR) (TERI 2018). In Delhi alone, nearly 12,000 deaths occur each year attributable to air pollution, much of it attributable to particulate matter (Bont et al. 2024). Prolonged exposure to PM puts people, especially construction workers, at risk of developing short and long-term health issues (Fuller et al. 2022; Wang et al. 2023). In 2022 and 2023, due to severe air pollution episodes, authorities like the State Pollution Control Boards (SPCBs), under the direction of the Commission for Air Quality Management in NCR and Adjoining Areas (CAQM), imposed a total ban on all or most construction activities for a combined 73 days (CII 2023), which led to project delays (Mishra 2024), impacting incomes and livelihoods (Mahila Housing Trust 2024).
Currently, authorities rely on reactionary ‘hard’ policy measures like imposing restrictions, fines, and bans to control dust, holding the C&D sector collectively accountable for poor environmental compliance. Such start-stop measures overlook the root causes repeatedly driving non-compliant practices. Recent instances of non-compliance to the dust-mitigation mandate at C&D sites make it necessary to explore the effectiveness of ‘softer’, bottom-up approaches to understand the context in which non-compliance persists, and designing solutions that balance economic, social, and environmental outcomes.
Challenges surrounding low compliance can be well understood by adding a behavioural science lens to understand the root causes contributing to weak or no compliance. Improving compliance standards, therefore, would require people to either start, stop, continue, change or modify, or refrain from engaging in a behaviour, in a given context.
The discussion has, so far, revolved around stringent policy measures, overlooking construction workers’ behaviours in the context of dust mitigation. The use of behaviour-change strategies to directly reduce emissions has not been explored extensively in India. Moreover, there is limited evidence found by behavioural science in the context of air pollution mitigation, especially in the C&D sector in India.
We conducted a pilot study in collaboration with Signature Global India Ltd., one of the country’s most profitable real estate companies (Press Trust of India 2025). The pilot, conducted at the Signature Global Imperial site in Gurugram, aimed to improve compliance towards dust-mitigation practices, and quantify the effectiveness of a behaviour change approach on PM reduction.
Road dust resuspension caused by speeding vehicles is one of the primary sources of PM on construction sites. For instance, a study estimating dust emissions at a motorway construction project found that truck movement contributes to approximately 50 per cent of the total PM (Giunta et al. 2019). Another study showed that maximum PM concentrations (PM10 = 270.1, PM2.5 = 71.8) were found at roads near construction activities compared to roads away from the construction site due to the movement of heavy duty vehicles (HDVs) carrying excavated earth overnight (Alshetty and Nagendra 2022).
At the pilot site, despite regulations and guidelines on speed limits (10 kph), only 16 per cent of HDV drivers complied with the limit. This led to an average PM10 concentration of 749±1013 µg/m³ (measured at the midpoint of the approximately 100-metre-long approach road) in the months of April and May, which is about 12 times the permissible limit of 60 ug/m³ under the National Ambient Air Quality Standards (NAAQS). Activity specific PM concentrations indicate vehicle movement as the most pollutant-intensive activity at the pilot site. Moreover, increasing PM2.5 and PM10 concentrations are observed with higher vehicular speeds. Therefore, this study aims to test the impact of approaches informed by behavioural science in improving compliance, and measure the impact on air pollution reduction at an active construction site.
This study leverages behavioural science, explicitly targeting vehicular speeding by contracted HDV drivers at an active construction site, thereby targeting the most pollutantintensive activity.
We conducted focus group discussions with 11 security guards and semi-structured interviews with 30 contractual drivers, guided by a Capability, Opportunity, Motivation– Behaviour (COM-B) questionnaire (Annexure I) and found several key psychological and environmental barriers leading to low compliance towards the site speed limit.
The Behaviour Change Wheel (Michie et al. 2011) guides the intervention design process. Interventions, including Education, Training, Persuasion, Enablement, Environmental Restructuring, and Restrictions, are utilised to improve speed compliance (ES Table 1). Annexure II describes the specific Behaviour Change Techniques (BCTs) based on the BCT Taxonomy (v1) (Michie et al. 2011) adapted to design the interventions.
The study area is a ~100-metre stretch of paved approach road, with high silt loading due to frequent movement of HDVs and low maintenance (Figure ES1). We recorded vehicle speeds and changes in PM10 and PM2.5 levels with each passing HDV. During April and May 2024, we recorded 91 vehicle movements between 10 a.m. and 6 p.m. (day shift); PM data was gathered through a battery operated portable air quality monitor (DustTrak 8533). The monitor was placed in the middle of the 100-m road stretch, while vehicle speeds were measured manually by the on-field research team.
Table ES1: Capability, Opportunity, Motivation–Behaviour (COM-B) barriers and Behaviour Change Wheel (BCW) solutions to improve speed compliance
| COM-B Component | Barrier | Recapacity |
|---|---|---|
| Psychological Capability Physical Capability |
|
Education, Training, Enablement |
| Physical Opportunity |
|
Environmental Restructuring, Restrictions |
| Social Opportunity |
|
Environmental Restructuring, Modelling, Restrictions |
| Reflective Motivation |
|
Education, Persuasion |
Source: Authors' analysis
The pilot was divided into pre-intervention and intervention phases.
During the pre-intervention phase, HDV drivers exceeded the speed limit of 10 kph as they travelled through the approach road (Figure ES1), stopping at the material entry gate, and resuspending dust along the route. While the drivers filled out their entry details, the guards did not remind them about the speed limit and its importance in improving air quality, thereby failing to raise speed control as a priority task for drivers. In the absence of reminders, controlling speed remained a low priority among drivers.
During the intervention phase, HDV drivers stopped at the starting point of the approach road (near Gate 1) instead of speeding through the approach and resuspending dust before stopping at the material entry gate (Gate 2) (Figure ES 1). We recognised guards as key messengers, holding authority to inform incoming HDV drivers regarding the importance of complying with the site speed limit. Upon entering the guards’ booth, the guard on duty verbally prompted drivers about the site speed guidelines and the importance of reducing speeds to mitigate the harmful effects of dust. Using visual posters, guards made the correlation between speeding and resuspension of dust concrete. Then, guards presented a voluntary commitment form to drivers, seeking their participation in dust mitigation efforts at the site.
Figure ES 1. Study area of incoming drivers at the construction site
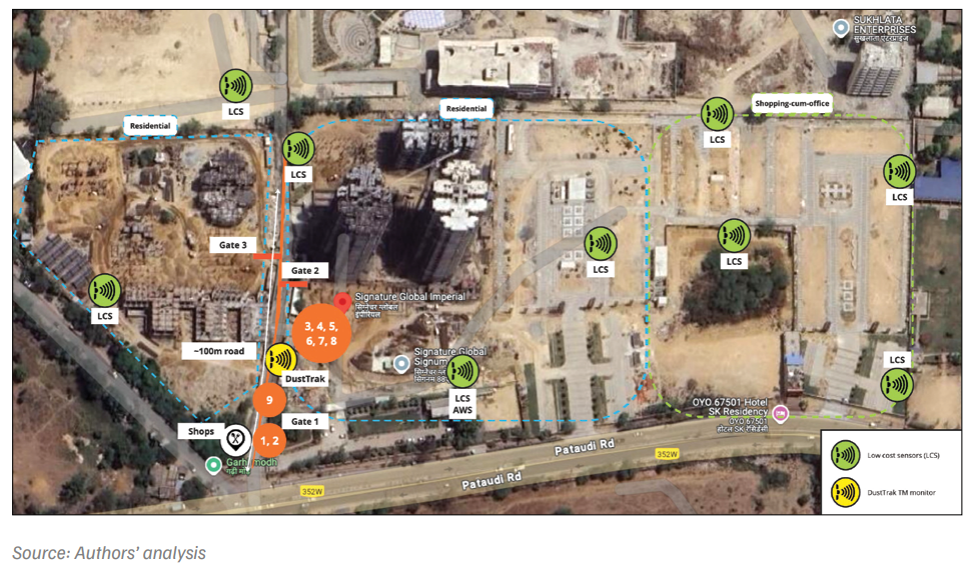
Figure ES 2. Journey map describing the vehicle entry process and target group interactions at the pilot site
Journey map
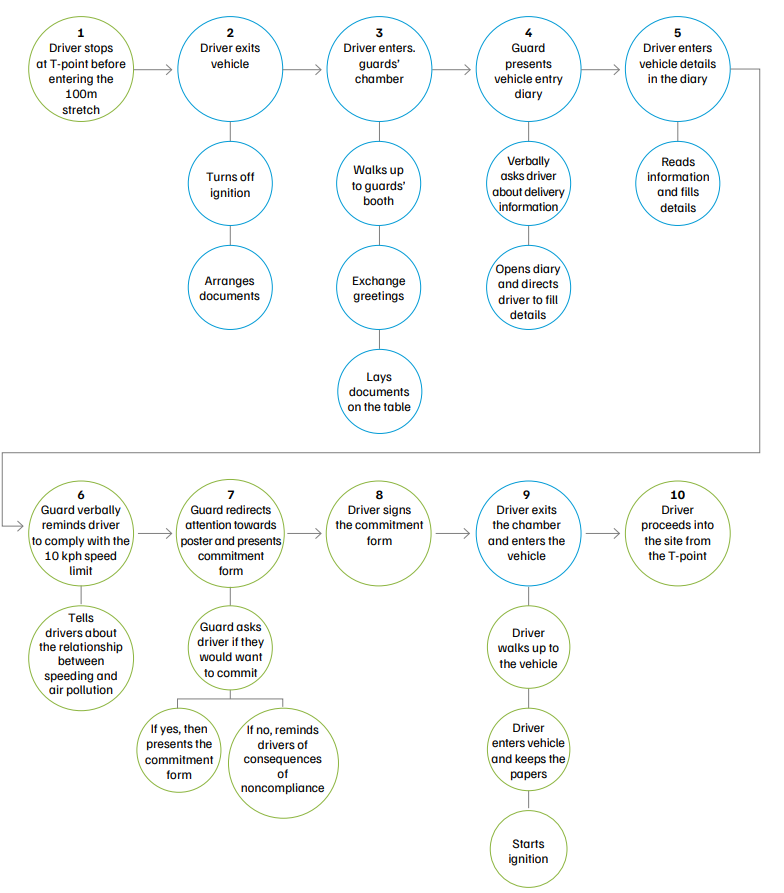
Source: Authors’ analysis
Note: Green circles represent the intervention scenario, while blue circles represent the business-as-usual scenario.
When drivers were made aware and reminded of speed limits, and voluntarily committed to controlling their speeds on site, compliance with the speed limit increased from 16 per cent during the pre-intervention phase to 63 per cent during the intervention phase.
This means, as drivers maintained compliant speeds, the average PM10 concentrations reduced by approximately 11 per cent, and PM2.5 concentrations decreased by about 29 per cent in comparison to the pre-intervention phase.
The meteorological parameters gathered using an automated weather station indicated that no other meteorological factors substantially impacted the PM concentration change (More in chapter 7) before and after the pilot intervention.
The pilot demonstrated that air pollution mitigation in a highly fragmented sector is more effective when solutions are practical, ‘doable’, and require low effort, rather than relying solely on punitive measures to improve compliance. These insights emerged from the study findings, interaction with stakeholders, and observations during the pilot, and formed the basis for the following recommendations.
By prioritising behavioural science principles such as altering the choice environment, increasing saliency of an issue (e.g., through visual aids, reminders), incentivising voluntary adoption (e.g., through commitments), and ascribing responsibilities (e.g., through verbal persuasion), the strategies below aim to scale actionable dust-mitigation practices without reliance on bans or enforcement-heavy policies.
This study highlights the need for empirical research to quantify how behavioural strategies can improve the adoption of sustainable practices in the construction sector, particularly through multi-stakeholder collaboration between researchers, institutions, and industry players. While large-scale pilots remain vital for systemic insights, builders and contractors can independently initiate low-cost, low-effort interventions to gauge the effectiveness of behavioural change. Such grassroots experimentation not only provides immediate, actionable insights, but also lays the groundwork for future collaborative research, bridging the gap between theoretical frameworks and real-world scalability of low-cost behaviour focussed interventions.
India’s construction sector, valued at approximately INR 72,000 crore (USD 885 billion) in 2023, is positioned for rapid expansion, projected to reach INR 1,79,000 crore (USD 2.1 trillion by 2030) (NMSC 2024). While this growth fuels economic development, it brings fresh challenges like air pollution, particularly in urban clusters like the National Capital Region (NCR). Construction and demolition (C&D) activities contribute 4 per cent of annual PM10 emissions in the NCR (TERI 2018), with prolonged exposure to particulate matter linked to severe respiratory and cardiovascular health risks for workers and nearby communities. Earlier studies have shown that prolonged exposure to dust can lead to both acute and short-term health problems, particularly among construction workers (Fuller et al. 2022; Wang et al. 2023).
The social cost of air pollution is stark. During severe air pollution episodes in 2022–2023, authorities imposed 73 days of blanket construction bans (CII 2023), causing project delays (Mishra 2024) and income losses for informal workers (Mahila Housing Trust 2024). Recognising the impact of bans on the socio-economic conditions of workers, the Delhi government provided financial assistance to nearly 10 lakh construction workers. However, this too, is not a sustainable solution. These reactive measures highlight a systemic gap in addressing the root causes of dust emissions, highlighting the need for proactive, context-specific, grassrootled, and balanced behaviour-focussed solutions.
Current regulatory approaches to control air pollution rely heavily on reactive, punitive measures (fines, bans), and collective accountability, neglecting the psychological and environmental drivers of noncompliance. Dust-mitigation guidelines often assume perfect adherence to technical solutions (e.g., anti-smog guns, water sprinkling) without addressing why frontline actors—contractual drivers, site supervisors, or security guards—fail to follow protocols every year. Compliance with the mandated 10 kph vehicular speed limit on site is low-about 16 per cent at the pilot site. This results in road dust resuspension and PM10 levels exceeding 12 times the national standard (749±1013 µg/m³ vs 60 µg/m³ NAAQS) in the surrounding areas. A low speed limit also has the benefit of improving air quality.
This disconnect reveals a critical gap. Policies prioritise ‘what’ must be done but ignore the ‘how’ and ‘why’ it should be done. The guidelines outline that large project (>20,000 sq.m) proponents are supposed to install air quality monitors, but lack specificity on how sites should monitor air quality, even though it mandates that they do so. Therefore, the first study in this series, ‘How can India reduce pollution from construction activities? Strengthening the monitoring regime’, addresses this critical gap by outlining three ways to monitor air quality at active C&D sites. To complement the technical aspects and mitigation, behavioural science offers an opportunity to use activity specific PM-concentration data into effective action plans to prioritise activities, diagnose barriers (e.g., time pressures and urgency, lack of awareness, lack of reminders etc), and design interventions that align with on-the-ground realities.
Road dust resuspension from heavy duty vehicles (HDVs) is a key PM source, contributing up to 50 per cent of emissions at construction sites (Giunta et al. 2019). In India, studies at active sites show PM10 peaks of 270 µg/m³ near unpaved roads frequented by HDVs (Alshetty and Nagendra 2022). Yet, traditional technical solutions (e.g., road paving, wheel washing) often fail due to costly and inconsistent implementation.
Designing processes rooted in behavioural science can complement existing policies and regulations by:
This study bridges the evidence gap by testing whether behaviourally informed strategies can reduce PM emissions at an active C&D site in Gurugram, India.
Study objectives
The study aims to:
This study also contributes to the growing evidence base around behavioural science and road dust mitigation. It:
The study proceeds as follows. Chapter 2 details the literature review, highlighting existing evidence and gaps in behavioural interventions in the C&D sector. Chapter 3 presents the pilot site’s context, highlighting worker testimonies and the status quo. Chapter 4 discusses the key behavioural barriers identified using the COM-B model. Chapter 5 discusses the solutions designed using the Behaviour Change Wheel (BCW) process and relevant Behaviour Change Techniques (BCTs). The pre and post pilot intervention design is discussed in Chapter 6. The results of the pilot intervention are discussed in Chapter 7, and the recommendations for policymakers and builders are discussed in Chapter 8.
There were two main objectives of the literature review: a) to identify existing evidence on behaviour change interventions in the construction context, and, b) to explore the correlations between vehicular speeds and their corresponding effects on PM concentrations.
While there has been growing attention on the impact of speed limits and other traffic regulations, more research is necessary to understand the effects of vehicular speeding on ambient air quality in and around construction and demolition (C&D) sites.
The UK Department for Enterprise’s guideline on controlling dust from construction and demolition activities (2003) recommends limiting vehicle speeds on unpaved roads to 5 mph (8 kph) to reduce dust resuspension. The guidelines highlight that slower vehicle speeds lead to lower dust generation. (Kukadia et al. 2003). The dust-mitigation guidelines set by India’s Central Pollution Control Board (CPCB), Haryana State Pollution Control Board (HSPCB), and the Commission for Air Quality Management (CAQM)—while acknowledging the role of vehicular activity in dust generation—do not explicitly mandate speed control as a standalone measure. The Construction & Demolition Waste Management Rules (2016), Guidelines on Environmental Management of Construction & Demolition Waste (2017), and Guidelines on Dust Mitigation Measures in Handling Construction Material and C&D Wastes (2017) identify dust-intensive activities and potential mitigation strategies. However, there’s limited focus on pollutant-intensive activities like vehicular movement, especially speed control, as a strategy for reducing air pollution.
Existing evidence suggests that vehicle movement on unpaved roads contributes to nearly 50 per cent of PM10 emissions at a construction site, while movement on paved roads contributes about 25 per cent (Giunta et al. 2019). Research indicates that vehicle speed influences particulate matter (PM) emissions. At lower speeds (<20 kph), particle numbers decrease with increasing vehicle-specific power, while moderate speeds (30–60 kph) show less sensitivity (Liu et al. 2017). Alshetty and Nagendra’s (2022) study on the impact of vehicular movement on road dust resuspension showed that maximum PM concentrations (PM10 = 270.1, PM2.5 = 71.8, PM1 = 56.3 µg/m3 ) were found at roads near construction activity due to the movement of HDVs carrying excavated earth overnight. Due to the prevailing dry and windy weather conditions, dust and mud from vehicular activities can resuspend dust both on and outside the site. Therefore, mitigating measures must be taken to minimise fugitive dust resuspension (DPCC and Clean Air Asia, 2023).
Dust emission rates are primarily influenced by several factors, including the vehicle’s weight (USEPA 2003), the amount of silt in the ground material (Jia et al. 2013), the moisture content in the soil (Gillies et al. 2005), and the vehicle’s speed (Nicholson et al. 1989; Gillies et al. 2005 ). Wang et al. (2023 ) found that vehicle speed and water content impacted the average concentration of total dust, respirable dust (RESP), and PM2.5.
While engineering approaches, like wheel-washing stations or using chemical suppressants, can reduce vehicle induced resuspended dust, they can be costly and time-consuming to deploy and maintain. Behavioural control, on the other hand, is a popular approach to influence behaviours (Kaluarachchi et al. 2021). Past research has overlooked worker motivations and behaviours related to dust mitigation (ibid).
Kaluarachchi et al. (2021) conducted a study in Sri Lanka, and found that raising awareness of consequences and assigning responsibility could positively influence personal norms, guiding construction workers to adopt dust-control measures. They also suggested that construction companies should initiate educational campaigns to raise awareness about environmental impacts, which could influence personal norms and promote pro-social and environmental behaviour.
A dust-pollution control study conducted in the Netherlands by Nij et al. (2003) found that younger construction workers were more likely to use pollution control measures, particularly respiratory protection, than older workers. This behaviour was attributed to workers’ understanding of the health implications associated with dust exposure.
AlSehaimi et al. (2013) argued that many issues in the construction industry could be addressed through alternative research methods, such as action research and constructive research. They noted that many published construction management studies often lack recommendations for enhancing project management practices. Discussions about change primarily focus on organisational change, with limited emphasis on individual-level behaviour change. Researchers have also highlighted that little attention has been given to the social and psychological aspects of construction management theory (Sunding and Ekholm 2015).
The sector’s fragmented project organisation, involving multiple collaborating companies, is often cited as a reason for coordination and challenges (Nawi et al. 2014).
Frequently, the psychological mechanisms driving compliance are left implicit. Research demonstrates that social norms influence compliance behaviour in various domains. For instance, appeals to social norms have been proven to increase tax compliance moderately (Alm et al. 2019). This suggests that exploring social norms, influencing accountability to improve compliance, may be fruitful. (Peat et al. 2021).
Making compliance effective requires understanding the reasons behind actors’ behaviours before criticising the status quo (Engel 2014). Existing literature categorises the factors influencing compliance into two main pillars: material considerations and normative considerations (Stein 2012. Material considerations encompass tangible elements, such as the costs associated with meeting compliance standards, and intangible aspects, like the fear of reputational damage resulting from non-compliance (Brewster 2009). Behavioural insights introduce a third ‘pillar’ to the factors influencing compliance decision-making, complementing the material and normative considerations. For instance, it has been observed that visible enforcement, combined with education and awareness, is associated with higher self-reported compliance, compared to covert operations (Van Houten et al. 2013; Dau et al. 2023). This third pillar accounts for psychological processes that impact decision-making, but do not neatly fit into the material or normative categories. One notable aspect of this behavioural pillar is the influence of individual emotions and attitudes, which shed light on the psychological factors shaping compliance decisions.
Influencing pro-environmental behaviours is an effective method to prevent dust generation. Previous research has largely overlooked the significance of changing workers’ behaviours by restructuring the choice environment at active construction sites, especially in the Indian context. Quantifying the benefits of air quality improvement in an active construction site due to behaviour change can provide valuable insights into the validity of novel techniques.
The behavioural intervention pilot aimed to increase compliance towards the speed limit of 10 kph by targeting the behaviours of drivers and security guards. Acknowledging the influence of system-level actors such as peers on site, contractors, and management, the solutions extend to build capacity and influence behaviours holistically at the pilot site.
The pilot site, >20,000 sq m, is located in Gurugram, Haryana. This site is divided into two sections: (i) residential area (RES) and (ii) shopping-cum-office (SCO) area. The pilot’s objective was to evaluate if behavioural interventions to reduce vehicular speed could decrease road dust resuspension from vehicles speeding at the pilot site.
Beyond literature, observing behaviours in action provides valuable insights into what people actually do rather than what they claim to do. (Sheeran 2016). Observation allows one to capture the nuances influencing the key behaviour. It may be time-consuming and logistically challenging, but it helps understand the interactions between people and processes in a realworld setting, allowing the behaviour to unfold naturally.
Sites attract different types of vehicles due to different activities—earthmovers for excavation, tankers for water sprinkling, trucks of various sizes for material transportation, motorbikes for deliveries, gardening, etc.—operating at different times and speeds. During the construction phases, a high volume of HDVs entered the site. From December 2023 to February 2024, the monthly average was 263 HDVs, increasing to 297 HDVs between April and June 2024. The lower numbers during the winter months can be attributed to restrictions on truck movement imposed during the Graded Response Action Plan periods (CAQM 2023).
The guards received a day’s notice regarding the expected vehicle traffic at the site, depending on the ongoing activities. This allowed them to prepare strategies to address dust emissions from vehicular movement, including scheduling water tankers for road surface sprinkling and the wheel washing station. However, there was little to no conversation about the impact of speeding vehicles on dust resuspension and its health and environmental effects.
In a business-as-usual scenario, HDV drivers exceeded the speed limit of 10 kph as they drove through the ~100-metre approach road, stopping at the material entry gate. As a result of speeding, visibly high levels of dust resuspension along the approach road were seen as a recurring problem by the site staff and outdoor workers. We also observed how guards communicated rules and guidelines to workers. After greeting each other inside the guards’ chamber, security guards prompted drivers to enter the details in the vehicle entry diary. Once filled, another guard stationed at the gates was instructed to allow the vehicle to enter the site. During this brief interaction, guards did not convey information regarding the site speed limit or any dust control measures to the drivers, thereby failing to raise speed control as a priority task for drivers. As a result, controlling speed remained a low priority among drivers.
High temperatures and soil conditions posed a concern during the summer months. The rapid drying of the soil led to dust resuspension due to vehicular movement and wind gusts, causing discomfort for pedestrians as well as security personnel and workers who spent most of their working hours outdoors at the construction site. This discomfort was particularly noticeable near the linear approach road. The downward-sloping ~100m road naturally encourages over speeding, increasing road dust concentrations along the stretch. The entry gate for vehicles and workers is situated along the approach road, contributing to higher pedestrian movement.
Our observations from the ground revealed that drivers alone are not responsible for overspeeding, even though they are behind the wheel. In many cases, the immediate context influences the behaviour, ultimately leading to overspeeding.
This involves looking beyond the driver alone, and considering the influence of other actors, such as contractors, guards, and peers. For example, a fine/penalty could be imposed on drivers exceeding prescribed speed limits. However, that does not guarantee that the driver will not break the speed limit in the future, or at a different site, if the problem sits within a different layer of the system (for example, speeding resulting as a result of ill-maintained vehicles with defunct speedometers—in which case contractors must be involved). Therefore, we can also consider designing an intervention targeted at different layers within the broad behavioural system. For instance, developing a customised awareness and training programme for vehicle contractors to outline dust-mitigation practices for their drivers could result in a more mindful workforce entering C&D sites.
During the day shift, 11 security guards were stationed at the nine-acre construction site to enforce internal guidelines related to vehicle movement and maintain a secure working environment. While the guards are permanent employees, the drivers are contractual. Since most of their time is spent outdoors, guards are at a higher risk of PM exposure, which can lead to health issues without practicing mitigating actions like wearing facemasks. Guards reported experiencing eye irritation, breathing difficulties, and headaches due to prolonged exposure to dust.
Having established the critical need to mitigate C&D-related dust for public health, the challenge lies in translating this urgency into actions. While the broader risks of PM exposure and the role of C&D activities as a source of PM are well-documented (as summarised in the Executive Summary), prioritising specific behaviours for intervention requires a contextual, data-driven approach.
The foremost step, the ‘target phase’, demands empirical grounding to identify which on-site activities disproportionately elevate PM levels, and where behavioural changes could yield the greatest results. Practitioners can move beyond generic solutions and focus on highimpact, context-specific actions by leveraging local air quality data, ensuring interventions align with both scientific evidence and practical feasibility for construction stakeholders.
For example, Table 1 highlights various ways to minimise dust generation during C&D activities. Several dust-generating activities operate in parallel at an active site across different phases, making it challenging to prioritise which clean construction activities to target for maximum effects. However, the availability of local activity wise PM concentration data enabled us to pinpoint the dust sources, and direct our intervention efforts towards the highest impact on dust mitigation. Builders can overcome the prioritisation challenge by monitoring activity wise PM concentration data and targeting the highest-polluting activities.
Table 1. Different dust-intensive activities at C&D sites require nuanced mitigation actions
| Dust-Intensive activities | Mitigating behaviours |
|---|---|
| Demolition | Water suppression, installation of windbreakers, installation and maintenance of green netting, wearing PPEs, covering of debris. |
| Excavation and earthmoving | Water sprinkling, operation of anti-smog guns, applying dust-control agents, proper vehicle maintenance, tarpaulin covering, lowering drop height. |
| Material handling and storage | Covering open materials, wetting materials, practicing proper storage practices, lowering drop height. |
| Concrete mixing and pouring | Wet mixing, enclosed mixing, proper material handling, low drop height. |
| Grinding, cutting, and drilling | Water-based tools, operation of HVAC systems, wearing PPEs. |
| Traffic on unpaved roads | Paving roads, water sprinkling, speed control. |
Source: Authors' analysis
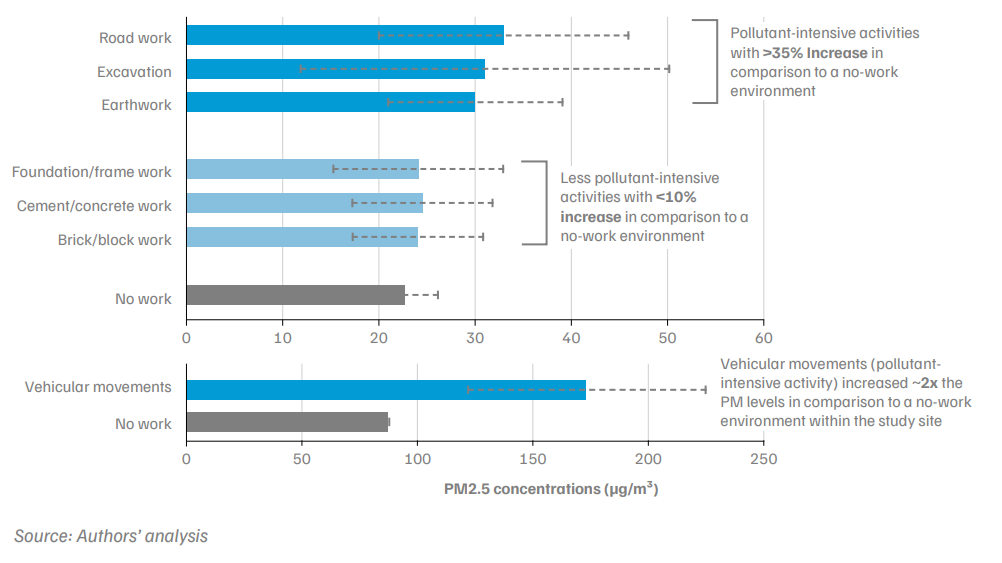
The study’s approach to selecting the target behaviour is rigorous, data-driven, and contextual. The air quality monitoring efforts at an active construction site in Gurugram, Haryana, evaluated the PM2.5 concentration levels during construction activities. Preliminary findings from a 15-day survey revealed that various construction activities contributed differently to PM2.5 levels (Figure 1). Various activities are carried out at a construction site, which can be categorised into two groups: pollutant-intensive activities and pollutant-non-intensive activities.
Pollutant-intensive activities generate substantial dust, increasing overall PM levels and demanding attention. These activities include vehicular movement, excavation, dust from unpaved roads, and any earth-related work within the site. As per the data gathered from the air quality monitoring network from the pilot site, these activities are the primary sources of dust pollution at construction sites. The study identifies vehicular activity as a category, and vehicle speeding as a key behaviour to influence speed compliance.
Zooming in on vehicular activity as a broader category, guidelines and findings from the literature suggest several actions to minimise dust generated by vehicles. These include speed control, drop height reduction during material unloading, water sprinkling, wheel washing, regular vehicle maintenance, covering materials with tarpaulins, etc. Each of these actions, while seemingly insignificant on their own, is an incremental step in achieving a larger goal (Behaviour Insights Team 2022).
Figure 1. Air quality data at pilot site suggests vehicle movement is most pollution-intensive
We identified that vehicular speeding above the prescribed speed limit (10 kph) was a significant source of dust resuspension, and thereby air pollution. Moreover, vehicular speed control is not explicitly highlighted as a ‘must do’ in existing dust-mitigation guidelines. Therefore, this study assesses the impact of behavioural interventions in improving the air quality at a C&D site by focussing on improving speed compliance. The target outcome is to reduce PM concentrations by lowering vehicular speeds at the construction site.
Table 2 provides a broader goal objective, corresponding target behaviour to achieve the objective, and target statements articulating the project’s aims. After defining the objectives and selecting the target behaviour, it is essential to specify the behaviour in its context. For example, the target statement ‘operating an anti-smog gun for 30 minutes during excavation’ highlights the specificities of the context. Table 3 breaks down the target behaviours, specifying who, what, when, where, and how often the target groups will perform the behaviour.
Table 2. Different dust-intensive activities at C&D sites require nuanced mitigation actions
| Goal objective | Target behaviour | Target statement | Key evaluation metrics |
|---|---|---|---|
| Minimising Particulate Matter (PM) emissions from C&D activities. | Comply with the vehicle speed limit of 10 kph at the construction site. | Increase driver compliance towards the site speed limit of 10 kph at the pilot construction area to reduce dust resuspension due to speeding. |
|
Source: Authors' analysis
Table 3. Specifying target behaviour provides clarity on who is supposed to do what differently, and when
| Who needs to perform the behaviour? | HDV drivers | Security guards |
|---|---|---|
| What do they need to do differently to achieve the desired change? | Maintain a speed limit of 10 kph while driving at the construction site. | Remind drivers of existing speed guidelines, the impact of over speeding on dust resuspension and air quality and introduce commitment form. |
| When do they need to do it? | When approaching and driving within the construction site. | When a driver is at the security booth to fill in entry details. |
| Where do they need to do it? | At the ~100m approach road and inside the site premises. | In the security booth at the T-point and dust-sensitive zones. |
| With whom do they need to do it? | Alone. | Other guards. |
| How often do they need to do it? | Always when driving through the approach road and unpaved road within the site. | Always before the vehicle travels through the ~100m approach road. |
Source: Authors' analysis
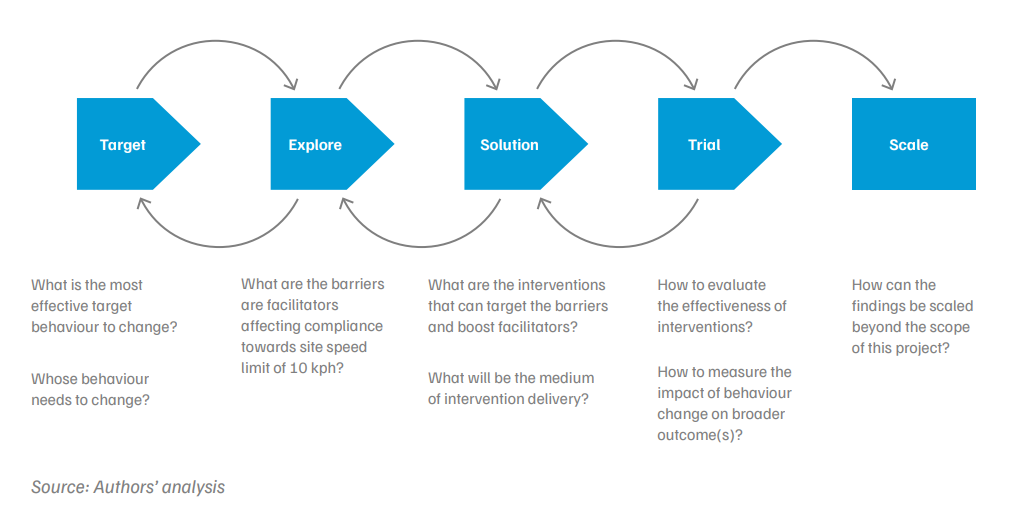
This study employed the five-step TESTS approach (Figure 2), developed by the Behavioural Insights Team, to run the behavioural intervention pilot. The TESTS technique, used in over 1,000 BI projects, has been successfully applied in various contexts (Behavioural Insights Team 2022). The five steps are as follows:
Figure 2. TESTS process of behaviour change research (Behaviour Insights Team 2022)
Identifying barriers to speed compliance using the COM-B model
According to the COM-B model, three fundamental factors influence behaviours:
Capability: This includes the physical and psychological abilities required to act, including physical strength and mental resources, such as skills, knowledge, memory, and attention.
Opportunity: A supportive environment is essential for facilitating intended behavioural change. It involves physical accessibility, affordability, social norms, and available time.
Motivation: A strong enough desire to adopt and sustain a particular behaviour compared to alternate options or inaction.
The COM-B model is a diagnostic tool for understanding what changes are required in the COM components to encourage a desired behaviour (West R. and Michie S. 2020). The model is contextual and seeks to capture the causal influences on an individual’s behaviour in a specific context.
Figure 3. Capability, Opportunity, Motivation (COM-B) Model
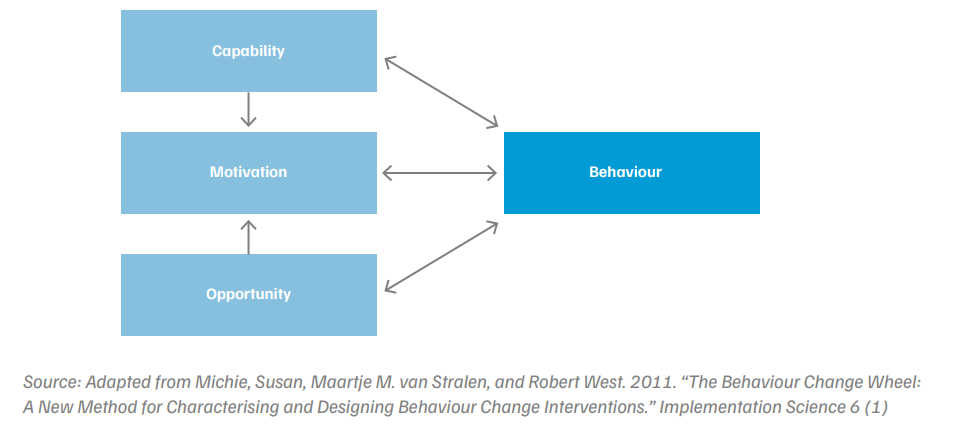
The simplest version of the COM-B model presents arrows connecting capabilities to motivations and opportunities to motivations, as well as double-headed arrows linking behaviours to each of capabilities, opportunities, and motivations (Figure 3). The arrow from capability to motivation illustrates that mental/cognitive abilities can influence motivations to engage in a behaviour. For instance, building awareness about the negative health impacts of dust exposure (capability) can boost workers’ motivation to adopt dust-control measures at construction sites. As workers become more aware of the health risks associated with dust exposure and recognise the benefits of a cleaner work environment and their individual role in mitigation, their motivation to utilise available resources increases.
Increasing opportunities can also drive motivation. For example, providing workers access to effective dust-suppression tools like water sprinklers and anti-smog guns enables them to engage in dust-management practices. A mix of knowledge, motivation, and the availability of opportunities to engage can lead to behavioural changes, such as consistently applying dustsuppression measures on time. Therefore, the interactions between capabilities, opportunities, and motivations are crucial for promoting the uptake of effective dust-mitigation behaviours among construction workers.
Based on the COM-B questionnaire guide (Annexure I ), focus group discussions and interviews with 11 day-shift security staff and 30 contractual HDV drivers revealed the challenges and barriers to speed enforcement and control. These interviews provided valuable insights about individual and system-level factors influencing speed regulation beyond the target groups, and the interactions between the broader network of actors, such as contractors, site managers, etc. These barriers result in low compliance and higher rates of dust resuspension, consequently leading to increased air pollution levels. The identified barriers and enablers correspond to all three components of behaviour: capability, opportunity, and motivation.
The identified barriers serve as a roadmap for the next phase where these insights will be leveraged to design targeted solutions. The study utilises the Behaviour Change Wheel (BCW) (Figure 4) process to design solutions.
The BCW is a tool that helps identify the functions an effective intervention can deliver to overcome barriers or facilitate enablers within each domain of the COM-B model. In total there are nine intervention functions: education, training, persuasion, enablement, environmental restructuring, restrictions, coercion, incentivisation and modelling. The intervention functions can be used singly or in combination to design solutions. Each intervention function is linked to a specific COM component. For instance, education or training can be used to boost capability or motivation. This study identified six intervention functions that will guide the design of a programme to increase compliance toward site speed limits:
Figure 4. Behaviour Change Wheel
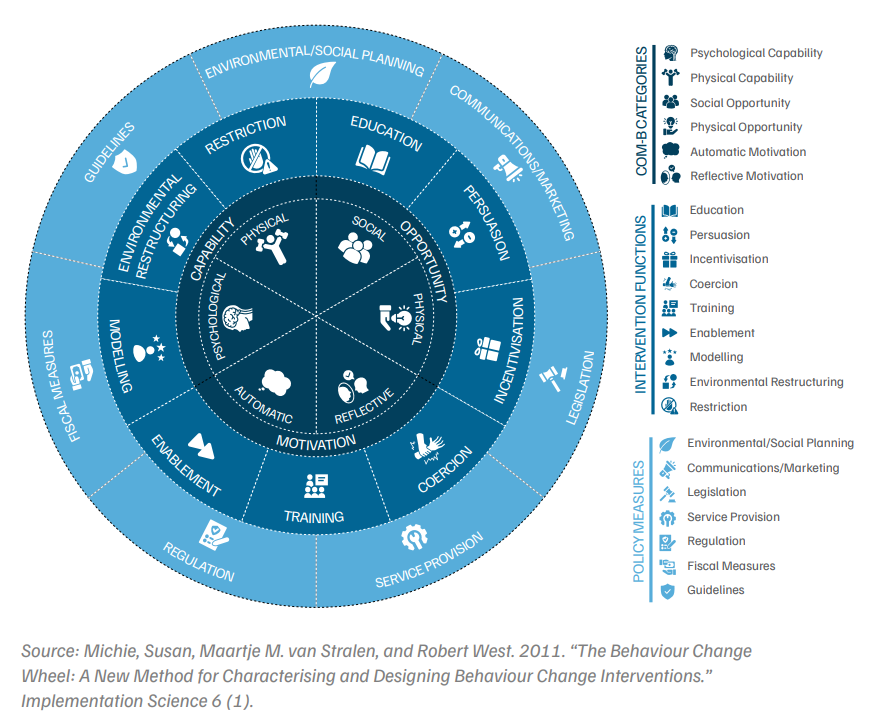
The BCW identifies evidence-based behaviour change techniques (BCTs) that can be applied to these intervention functions (Michie et al. 2013), and serve as implementational functions. The taxonomy lists and defines 93 distinct BCTs, the ‘key ingredients’ of intervention design. For example, verbal persuasion about capability (BCT 15.1) and goal setting (BCT 1.1) can both be used to boost motivation in some contexts.
The BCTs were used in combination (see Annexure II ) to design targeted interventions for both the target groups and system-level influencers, such as contractors. The interventions designed as part of the project and focussed explicitly towards speed control are described in the following section.
Signage with excessive text made it challenging for drivers to read instructions. The elevated seat position of most HDVs further adds to visibility issues. Speed signage was redesigned to convey the necessary instructions, and ensure all stakeholders understood the messages. Signage was also designed in Hindi, as most on-site workers required assistance reading English instructions. Additionally, the site staff installed speed signage in strategic locations within the construction site, including the approach road (where speeding was most prevalent).
B.J. Fogg’s B-MAP framework suggests that a well-timed trigger is crucial in driving behaviours in specific contexts. He also argues that if motivations are low, triggers may be ineffective. Similarly, frustration can arise when behaviour is triggered by individuals’ lack of the necessary abilities/capabilities (Fogg, 2009). A well-timed trigger can reduce distractions and redirect focus on the task.
During the brief interaction between the target groups in the guards’ chamber, guards presented a voluntary commitment form to HDV drivers. The commitment form aimed to set a speed control goal for drivers. It presented speed control as socially acceptable and recognised as a good practice by site staff. Incoming drivers signed the commitment form after being sensitised to the guidelines. The design of the form incorporated principles of social norm messaging (stating that other drivers adhere to the speed limit of 10 kph on site), picture superiority (highlighting the 10 kph speed sign), and the messenger effect (incorporating the logo of the construction company, and instruction from the security guard).
The pilot was conducted along a nearly 100-metre-long road stretch (approach road) with a high silt load. The research was divided into (i) the pre-intervention phase and (ii) the intervention phase. During the pre-intervention phase, in business-as-usual (BAU) operation, the speeds of each passing HDV and their corresponding PM concentrations were measured along the approach road, to ascertain the link between vehicular speeding and the changes in PM.
Similarly, during the intervention phase, we tested the effectiveness of solutions designed using the Behaviour Change Wheel (BCW) process in reducing vehicular speeding and PM along the approach road. During the construction project, various vehicles were observed, including heavy duty trucks and light motor vehicles such as two-wheelers, three-wheelers, and four-wheelers. Only heavy duty vehicles were included in the study. These vehicles, including ready mix cement (RMC) trucks, soil trucks, water tankers, earthmovers, and tractors, were chosen for their similar body weights and frequent use in various construction operations at the site. The movement of heavy duty vehicles varies depending on the different types of construction activities scheduled for each day. For example, on days when slabbing activities are planned, there is a higher influx of RMC trucks than on other days. Likewise, soil trucks and earthmovers move more frequently during excavation and earthwork days.
The speeds of various HDVs, pollutant levels (PM10 and PM2.5), and meteorological parameters were measured during the monitoring period. The counts of different types of HDVs, primarily RMC trucks, were recorded manually. A total of 91 vehicles were recorded between 10 a.m. and 6 p.m. during the monitoring phase in April and May, with 59 recorded in the preintervention phase and 32 recorded in the intervention phase. The vehicle counts varied depending on the frequency of vehicles needed for particular activities scheduled during that specific time at the site. The vehicle speeds were manually measured by recording the time it took for each HDV to travel the 100m road stretch.
Concentration data for particulate matter (PM) was collected using a portable, battery operated air quality monitor (DustTrak 8533). The monitor was positioned at the road’s midpoint (~50 metres) to assess changes in PM concentrations as each vehicle passed by. PM2.5 data was collected per second. The ambient PM concentration (PM2.5 and PM10) data was measured from the nearest low-cost sensor (LCS) deployed at the site. The selected LCS was devoid of any external influence from any other polluting source during the study period. Meteorological data were obtained from an automated weather station deployed at the pilot site, including temperature, relative humidity, wind speed, and wind direction.
Samples were collected on days when the roads were dry and without any rainfall, ensuring uniformity in data collection during the monitoring period. Other dust mitigation measures, such as water sprinkling and anti-smog guns, were also temporarily suspended during these monitoring days. Quality control procedures were implemented to discard any samples that could introduce bias into the results due to external interference or instrumentation errors. Out of the 91 observations, nine were excluded due to instrumental bias. The raw data was analysed by averaging data over five-second intervals and processing it with unit conversion and density correction using an ambient calibration factor of 0.38. Further statistical analysis and significance tests were conducted using the R software package (R Studio). We used Flourish Studio (app.flourish.studio) for data visualisation.
During the pre-intervention phase, about 84 per cent of vehicles were operating at speeds above the prescribed site speed limit of 10 kph.
PM concentration levels were measured for each passing HDV along the approach road’s midpoint to quantify the dust resuspension levels due to the vehicle movements. It was observed that the overall PM10 and PM2.5 concentrations during the pre-intervention period were 749 ug/m3 ±1013 and 381 ug/m3 ±498, respectively. The average PM concentrations were evaluated for vehicles running at speeds less than 10 kph and above 10 kph. Additionally, the speed ranges were categorised into three distinct groups: (i) speed 11–20 kph, (ii) speed 21–30 kph, and (iii) speed 31–40 kph, to evaluate the increasing PM levels with every additional 10 kph increase. The corresponding PM concentration values for different speed ranges for the pre-intervention phase are shown in Table 4. With higher speed levels, it was observed that there was an approximately threefold increase in the respective PM concentrations in comparison to lower speed levels (below 10 kph).
Table 4. Vehicle speeds during the intervention phase were lower than those recorded in the pre-intervention phase
| Pre-intervention (n=52) |
Overall average concentration $\pm$SD |
Overall concentration median | Average conc. for speed below 10 kph (n=9) |
Average concentration for speeds above 10 kph | ||
|---|---|---|---|---|---|---|
| 11-20 kph (n=23) |
21-30 kph (n=16) |
31-40 kph (n=4) |
||||
| PM10 | 749 ug/m3 ± 1013 | 331 ug/m3 | 401 ug/m3 ± 468 | 788 ug/m3 ± 1229 | 797 ug/m3 ± 910 | 1108 ug/m3 ± 1037 |
| PM2.5 | 381 ug/m3 ± 498 | 182 ug/m3 | 198 ug/m3 ± 164 | 373 ug/m3 ± 542 | 404 ug/m3 ± 432 | 744 ug/m3 ± 882 |
Source: Authors' analysis
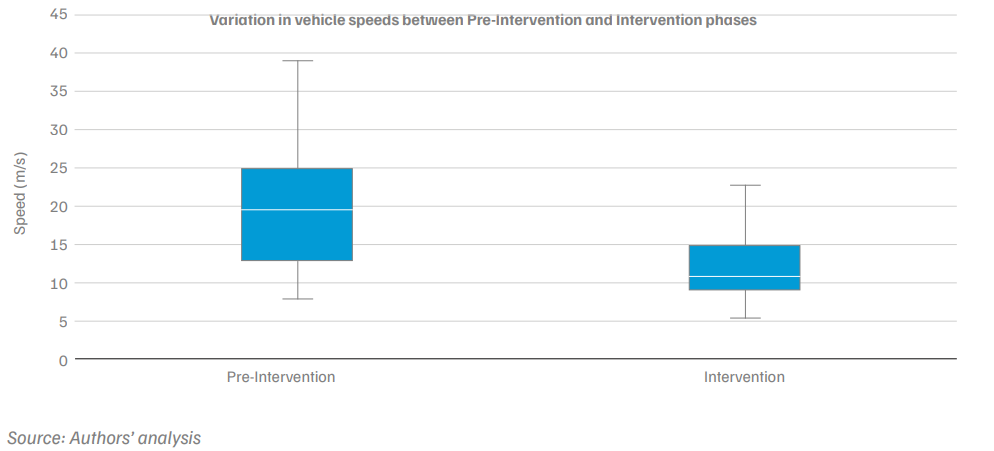
In the intervention phase, before entering the site, drivers were asked to sign a commitment and verbally persuaded by security guards about the importance of speed control. As a result of the verbal prompt by guards and commitment by drivers, it was observed that about 63 per cent of the drivers in the study area complied with the speed limit by maintaining speeds below 10 kph, compared to only 16 per cent in the pre-intervention phase. The box plot in Figure 5 illustrates the variation of vehicle speeds during both periods. It is seen that in pre-intervention phase, speeds of running vehicles ranged from 13 kph up to 25 kph, with a median close to 20 kph, whereas during the intervention phase the speeds appear to range from 8 kph up to 15 kph, with a median closer to 15 kph. This validated the effectiveness of the commitment device and improved awareness with higher number of vehicles running at lower speeds during the intervention phase.
Figure 5. Vehicle speeds during the intervention phase were lower than those recorded in the pre-intervention phase
The increase in speed compliance due to interventions reduced the overall PM concentration levels measured in the study stretch compared to the pre-intervention phase. Most vehicles ran at lower, compliant speeds after the intervention. Moreover, no vehicle was found to speed above 30 kph during the intervention phase. Table 5 shows the overall PM concentration levels at different speed ranges during the intervention phase.
Table 5. No vehicles exceeded 30 km/h during the intervention phase
| Pre-intervention (n=52) |
Overall average concentration $\pm$SD |
Overall concentration median | Average conc. for speed below 10 kph (n=9) |
Average concentration for speeds above 10 kph | ||
|---|---|---|---|---|---|---|
| 11-20 kph (n=23) |
21-30 kph (n=16) |
31-40 kph (n=4) |
||||
| PM10 | 670 ug/m3 ±872 | 300 ug/m3 | 371 ug/m3 ± 257 | 1194 ug/m3 ± 1359 | 1341 ug/m3 ± 1414 | |
| PM2.5 | 270 ug/m3 ±302 | 137 ug/m3 | 163 ug/m3 ± 89 | 443 ug/m3 ± 457 | 524 ug/m3 ± 491 | |
Source: Authors' analysis
A statistically significant difference (p-value = 0.001) was found between the two sample phases through significance tests (t-test), indicating a positive result of the intervention. The variation in the PM levels between pre-intervention and intervention phases is shown in the box plots in Figure 6.
Figure 6. Variations in particulate matter (PM) concentrations before and after the intervention
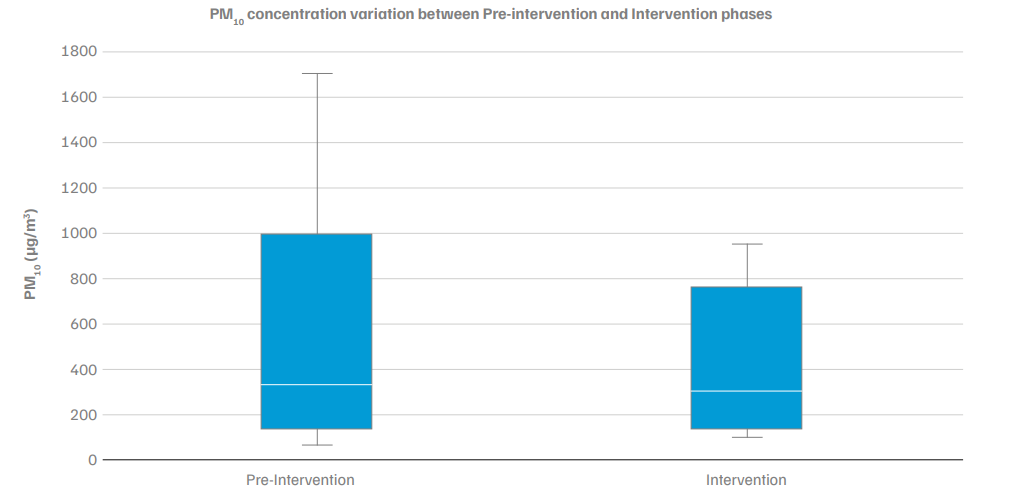
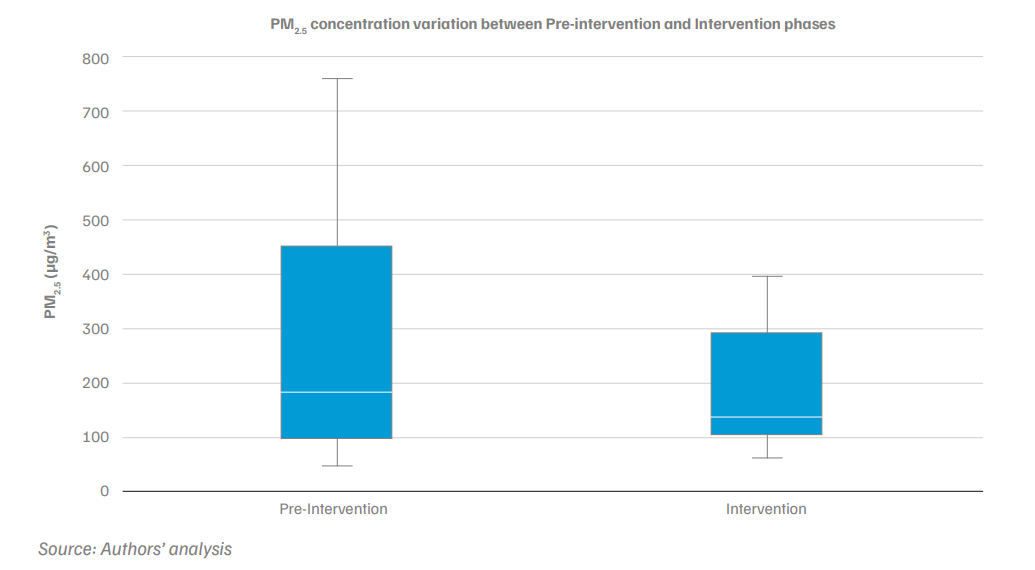
Why did PM2.5 reduce more than PM10?
Interestingly, the reduction of PM2.5 concentration levels was higher than PM10. PM2.5/PM10 ratios were computed for both the pre- and post-intervention phases to validate the observed results. The ratio was 0.6 during the pre-intervention phase and 0.4 during the intervention phase, indicating a predominance of coarser PM emissions in the road stretch during the latter period. Moreover, the ambient PM2.5/PM10 ratios were also calculated from a deployed LCS at the site, and they were found to be 0.83 for both phases.
This could be further explained by considering the time intervals of the speeding vehicles passing through the selected road stretch. During the pre-intervention phase, most vehicles ran at higher speeds with shorter intervals between consecutive passing vehicles. This contributed to the high resuspension of dust in the surrounding air. The resuspended dust consists of coarser (PM10) and finer (PM2.5) particulate matter. Finer particulate matter has a higher residence time than coarser particulate matter; hence, PM2.5 is lighter and remains suspended in the air longer than PM10. Thus, when PM concentrations were measured near the vehicles during the pre-intervention phase, the PM10 concentrations were solely attributable to the current passing vehicle. However, the PM2.5 concentrations also accounted for some suspended concentrations from the previous passing vehicle because PM2.5 did not have the same time to settle down as PM10.
However, during the intervention phase, there were fewer high-speed vehicles, with extended time intervals between consecutive vehicles. This gave sufficient time for both PM10 and PM2.5 to settle down ultimately, and the measured PM2.5 concentrations did not account for any previous concentrations. This iswhy PM2.5 reduced more throughout the trial than PM10.
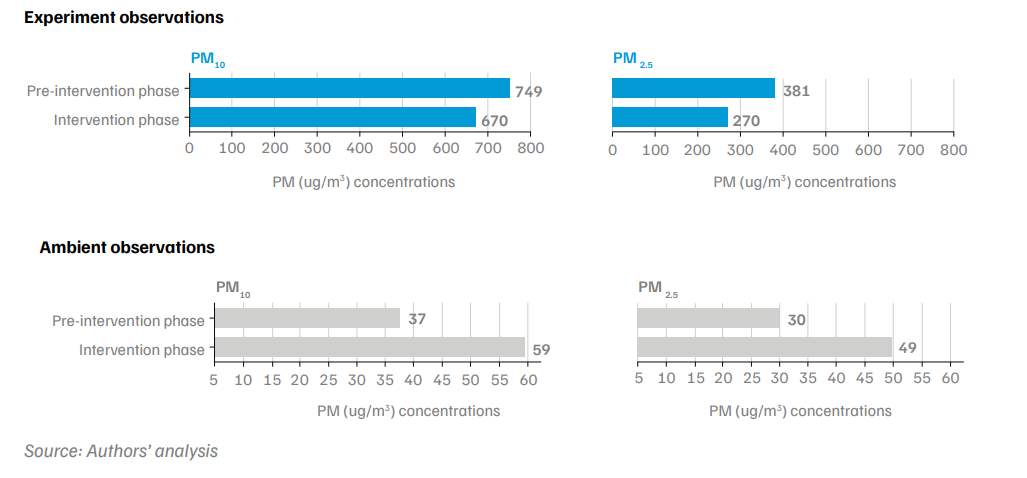
Ambient PM10 and PM2.5 concentrations were further assessed from the nearest deployed LCS at the site. It was observed that both the PM concentration levels increased (~60 per cent) during the intervention phase compared to the pre-intervention phase. Figure 7 compares the concentration variations of PM10 and PM2.5 during the intervention period for both ambient and experiment observations. The reliability of the deployed LCS was further assessed by comparing its PM concentration data with the nearby Continuous Ambient Air Quality Monitoring Stations (CAAQMS). The comparisons are shown in Annexure III, and a similar diurnal trend of PM2.5 concentrations is observed. Meteorological parameters were assessed for both phases to determine if they influenced PM concentration levels, potentially causing changes between the pre- and post-intervention phases. This evaluation was conducted to further validate the observed reduction in PM due to the intervention.
Figure 7. Comparison between experiment and ambient observations of PM10 and PM2.5 concentration variations during the intervention period
The wind direction remained consistent for both phases, predominantly from the west of the pilot site. Wind speeds ranged from 0.4 to 1.1 m/s during the pre-intervention period and were higher during the intervention phase, ranging from 2.4 to 2.7 m/s. The average temperature was recorded at 28.4°C during the pre-intervention phase and increased to 39.1°C during the intervention phase. Additionally, the average relative humidity was 40.8 per cent before the intervention and decreased to 22.5 per cent during the intervention phase.
Changes in PM concentrations due to speeding vehicles were measured close to the source (near passing vehicles). This indicates that the closer to the source, the changes in ambient wind speeds are unlikely to affect the dust resuspension observed in the PM readings from the DustTrak. Additionally, humidity levels were higher in the pre-intervention phase and lower during the intervention phase. This variation indicates that the reduced humidity during the intervention phase likely created a drier surface, which should increase dust resuspension and PM levels. However, the PM levels were found to decrease. This clearly shows that the intervention designed to reduce PM levels was effective, and that meteorological factors did not significantly influence the reduction of PM concentrations.
The comparison with the ambient pollutant concentration data revealed that even if there was an increase in the ambient concentration levels during the intervention phase, the experimental results showed a decreasing trend compared to the pre-intervention phase. The meteorological parameters indicate that no other contributing factors had any substantial impact on the PM concentration change before and after the application of the pilot intervention. Thus, the PM reduction can solely be attributed to behavioural change, where slower vehicular speeds led to lesser dust resuspension.
The battery of solutions deployed in this pilot demonstrates that measuring air quality at construction sites can lead to designing and encouraging targeted behavioural actions to reduce it. This offers one of many ways to utilise locally relevant data. Mitigating air pollution requires collective efforts from all stakeholders.
Stakeholders should recognise that a one-size-fits-all approach often fails to account for psychological and contextual barriers, adding to the challenge of implementing compliance mandates, especially in construction sites where working conditions change frequently. Strategic planning of project schedules, including site-specific dust-mitigation plans as priority sub-tasks, can help avoid the adverse impacts of construction bans.
To improve compliance through self-regulation, it’s crucial to make data available by monitoring air quality at active construction sites, ensuring data accessibility, and design processes, motivating workers to adopt easy, evidence-backed dust-mitigating behaviours. Data can also be used to prioritise actions and develop tailored mitigation strategies.
Dust-mitigation guidelines should include a framework for monitoring air quality using low-cost sensors at C&D sites. This will not only generate valuable local data but also help track progress. The first part of this three-part study outlines a framework highlighting three ways to monitor air quality at construction sites based on local considerations (Patra et al. 2025). The current mandate recommends installing air quality monitors at construction sites over 20,000 square metres. However, as the construction sector rapidly expands, small and medium-sized infrastructure, commercial, and residential projects are common in most urban neighbourhoods. Therefore, it is crucial to monitor air quality at large construction projects and smaller ones (less than 20,000 square metres) close to community settlements to devise locally relevant and implementable dust-mitigation plans.
While preparing emergency measures like GRAP, regulators should ensure air quality monitoring for construction sites. The PCBs, urban local bodies (ULBs) or planning departments should mandate the drafting of dust-mitigation plans and data sharing before clearing the construction site plan.
Policymakers should highlight clean construction as a reputational boon with commercial value. A national campaign focussed on dust mitigation, closely tied to reputational benefits, will enable constructors to differentiate themselves in a competitive market by showcasing their commitment to high standards of practice. Membership in such a programme should enable collaboration with leading industry players, small or large, committed to best practices. The programme should develop a culture of knowledge-sharing, keeping dust-mitigation as the focal point.
For example, the Considerate Constructors Scheme (CCS) and the Considerate Contractor Scheme (City of London) in the United Kingdom are voluntary initiatives to improve the construction industry’s public image through commitments. Introduced in 1997, the scheme encourages construction companies to follow a Code of Considerate Practice, which promotes best practices, including dust mitigation, that exceed legal requirements. The CCS seeks to address concerns about the construction industry’s impact on communities and the environment. While participation is voluntary, many companies join to gain recognition and improve their reputation, which can be leveraged to secure future contracts. Members of the CCS publicly display their commitment to being ‘Considerate Constructors’. Such programmes, linked to reputational perks, enable builders and constructors to showcase their commitment to high standards and involve public participation. Since the scheme’s introduction, more than 200,000 compliance visits have been completed to improve construction standards, and over 200 public complaints are addressed on average each month.
Currently, the first phase of Mission LiFE focusses on behaviour categories such as energy and water usage, waste generation, and adoption of sustainable food systems. However, it is crucial to consider sectoral actions like C&D in the initial phase, as individual behaviours significantly impact emissions within this sector.
While Mission LiFE primarily focusses on encouraging individual and household-level behaviours, there is merit in expanding the scope to include sectoral interventions that can directly reduce emissions. In the first phase of Mission LiFE, a battery of behaviour interventions can be developed for industries and sectoral stakeholders to adopt. Incorporating incentives for adopting LiFE behaviours has excellent potential for scaling up the adoption of subtle behavioural changes for larger outcomes.
Integrating a dust-mitigation plan from the outset would allow builders to anticipate potential dust-related challenges and mobilise resources. For example, pollutantintensive activities like excavation can be planned during seasons with favourable meteorological conditions. Regularly taking stock of mitigation efforts and flexible strategies can ensure that dust-control measures remain effective throughout the project lifecycle.
The immediate environmental surroundings influence how people interact with the available choices in a given context. Builders must prioritise designing site layouts that intuitively minimise unnecessary efforts and increase operational efficiency. A well-planned site can reduce dust generation and improve overall workflow.
Setting up a dedicated air quality monitoring room and appointing staff to coordinate efforts can significantly streamline air quality management at construction sites. Housed in a cost-friendly shipping container, the air quality monitoring room at the pilot site is equipped with WiFi, laptop/PC, an automatic weather station sensor (AWS) dashboard, an air conditioner to provide relief during the harsh summer months, and a TV screen to view the dashboard. A dedicated room and staff streamline dust-mitigation efforts.
Ambiguity about who is responsible, and when to act, often leads to inaction, as individuals may be unaware of, or not feel personally accountable for, the overall poor air quality. Building personal responsibility and accountability through improved awareness and seeking short-term commitments is essential in areas where imposing a financial penalty is not feasible. Contractors are regularly in touch with workers and can play a key role in communicating important information. Messages regarding dust mitigation should be communicated by trusting and concerned supervisors or managers. The broad goal of dust mitigation should appear to be achievable by all. Therefore, builders and site managers must explore establishing accountability among concrete individuals rather than abstract organisations.
This study quantifies the impact of a behavioural intervention package on air quality improvement, specifically reducing PM concentration levels from vehicular movement at a construction site. Collaborating with builders and policymakers, further research should be conducted to increase adoption, and quantify the effectiveness of clean construction practices. Reducing pollution from construction activities requires partnerships and coordinated efforts between policymakers, industries, researchers, and workers on the ground.
This study, which leveraged interventions informed by behavioural science to reduce air pollution from C&D activities, presents several notable strengths along with certain acknowledged limitations.
Strengths
Limitations
While the challenge of dust pollution seems uniform across urban centres, there are many means to mitigate dust, requiring a more targeted and human-centric approach. To identify, influence, and change existing behaviours or processes for positive environmental outcomes, authorities and real estate developers must consider adopting proactive, data-driven, behaviour-focussed strategies.
Different target groups face unique barriers and facilitators in achieving a behavioural goal. This study employs hyperlocal air quality data to target polluting activities, using the COM-B model and the Behaviour Change Wheel process to identify behavioural barriers and design an intervention programme for security guards and HDV drivers to increase speed compliance and reduce dust resuspension. The goal was to reduce particulate matter concentrations from speeding vehicles at an active construction site. The study’s approach focusses on increasing self-regulation and compliance through ‘softer’, affordable, and scalable solutions for dustmitigation practices.
Behavioural interventions have been successfully applied in various sectors, such as increasing bicycle usage (Bishop et al. 2024), promoting waste management (Manika et al. 2022), and encouraging healthier diets (Curtis et al. 2017). As demonstrated in the results of this pilot, adopting a behavioural approach when designing implementation strategies can also ensure effective dust mitigation during C&D activities.
Existing guidelines provide a foundation for designing behavioural interventions. In the C&D context specifically, key behaviours for mitigating dust are well-defined. They distinguish between more- and less-dust-intensive activities, and outline mitigation measures, allowing construction management to prioritise implementation strategies that meet the unique contextual needs of the staff and workers. Construction management can ensure better compliance and self-regulation by building capacity, ascribing responsibilities, holding individual actors accountable for meeting compliance standards, and by making air pollution a salient issue.
Achieving the goal of dust mitigation at C&D sites requires the active participation of various actors, such as workers, foremen, managers, and also C-level executives. The top management can pave the way for project teams to adopt cleaner practices by developing, enforcing, and communicating in-house dust-mitigation guidelines, and recognising model sites for others to emulate.
Ultimately, environmental action translates into behavioural action. Therefore, creating systems and processes that minimise friction and facilitate a smoother transition for individuals toward environmentally sustainable practices is valuable. By reducing barriers to sustainable behaviours, more people can be encouraged to make choices that benefit the environment and society.
Alm, James, and Matthias Kasper. 2022. “Using Behavioural Economics to Understand Tax Compliance.” Economic and Political Studies, September.
Alsehaimi, Abdullah, Lauri Koskela, and Patrícia Tzortzopoulos. 2013. “Need for Alternative Research Approaches in Construction Management: Case of Delay Studies.” Journal of Management in Engineering 29 (October):407–13. https://ascelibrary.org/doi/10.1061/%28ASCE%29ME.1943-5479.0000148.
Alshetty, Dheeraj, and S. M. Shiva Nagendra. 2022. “Impact of Vehicular Movement on Road Dust Resuspension and Spatiotemporal Distribution of Particulate Matter during Construction Activities.” Atmospheric Pollution Research 13 (1): 101256. https://www.sciencedirect.com/science/article/abs/pii/S1309104221003184?via%3Dihub
Baca-Motes, Katie, Amber Brown, Ayelet Gneezy, Elizabeth Keenan, and Leif Nelson. 2013. “Commitment and behaviour Change: Evidence from the Field.” Journal of Consumer Research 39 (February):1070–84. https://academic.oup.com/jcr/article-abstract/39/5/1070/1794934?redirectedFrom=fulltext
Banerjee, Sanchayan, and Peter John. 2024. “Nudge plus: Incorporating Reflection into behavioural Public Policy.” Behavioural Public Policy 8 (1): 69–84. https:// doi.org/10.1017/bpp.2021.6.
Barker, Fiona, Lou Atkins, and Simon de Lusignan. 2016. “Applying the COM-B Behaviour Model and Behaviour Change Wheel to Develop an Intervention to Improve Hearing-Aid Use in Adult Auditory Rehabilitation.” International Journal of Audiology 55 (sup3): S90–98. doi:10.3109/14992027.2015.1120 894
Barros, Gustavo. 2010. “Herbert A. Simon and the Concept of Rationality: Boundaries and Procedures.” Revista de Economia Política 30 (September):455–72. https://www.scielo.br/j/rep/a/CWfwPPVWKvLrndfxR9vYFHL/?lang=en.
Behavioural Insights Team. 2022. “Target, Explore, Solution, Trial, Scale: An introduction to running simple behavioural insights projects”. Accessed on 15 July 2024. https://www.bi.team/wp-content/uploads/2022/11/BIT-Handbook-How-to-run-simple-BI-projects.pdf
Bishop, Daniel T., Prathiba Batley, Huma Waheed, Tamara S. Dkaidek, Gabriela Atanasova, and David P. Broadbent. 2024. “Barriers and Enablers for Cycling: A COM-B Survey Study of UK Schoolchildren and Their Parents.” Journal of Transport & Health 35 (March):101765. https://www.sciencedirect.com/science/article/pii/S2214140524000112?via%3Dihub.
Bisoyi, Bhubaneswari, and Biswajit Das. 2023. “A Paradigm Shift: Nano-Sensory Nudges Stimulating Consumer’s Purchase Behaviour for Green Products Driving towards Environmental Sustainability.” Materials Today: Proceedings, SI:5 NANO 2021, 80 (January):3887–92. https://doi.org/10.1016/j. matpr.2021.07.407.
Bont, Jeroen de, Bhargav Krishna, Massimo Stafoggia, Tirthankar Banerjee, Hem Dholakia, Amit Garg, Vijendra Ingole, et al. 2024. “Ambient Air Pollution and Daily Mortality in Ten Cities of India: A Causal Modelling Study.” The Lancet Planetary Health 8 (7): e433–40.
Boyum, Keith O. 1983. “The Politics of ‘Regulatory Unreasonableness’: Bardach and Kagan’s Going by the Book.” Law & Social Inquiry 8 (3): 752–60. https://www.cambridge.org/core/journals/american-bar-foundation-research-journal/article/abs/politics-of-regulatory-unreasonableness-bardach-and-kagans-going-by-the-book/789CA9114D61CA6D51B860DF044D6AE4.
Brewster, Rachel. 2009. “Unpacking the State’s Reputation.” Harvard International Law Journal 50.
Cai, Cynthia Weiyi. 2020. “Nudging the Financial Market? A Review of the Nudge Theory.” Accounting & Finance 60 (4): 3341–65. https://onlinelibrary.wiley.com/doi/10.1111/acfi.12471.
CII. 2023. “CII.” Infrastructure. January 10, 2023. https://www.cii.in/ResourceDetails.aspx?enc=CDXkxf2ohwnf/x8bjvvqW51E+iJPwDpJSd7izsILBh8r9rR2sT8O8QOz4zHlWBBOhkeDXyhlVLFPHvmya/hxmQYoP2CVRscJjAv6hsdPkiZBV7gLrCidDDqG7GoL+JWIyY4vfO1BfsqfgEfjagML/I6DOpV37lGWkNDbberDuLuuyWVCNF5NZ/9qEeNzzpJT
Conner, Mark, and Paul Norman. 2022. “Understanding the Intention-behaviour Gap: The Role of Intention Strength.” Frontiers in Psychology 13 (August). https://www.frontiersin.org/journals/psychology/articles/10.3389/fpsyg.2022.923464/full.
Curtis, Kristina, Louise Atkins, and Katherine Brown. 2017. “Big Hearts, Small Hands: A Focus Group Study Exploring Parental Food Portion Behaviours.” BMC Public Health 17 (1): 716. https://bmcpublichealth.biomedcentral.com/articles/10.1186/s12889-017-4711-z.
Dau, Philipp M., Christophe Vandeviver, Maite Dewinter, Frank Witlox, and Tom Beken. 2021. “Policing Directions: A Systematic Review on the Effectiveness of Police Presence.” European Journal on Criminal Policy and Research 29 (November). https:// doi.org/10.1007/s10610-021-09500-8.
Day, Robert W. 1993. “Accidents on Interstate Highways Caused by Blowing Dust.” Journal of Performance of Constructed Facilities 7 (2): https://ascelibrary.org/doi/10.1061/%28ASCE%290887-3828%281993%297%3A2%28128%29
DPCC, Clean Air Asia. 2023. “Advancing better air quality through clean construction.” https://dustcontroldpcc.delhi.gov.in/Upload/GuidelinesPDF/43/FilePDF_43_935245.pdf
Engel, Christoph. 2014. “Social Preferences Can Make Imperfect Sanctions Work: Evidence from a Public Good Experiment.” Journal of Economic behaviour & Organization 108 (December):343–53. https://www.sciencedirect.com/science/article/abs/pii/S0167268114000547?via%3Dihub.
Etyemezian, V., H. Kuhns, J. Gillies, M. Green, M. Pitchford, and J. Watson. 2003. “Vehicle-Based Road Dust Emission Measurement: I—Methods and Calibration.” Atmospheric Environment 37 (32): 4559– 71. https://www.sciencedirect.com/science/article/abs/pii/S1352231003005284?via%3Dihub.
Fogg, BJ. 2009. “A behaviour Model for Persuasive Design.” In Proceedings of the 4th International Conference on Persuasive Technology, 1–7. Persuasive ’09. New York, NY, USA: Association for Computing Machinery. https://dl.acm.org/doi/10.1145/1541948.1541999.
Fuller, Richard, Philip J. Landrigan, Kalpana Balakrishnan, Glynda Bathan, Stephan Bose-O’Reilly, Michael Brauer, Jack Caravanos, et al. 2022. “Pollution and Health: A Progress Update.” The Lancet Planetary Health 6 (6): e535–47. https://www.thelancet.com/journals/lanplh/article/PIIS2542-5196(22)00090-0/fulltext.
Ganz, Gary, Fergus G. Neville, and Catherine L. Ward. 2017. “Applying Behavioural Science to Issues of Public Health in South Africa: The Case for Social Norms Intervention.” South African Journal of Science 113 (5/6): 5–5. https://sajs.co.za/article/view/3802.
Ghosh S, Kumar A, Ganguly D, Dey S. 2023. India’s photovoltaic potential amidst air pollution and land constraints. iScience. Sep 9;26(10):107856. doi: 10.1016/j.isci.2023.107856. PMID: 37817936; PMCID: PMC10561047.
Gillies, J. A., V. Etyemezian, H. Kuhns, D. Nikolic, and D. A. Gillette. 2005. “Effect of Vehicle Characteristics on Unpaved Road Dust Emissions.” Atmospheric Environment, 12th International Symposium, Transport and Air Pollution, 39 (13): 2341–47. https://www.sciencedirect.com/science/article/abs/pii/S1352231005000798?via%3Dihub.
Giunta, Marinella, Dario Lo Bosco, Giovanni Leonardi, and Francesco Scopelliti. 2019. “Estimation of Gas and Dust Emissions in Construction Sites of a Motorway Project.” Sustainability 11 (24): 7218. https://www.mdpi.com/2071-1050/11/24/7218.
Gupta, Kamini, and Hari Bapuji. 2023. “Heterogeneity Among Migrant Workers and Creating Inclusive Organizations.” Academy of Management Proceedings 2023 (1): 14898. https://journals.aom.org/doi/abs/10.5465/AMPROC.2023.14898abstract.
Hahad, Omar, Jos Lelieveld, Frank Birklein, Klaus Lieb, Andreas Daiber, and Thomas Münzel. 2020. “Ambient Air Pollution Increases the Risk of Cerebrovascular and Neuropsychiatric Disorders through Induction of Inflammation and Oxidative Stress.” International Journal of Molecular Sciences 21 (12): 4306. https:// doi.org/10.3390/ijms21124306.
Handley, Margaret A., Anuradha Gorukanti, and Adithya Cattamanchi. 2016. “Strategies for Implementing Implementation Science: A Methodological Overview.” Emergency Medicine Journal: EMJ 33 (9): 660–64. https://emj.bmj.com/content/33/9/660.
Kukadia, Vina, Upton, Stuart, and Hall, David. 2003. “Control of dust from construction and demolition activities”.
Jennings, Viniece, and Omoshalewa Bamkole. 2019. “The Relationship between Social Cohesion and Urban Green Space: An Avenue for Health Promotion.” International Journal of Environmental Research and Public Health 16 (3): 452. https://www.mdpi.com/1660-4601/16/3/452.
Jia, Qi, Y Huang, Nadhir Al-Ansari, and Sven Knutsson. n.d. “Dust Emission from Unpaved Roads in Luleå, Sweden.”
Johari, Sparsh, and Kumar Neeraj Jha. 2020. “Challenges of Attracting Construction Workers to Skill Development and Training Programmes.” Engineering, Construction and Architectural Management 27 (2): 321–40. https://www.emerald.com/ecam/article-abstract/27/2/321/231058/Challenges-of-attracting-construction-workers-to?redirectedFrom=fulltext.
Kaluarachchi, Mekhala, Anuradha Waidyasekara, Raufdeen Rameezdeen, and Nicholas Chileshe. 2021. “Mitigating Dust Pollution from Construction Activities: A Behavioural Control Perspective.” Sustainability 13 (August):1–19. https://www.mdpi.com/2071-1050/13/16/9005.
Lee, Wanhyung, Jae-Gwang Lee, Jin-Ha Yoon, and JuneHee Lee. 2020. “Relationship between Occupational Dust Exposure Levels and Mental Health Symptoms among Korean Workers.” PLOS ONE 15 (2): e0228853. https://journals.plos.org/plosone/article?id=10.1371/journal.pone.0228853.
Liu, Jia, Yunshan Ge, Xin Wang, Lijun Hao, Jianwei Tan, Zihang Peng, Chuanzhen Zhang, Huiming Gong, and Ying Huang. 2017. “On-Board Measurement of Particle Numbers and Their Size Distribution from a Light-Duty Diesel Vehicle: Influences of VSP and Altitude.” Journal of Environmental Sciences 57 (July):238–48. https:// doi.org/10.1016/j.jes.2016.11.023.
Lokhorst, Anne Marike, Carol Werner, Henk Staats, Eric van Dijk, and Jeff L. Gale. 2013. “Commitment and behaviour Change: A MetaAnalysis and Critical Review of CommitmentMaking Strategies in Environmental Research.” Environment and behaviour 45 (1): 3–34. https://journals.sagepub.com/doi/10.1177/0013916511411477.
Maclean, Johanna Catherine, John Buckell, and Joachim Marti. 2019. “Information Source and Cigarettes: Experimental Evidence on the Messenger Effect.” w25632. Cambridge, MA: National Bureau of Economic Research. https://www.nber.org/system/files/working_papers/w25632/w25632.pdf.
Mahila Housing Trust. 2024. “Baseline study on Delhi women construction workers + air pollution”. MHT. https://drive.google.com/file/d/1Ow6nwp8doIdYpy1uSeJeZDbnne8U310Y/view
Manika, Danae, Eleni Iacovidou, Ana Canhoto, Eujin Pei, and Khanh Mach. 2022. “Capabilities, Opportunities and Motivations That Drive Food Waste Disposal Practices: A Case Study of Young Adults in England.” Journal of Cleaner Production 370 (October):133449. https://www.sciencedirect.com/science/article/pii/S0959652622030311?via%3Dihub.
Martin, Emmett, and Laura Warner. 2015. “Using Commitment as a Tool to Promote behaviour Change in Extension Programming.” The Journal of Extension 53 (4). https://open.clemson.edu/joe/vol53/iss4/32/.
McCarron, Amy, Sean Semple, Christine F. Braban, Vivien Swanson, Colin Gillespie, and Heather D. Price. 2023. “Public Engagement with Air Quality Data: Using Health Behaviour Change Theory to Support ExposureMinimising Behaviours.” Journal of Exposure Science & Environmental Epidemiology 33 (3): 321–31. https:// doi.org/10.1038/s41370-022-00449-2.
McKay, Alexander S., Jeffrey B. Lovelace, and Matt C. Howard. 2018. “Chapter 10 - The Heart of Innovation: Antecedents and Consequences of Creative SelfEfficacy in Organizations.” In Individual Creativity in the Workplace, edited by Roni Reiter-Palmon, Victoria L. Kennel, and James C. Kaufman, 223–44. Explorations in Creativity Research. Academic Press. https://www.sciencedirect.com/science/article/abs/pii/B9780128132388000103?via%3Dihub.
Michie, Susan, Maartje M. van Stralen, and Robert West. 2011. “The Behaviour Change Wheel: A New Method for Characterising and Designing Behaviour Change Interventions.” Implementation Science 6 (1): 42. https://implementationscience.biomedcentral.com/articles/10.1186/1748-5908-6-42.
Michie, Susan, Michelle Richardson, Marie Johnston, Charles Abraham, Jill Francis, Wendy Hardeman, Martin P. Eccles, James Cane, and Caroline E. Wood. 2013. “The behaviour Change Technique Taxonomy (v1) of 93 Hierarchically Clustered Techniques: Building an International Consensus for the Reporting of behaviour Change Interventions.” Annals of behavioural Medicine 46 (1): 81–95. https://academic.oup.com/abm/article-abstract/46/1/81/4563254?redirectedFrom=fulltext.
Mishra, Ashish. 2024. “Breathe Today, Build Tomorrow: Developers Fume, Say Delhi Construction Ban Will Delay Projects.” Accessed December 27, 2024. https:// www.moneycontrol.com/news/business/real-estate/ breathe-today-build-tomorrow-developers-fume-saydelhi-construction-ban-will-delay-projects-12869634. html.
MohanKumar SM, Campbell A, Block M, Veronesi B. Particulate matter, oxidative stress and neurotoxicity. Neurotoxicology. 2008. May;29(3):479-488. doi: 10.1016/j.neuro.2007.12.004.
Mohd Nawi, Mohd Nasrun, Nazim Baluch, and Ahmad Yusni Bahaudin. 2014. “Impact of Fragmentation Issue in Construction Industry: An Overview.” In . Vol. 15.
Mormann, Felix. 2022. “Climate Choice Architecture.” SSRN Scholarly Paper. Rochester, NY. https://papers.ssrn.com/sol3/papers.cfm?abstract_id=4096179.
Murtagh, E. M., A. T. Barnes, J. McMullen, and P. J. Morgan. 2018. “Mothers and Teenage Daughters Walking to Health: Using the Behaviour Change Wheel to Develop an Intervention to Improve Adolescent Girls’ Physical Activity.” Public Health, Special issue on Migration: A global public health issue., 158 (May):37–46. https://www.sciencedirect.com/science/article/abs/pii/S0033350618300155?via%3Dihub.
Nicholson, K. W., J. R. Branson, P Giess, and R. J. Cannell. 1989. “The Effects of Vehicle Activity on Particle Resuspension.” Journal of Aerosol Science, Proceedings of the 1989 European Aerosol Research, 20 (8): 1425– 28. https://www.sciencedirect.com/science/article/abs/pii/0021850289908537?via%3Dihub.
NMSC. 2024. “India Construction Market Value Analysis | 2024-2030.”. Accessed December 8, 2024. https://www.nextmsc.com/report/india-construction-market.
Nolan, Jessica M., and Kenneth E. Wallen. 2021. “Social Norms and Persuasion.” In The Cambridge Handbook of Compliance, edited by Benjamin van Rooij and D. Daniel Sokol, 404–21. Cambridge Law Handbooks. Cambridge: Cambridge University Press. https://www.cambridge.org/core/books/abs/cambridge-handbook-of-compliance/social-norms-and-persuasion/F3B451556CFC8707C67429AD534F84BC.
Nuijten, Arno, Mark Keil, and Harry Commandeur. 2016. “Collaborative Partner or Opponent: How the Messenger Influences the Deaf Effect in IT Projects.” European Journal of Information Systems 25 (November):534–52. https://doi.org/10.1057/ejis.2016.6.
OECD. 2017. Behavioural Insights and Public Policy: Lessons from Around the World. Paris: Organisation for Economic Co-operation and Development. https:// www.oecd-ilibrary.org/governance/behaviouralinsights-and-public-policy_9789264270480-en.
Papies, Esther K. 2017. “Situating Interventions to Bridge the Intention–Behaviour Gap: A Framework for Recruiting Nonconscious Processes for Behaviour Change.” Social and Personality Psychology Compass 11 (7): e12323. https://compass.onlinelibrary.wiley.com/doi/10.1111/spc3.12323.
Pandey, Anamika, Michael Brauer, Maureen L. Cropper, Kalpana Balakrishnan, Prashant Mathur, Sagnik Dey, Burak Turkgulu, et al. 2021. “Health and Economic Impact of Air Pollution in the States of India: The Global Burden of Disease Study 2019.” The Lancet Planetary Health 5 (1): e25–38. https://www.thelancet.com/journals/lanplh/article/PIIS2542-5196(20)30298-9/fulltext.
Peat, Daniel, Veronika Fikfak, and Eva van der Zee. 2021. “Behavioural Compliance Theory.” SSRN Scholarly Paper. Rochester, NY. https://papers.ssrn.com/sol3/papers.cfm?abstract_id=3962062.
Primus Partners. 2023. “Pink Collar Skilling Unleashing the Women Power in Real Estate Sector.” https:// www.primuspartners.in/docs/documents/Pink%20 collar%20Thought%20Leadership%205%20Jan.pdf
Puaschunder, Julia M. 2017. “Nudgitize Me! A behavioural Finance Approach to Minimize Losses and Maximize Profits from Heuristics and Biases.” SSRN Scholarly Paper. Rochester, NY. https://papers.ssrn.com/sol3/papers.cfm?abstract_id=2930824.
Rajan, S Irudaya, and R B Bhagat. 2021. “Internal Migration in India: Integrating Migration with Development and Urbanization Policies.” https://www.worldbank.org/en/topic/migration/brief/remittances-knomad.
RICS, Knight Frank. 2023. Skilled employment in the Construction Sector in India. https://www.knightfrank.com/publications/skilled-employment-in-construction-sector-in-india-2023-10450.aspx
Saddawi-Konefka, Daniel, Daniel Schumacher, Keith Baker, Jonathan Charnin, and Peter Gollwitzer. 2016. “Changing Physician behaviour With Implementation Intentions: Closing the Gap Between Intentions and Actions.” Academic Medicine : Journal of the Association of American Medical Colleges 91 (March). https://journals.lww.com/academicmedicine/abstract/2016/09000/changing_physician_behavior_with_implementation.16.aspx.
Senge, Peter. 1990. The Fifth Discipline: The Art and Practice of the Learning Organization. 1st ed. New York: Doubleday. Sheeran, Paschal, and Thomas L. Webb. 2016. “The Intention–behaviour Gap.” Social and Personality Psychology Compass 10 (9): 503–18.
Srivastava, Ravi, and Rajib Sutradhar. 2016. “Labour Migration to the Construction Sector in India and Its Impact on Rural Poverty.” Indian Journal of Human Development 10 (1): 27–48.
Stein, Jana von. 2012. “The Engines of Compliance.” In Interdisciplinary Perspectives on International Law and International Relations: The State of the Art, edited by Jeffrey L. Dunoff and Mark A. Pollack, 477–501. Cambridge: Cambridge University Press. https://www.cambridge.org/core/books/abs/interdisciplinary-perspectives-on-international-law-and-international-relations/engines-of-compliance/F7E9D9C83B8648E8552CDD52FF02476A.
Sunding, Lars, and Anders Ekholm. 2015. “Applying Social Sciences to Inspire Behavioural Change in the Construction Sector: An Experimental Study.” Construction Management and Economics 33 (9): 695–710. https://www.tandfonline.com/doi/full/10.1080/01446193.2015.1090619.
TERI, ARAI. 2018. ”Source Apportionment of PM2.5 & PM10 of Delhi NCR for Identification of Major Sources.” https://www.teriin.org/sites/default/files/2018-08/ Report_SA_AQM-Delhi-NCR_0.pdf
Tjoe Nij, Evelyn, Simone Hilhorst, Ton Spee, Judith Spierings, Friso Steffens, M.E.G.L. Lumens, and Dick Heederik. 2003. “Dust Control Measures in the Construction Industry.” The Annals of Occupational Hygiene 47 (April):211–18. https://www.teriin.org/sites/default/files/2018-08/Report_SA_AQM-Delhi-NCR_0.pdf.
Tjoe Nij, Evelyn, Simone Hilhorst, Ton Spee, Judith Spierings, Friso Steffens, M.E.G.L. Lumens, and Dick Heederik. 2003. “Dust Control Measures in the Construction Industry.” The Annals of Occupational Hygiene 47 (April):211–18. https://academic.oup.com/annweh/article-abstract/47/3/211/171401?redirectedFrom=fulltext
Van Houten, Ron, Louis Malenfant, Brad Huitema, and Richard Blomberg. 2013. “Effects of HighVisibility Enforcement on Driver Compliance with Pedestrian Yield Right-of-Way Laws.” Transportation Research Record 2393 (1): 41–49. https://journals.sagepub.com/doi/10.3141/2393-05.
Vert C, Sánchez-Benavides G, Martínez D, et al.. Effect of long-term exposure to air pollution on anxiety and depression in adults: a cross-sectional study. Int J Hyg Environ Health. 2017. August;220(6):1074-1080. doi: 10.1016/j.ijheh.2017.06.009
Wang, Jiuzhu, Cuifeng Du, Zheng Chen, and Yuan Wang. 2023. “Influence of Vehicle and Pavement Characteristics on Dust Resuspension from Soil Pavement of Open-Pit Mine.” Science of The Total Environment 878 (June):163252. https://www.sciencedirect.com/science/article/abs/pii/S0048969723018715?via%3Dihub.
Wang, Mingpu, Gang Yao, Yujia Sun, Yang Yang, and Rui Deng. 2023. “Exposure to Construction Dust and Health Impacts – A Review.” Chemosphere 311 (January):136990. https://www.sciencedirect.com/science/article/abs/pii/S004565352203483X?via%3Dihub.
West, Robert, and Susan Michie. 2020. “A Brief Introduction to the COM-B Model of Behaviour and the PRIME Theory of Motivation.” Qeios, April. https://www.qeios.com/read/WW04E6.2.
Wu, Zezhou, Xiaoling Zhang, and Min Wu. 2016. “Mitigating Construction Dust Pollution: State of the Art and the Way Forward.” Journal of Cleaner Production, Preventing Smog Crises, 112 (January):1658–66. https://www.sciencedirect.com/science/article/abs/pii/S0959652615000190?via%3Dihub.
Zahed, Karim, and Mustafa Demir. 2023. “Nudging to Manage the Spread of COVID-19: Lessons Learned for the Next Pandemic.” Proceedings of the Human Factors and Ergonomics Society Annual Meeting 67 (1): 2359– 65. https://journals.sagepub.com/doi/10.1177/21695067231192244.
Zaneva, Mirela, and Tsvetomira Dumbalska. 2020. “Green Nudges: Applying Behavioural Economics to the Fight against Climate Change.” PsyPag Quarterly 1 (116): 27–31. https://explore.bps.org.uk/content/bpspag/1/116/27.
Zuo, Jian, Raufdeen Rameezdeen, Matthew Hagger, Zhihua Zhou, and Zhikun Ding. 2017. “Dust Pollution Control on Construction Sites: Awareness and SelfResponsibility of Managers.” Journal of Cleaner Production 166 (November):312–20. https://www.sciencedirect.com/science/article/abs/pii/S0959652617317420?via%3Dihub.
India's construction market is growing significantly, and this growth leads to high fugitive dust levels, particularly in urban areas. Construction and demolition (C&D) activities contribute around ~4 per cent of the annual Particulate Matter (PM10) concentration in the National Capital Region (NCR). Prolonged exposure to PM puts people, especially construction workers, at risk of developing short and long-term health impacts. Severe air pollution episodes have led to temporary bans on construction activities, causing project delays and impacting incomes and livelihoods.
The study identified that road dust resuspension caused by speeding vehicles is one of the primary sources of PM on construction sites. Research indicates that vehicle movement on unpaved roads can contribute nearly 50 per cent of PM10 emissions. At the pilot site, only about 16 per cent of Heavy-duty vehicle (HDV) drivers complied with the 10 kph speed limit despite regulations. This low compliance resulted in average PM10 concentration of 749±1013µg/m³, approximately 12 times the permissible limit, with increasing PM concentrations observed at higher speeds. Targeting vehicular speeding aimed to address the most pollutant-intensive activity identified at the site.
The study leveraged behavioural science approaches. It used the 5-steo TESTS approach, using the COM-B Model to identify barriers to speed compliance among drivers and security guards. Solutions were then designed using the Behaviour Change Wheel (BCW), incorporating functions like Education, Training, Persuasion, Enablement, Environmental Restructuring, and Restrictions. Specific techniques included tailored training on dust mitigation practices for guards and site staff, encouraging micro-interactions at entry points where guards verbally reminded drivers, environmental restructuring like changing where drivers stopped and relocating wheel washing, placing clearer signage, and using voluntary commitment forms for drivers.
During the intervention phase, compliance with the speed limit increased significantly, from ~16 per cent to ~63 per cent. This increased speed compliance led to a reduction in average PM concentrations measured along the approach road. PM10 concentrations reduced by approximately ~11 per cent, and PM2.5 concentrations decreased by about ~29 per cent compared to the pre-intervention phase. The study assessed meteorological factors and found they did not substantially impact this change, indicating the PM reduction could be attributed to the behavioural intervention.
Current regulatory approaches often rely on reactive, punitive measures and collective accountability, neglecting the psychological and contextual drivers of non-compliance among frontline actors. Policies frequently prioritise "what" must be done but ignore the "how" and "why". Behavioural science offers an opportunity to align action plans with on-the-ground realities by diagnosing barriers and designing effective interventions. As demonstrated in the pilot, mitigating air pollution is more effective with practical, "doable," low-effort solutions rather than relying solely on punitive measures. Prioritising behavioural science principles can help scale actionable dust mitigation.
Organic Waste Circular Economy for Viksit Bharat
How Can India Tackle Air Pollution with an Airshed-level Approach?
Roadmap of the methodology to assess the climate co-benefits of the SUP ban in Tamil Nadu
Roadmap of the methodology to assess the climate co-benefits of the SUP ban in Maharashtra
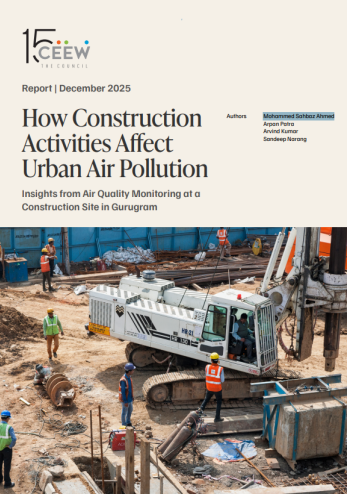
How Construction Activities Affect Urban Air Pollution: