Council on Energy, Environment and Water Integrated | International | Independent
Suggested citation: Vaid, Shubhi, Neerav Sharma, and Seshadri Raghavan. Can Indian Highways Support ZeroEmission Trucking? Assessment of Charging Infrastructure on Delhi-Agra Highway (NH44). New Delhi: Council on Energy, Environment and Water, 2025.
India's road transport sector drives economic growth, contributing ~6-7% of GDP and nearly 80% of transport Gross value added. Medium and heavy-duty trucks (MHDTs) form the backbone of goods movement in the country. Despite their limited share in the vehicle stock, they account for a disproportionate share of fuel consumption, greenhouse gas emissions (GHG) and logistics inefficiencies. Transitioning to zero-emission trucks (ZETs) can lower costs, reduce GHG emissions, and improve air quality, yet the adoption is hindered by infrastructure gaps, technology limitations and operators' perceptions.
This study examines the Delhi-Agra highway (NH44), a key freight corridor, to identify opportunities and challenges for ZET deployment through the lens of electric vehicle charging infrastructure (EVCI). Drawing on driver and logistics service provider (LSPs) surveys, spatial analysis and scenario modelling, it develops a framework for siting, sizing and suitability assessment for charging infrastructure along the highway corridor. The findings recommend investment strategies and outline near-to-long-term policy interventions for ministries and government agencies to accelerate India’s transition to sustainable and efficient freight transport.
Two deployment strategies emerge:
⮚ Anchor nodes (hubs) provide concentrated, high-capacity charging with greater GHG abatement potential but require higher capital expenditure and grid upgrades.
⮚ Distributed networks offer wider accessibility and flexibility, though with a higher risk of underutilisation and fragmented demand.
Electrifying 30% of truck trips on NH44 would require ~369 MWh of daily charging demand, concentrated on Karman-Mahuvan and Gadpuri- Karman stretches.
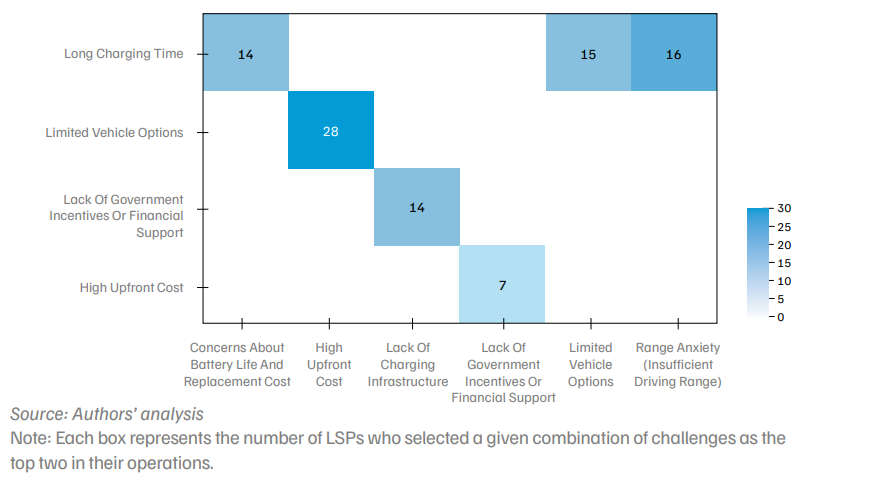
Nearly three-fourths of Logistics service providers (LSPs) surveyed are uncertain or opposed to ZET adoption, citing high costs, limited battery range, and lack of suitability models. Preferred features include longer ranges, battery swappable options, and asset- light ownership models.
Tactical measures can accelerate ZET uptake. fleet modernisation, targeted pilot projects on predictable high utilisation routes, and upgrading existing charging assets can reduce barriers. Leveraging current schemes such as PM-e-DRIVE through public-private partnerships can further strengthen corridor-level deployment.
Medium and heavy-duty trucks (MHDT) are a vital backbone of the nation’s freight movement and the logistics ecosystem. Even so, the sector is saddled with several economic and environmental challenges under the status quo (GoI 2024b). Despite constituting only 2-3 per cent of the total vehicle stock, MHDTs have an outsized influence on crude oil imports, demand for energy, greenhouse gas (GHG) emissions, and criteria pollutants (Abhyankar 2022; Apte et al. 2017; Guttikunda and Mohan 2014; NITI Aayog 2021). The trucking sector is under operational and structural stress. Despite meagre freight rates (INR per tonne-km), the sector struggles with inefficiencies, such as sub-optimal fleet utilisation, nearly one-third empty trips, and long idling and waiting times. This collectively drive up logistics costs as a share of GDP. (Sahu, Pani, and Santos 2022; TCIL 2015; MoCI 2023; NITI Aayog 2021, 2022). Adoption of zero-emission trucks (ZETs)—an idea several countries, including India, are pursuing in their broader ‘net-zero’ quest against emissions— offers a way out of many of these challenges. Potential benefits of ZET include emission abatement and improved air quality, energy security, and fuel-cost reductions, with the transition also expected to act as a catalyst for the broader sector to address systemic inefficiencies. However, the transition stands impeded by economic, technological, and infrastructural factors, besides perception headwinds (Ghate 2023). Research on ZET transition so far has largely focused on its economic-value proposition. This study seeks to investigate the subject from the perspective of highway corridor electric vehicle charging infrastructure (EVCI), with the crucial Delhi-Agra highway as the canvas.
The idea is to present a granular resolved framework for highway EVCI deployment from the perspective of economic and environmental key performance indicators/metrics. The findings will be instrumental in shaping data-driven policy interventions, investment strategies, near-term to long-term policy prioritisation, and implementation road maps that bridge the infrastructure gap and accelerate ZET deployment.
Why Delhi-Agra highway and why an EVCI lens?
The Delhi-Agra highway is a key freight corridor that spans 250 km across multiple logistics hubs, warehouses, and industrial zones, such as Faridabad, Palwal, and Hodal, as well as major areas in the National Capital Region (NCR), Mathura, Vrindavan, and Agra. It is part of the Amritsar-Kolkata Industrial Corridor (AKIC) and the Golden Quadrilateral, linking the east-west and north-south corridors of national highway development plans (India). It has been designated a priority trucking corridor by the Ministry of Heavy Industries (MHI) and a high-traffic corridor by the Ministry of Power (MoP). This corridor carries time-sensitive perishables, high-volume low-value bulk goods, and essential consumption items. Thus, NH44 naturally supports and strengthens the Delhi–Jaipur ‘lighthouse’ corridor, ensuring consistency in truck traffic, both by volume and travel pattern. Even if purchase barriers are addressed through favourable financing and direct subsidies, range anxiety, charging accessibility, and reliability challenges could still deter first movers.
What is the scope of inquiries, and how are they answered?
This report seeks to inform ZET transition by addressing four key objectives:
Figure ES1. High-suitability zone clusters identified near urban and peri-urban nodes
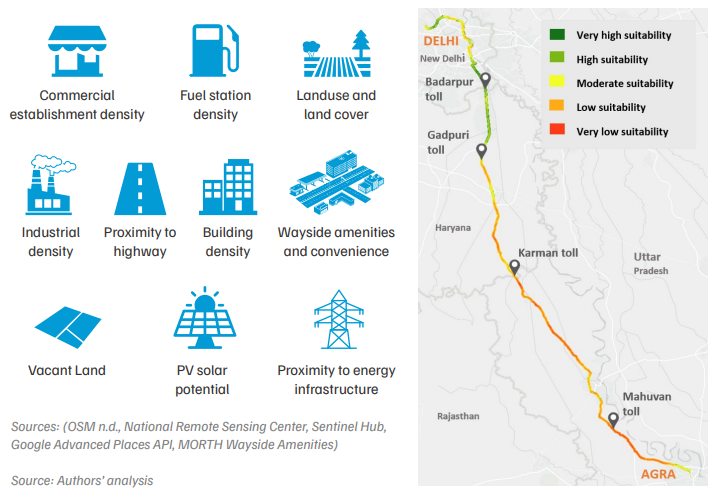
Figure ES2. ‘First 100 ZETs’ carry daily utilities like food grains, dairy product and construction items
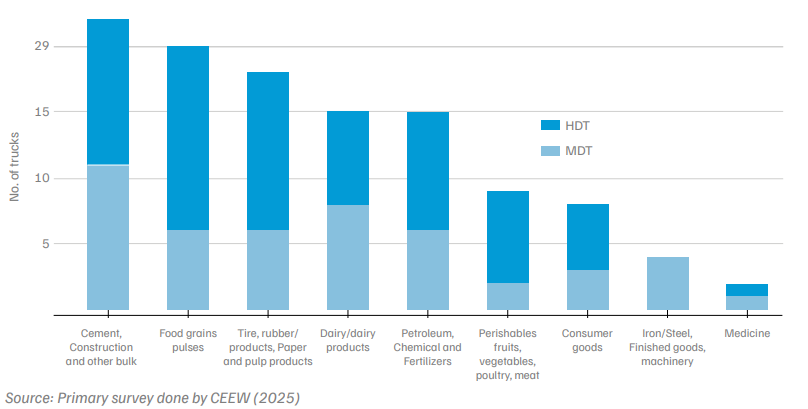
Figure ES3. Potential locations for siting the anchor node and the distributed network
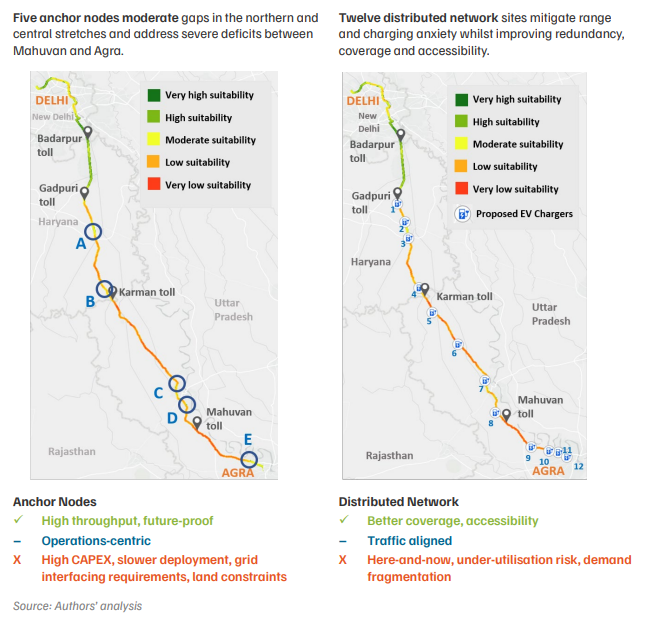
Table ES1. Exemplar node and network site specifications, EVCI sizing, cost
| Attributes | Anchor Node or 'Hub' | Distributed Network or 'Corridor-Wide' |
|---|---|---|
| Installed capacity (site) | 4–6 MVA | 1–1.5 MVA |
| Charger rating | 240–350 kW | 350–500 kW |
| Average corridor spacing | 40–50 km | 10–20 km |
| Land required (average) | 1600–2100 m² (1850 m²) | 200–450 m² (325 m²) |
| Total | ||
| Sites | 5 | 12 |
| Total number of chargers | 50–75 | 36–50 |
| CAPEX, INR lakhs | 6634–7759 | 5596–7216 |
| \*PV+BESS, INR lakhs | 530–900 | 140–230 |
Source: Authors’ analysis
Notes: Assumptions: Local reinforcement refers to upgrading the low-voltage distribution system (LVDS) to a high-voltage distribution system (HVDS). The primary substation is 33/11 kV. Detailed methodology, parametric assumptions, and cost benchmarks are provided in the Annexure.
Only CAPEX is considered.
Due to variability in land prices and the unavailability of parcel-wise acquisition costs, only the area is indicated.
Acronyms: PV+BESS: Solar photovoltaics plus battery energy storage system.
Figure ES4. Major barriers to ZET adoption stated by Logistics Service Providers (LSPs)
Given the nascent nature of the ZET market, pragmatic, contextual and high-impact interventions are vital. To that end, the following actions are recommended:
India’s road transport sector is a critical driver of economic growth, accounting for ~6–7 per cent of Gross Domestic Product (GDP) (NITI Aayog 2021) and ~80 per cent of the total Gross Value Added (GVA) of all transport services (GoI 2024b). There are multidimensional inefficiencies that span across economic, environmental and operational domains.
Economic, environmental, and public-health ramifications of the status quo: The carbon footprint of India’s transport sector has grown rapidly, with emissions projected to rise from 360 MTCO₂e (metric tonnes of CO₂ equivalent) in 2022 to 1,000 MTCO₂e by 2050—a near tripling within three decades (NITI Aayog 2024b). Road transport is the dominant player on this count, accounting for 90 per cent of all transport-related energy consumption and emissions, with crude oil consumption at its core (NITI Aayog 2024a). The demand for crude oil doubled between 2006 and 2023 (NITI Aayog 2024a), while the cost of imports increased sevenfold, reaching ~$100 billion in 2019-2020 (CII 2020). This heavy reliance on oil imports has exposed the economy to volatile global fuel prices, and significantly strained India’s trade balance. Beyond its climate and energy implications, India’s transport sector is a significant source of urban air pollution, responsible for 20–40 per cent of particulate matter (PM) emissions (Purohit and Klimont 2023; IEA 2023; WRI 2021), producing 2–3 MT of nitrogen oxides (NOx ) and 0.1–0.25 MT of PM annually (N. Singh, Mishra, and Banerjee 2021). The health consequences are severe: Indians lose 5 years of life expectancy on average due to pollution, and, in 2019 alone, 1.67 million premature deaths were attributed to air-pollutionrelated illnesses (WRI 2024). The economic cost is staggering — according to the World Bank, premature deaths and morbidity from air pollution resulted in financial losses to the tune of $36.8 billion (~1.4 per cent of India’s GDP) in 2019 (World Bank Group 2024).
Multidimensional inefficiencies plague the trucking sector: The compounding effect of rapid urbanisation and economic growth will manifest in an increase in demand for goods and services. By 2047, per-capita and freight-transport demand are projected to grow three or four times from their current levels of 2,500 tonne-km and 3 trillion tonne-km, respectively (NITI Aayog 2024b). India’s logistics sector is a USD 200 billion industry dominated by road freight, which makes up ~two-thirds of total goods transported annually (4.6 billion tonnes) (Rajan and Krishnan 2024; NITI Aayog 2022). The diesel-dominant 4–5 million-strong fleet of medium and heavy commercial/goods vehicles or trucks (MHCV/MHGV/MHDT) represent only 2-3 per cent of the total vehicle stock but have an outsized influence on end-use energy demand (over 80 per cent), ~70 per cent of GHG and PM emissions, over 50 per cent of NOx emissions, and 12–15 per cent of all road accidents and fatalities (Abhyankar 2022; Apte et al. 2017; Guttikunda and Mohan 2014; NITI Aayog 2021). A few salient aspects of India’s trucking sector are worth noting. First, it is characterised by a high degree of disaggregation and fragmented ownership, with ~30 million small fleet operators with 1-5 trucks constituting ~80 per cent of the sector (OECD-ITF 2024). Second, logistics costs represent a higher share of India’s GDP — 13-15 per cent, compared to the global trend of 8-11 per cent — with lastmile delivery challenges solely responsible for 40 per cent of the overall logistics costs (Aritua 2018; Sahu, Pani, and Santos 2022; Rajan and Krishnan 2024). Third, intrinsic, operational and structural inefficiencies also include poor road infrastructure, congestion, low average speeds, long waiting times, sub-optimal utilisation, higher instances of overloading and empty runs, ageing fleet, low fuel economy, and low freight rate per tonne-km (Sahu, Pani, and Santos 2022; TCIL 2015; MoCI 2023; NITI Aayog 2021, 2022).
Consolidated supply, economic hotspots and freight-activity funnelling on select corridors: Three to five original equipment manufacturers (OEMs) control about ~80-90 per cent of the commercial-vehicle market. The MHDT segment can be categorised by one or more of these attributes: tonnage (gross vehicle weight-GVW); body type - rigid (tipper or haulage) or tractor-trailer haulage; number of axles - 2, 3 or 4-6; and, optionally, by application or commodity transported, e.g. aggregates, parcel, consumer goods, perishables or tankers (CALSTART 2022; Qamar S and Jamal F 2021). The categorisation of MHDTs under the Ministry of Road Transport and Highways’ regulatory framework (CoEZET. 2024; CSIR-
Table 1. MHDT categorisation by GVW (tonnage): MoRTH vs OEM
| MoRTH* | OEM | |||
|---|---|---|---|---|
| GVW (Tonnes) | Category | GVW (Tonnes) | Category | |
| 3.5 < GVW ≤ 7.5 | N2 / N2A | MDT | 3.5 < GVW ≤ 8 | Light DT |
| 7.5 < GVW ≤ 12 | N2 / N2B | MDT | 8 < GVW ≤ 16.2 | Intermediate DT |
| 12 < GVW ≤ 18.5 | N3A (2 Axle Rigid) | HDT | ||
| 18.5 < GVW ≤ 28 | N3B (Multi Axle Rigid) | HDT | 16.2 < GVW ≤ 28 | MDT |
| 28 < GVW ≤ 49 | N3C (Multi Axle Rigid) | HDT | 28 < GVW ≤ 49 | HDT |
| 30 < GCW ≤ 55 | N3D (Tractor-Tractor) | HDT TT | 30 < GCW ≤ 55 | HDT TT |
Source: (CALSTART 2022; MoRTH 2018)
CRRI. 2018) varies slightly from that of OEMs (D2Z. 2023), as shown in Table 1. Rigid configuration – MDT and HDT collectively make up the largest share (~85 per cent) of all MHDT sales. HDTs occupy a slightly larger market share (up to 5 per cent more) relative to MDTs (Qamar S and Jamal F 2021; GoI 2023). More than 50 per cent of road freight traffic (in tonne-km) travels along seven corridors connecting significant industrial, manufacturing, and growth centres, while 100–300 km short-to-mediumdistance connectors on the national highway network handle ~10 per cent (MoRTH n.d.; GoI 2023, 2024c).
Strategic responses for tackling systemic and structural challenges: The Government of India (GoI) has launched ambitious schemes and targets to improve freight efficiency, reduce logistics costs to 5 per cent of GDP, and decarbonise the trucking sector. Most notable of these include the Logistics Efficiency Enhancement Programme (LEEP) (MoRTH n.d.), the development of 35 multi-modal logistics parks (MMLPs) for seamless intermodal connectivity (MoRTH 2022b), the PM Gati Shakti National Master Plan (NMP) (MoRTH 2022a), and 35,000-km highway expansion to ease congestion, improve last-mile connectivity, and increase crossborder trade under the Bharatmala Pariyojana initiative (MoRTH 2017). The LEEP aims to optimise freight flows across highways, rail, ports, and inland waterways by integrating existing and planned logistics infrastructure, and synergising with MMLP development by enhancing intermodal connectivity and minimising transhipment losses. While these would undoubtedly compound and yield long-run benefits at scale in the years to come, incremental policy prescriptions —through fuel-efficiency norms, emissions standards and internal combustion engine (ICE) technology improvements— though beneficial, are neither stringent nor sufficient if India has to reduce its emission intensity per unit of GDP by 45 per cent relative to 2005 levels, and achieve net zero by 2070 (IEA 2023; UNFCCC 2022).
Largest abatement potential from ZET transition: The Government of India has embarked on an ambitious mission to decarbonise road transport by accelerating the transition to electric vehicles (EVs) through initiatives such as FAME (Faster Adoption and Manufacturing of Hybrid & Electric Vehicles in India), PLI (production-linked incentives), and ACC (Advanced Chemistry Cell) (MHI 2023; IBEF 2024). There are currently roughly 5.8 million EVs in India, of which two-wheelers (e2W) and three-wheelers (e3W) account for ~94 per cent. Only ~13,120 electric light, medium and heavy commercial vehicles (CVs) are registered as of 2024 – 12,500 light CVs, 600 MCVs, and 10 HCVs (NITI Aayog 2024a). In the most recently announced outlay of INR 11,000 crore under PM-EDRIVE (MHI 2023), INR 780 crore has been earmarked as capital grant for capacity, capability and technology upgradation of testing agencies. The outlay includes INR 500 crore to incentivise scrapping of ICE trucks at registered facilities, and INR 2,000 crore as capital grant for the development of charging infrastructure.
The e-FAST (Electric Freight Accelerator for Sustainable Transport) India platform is a vital ZET transition catalyst. The initiative, spearheaded by NITI Aayog, serves as a key enabler in accelerating ZET deployment by harnessing industry collaboration, fostering public-private partnership, identifying policy roadblocks, and developing scalable EV charging (and refuelling) infrastructure (e-FAST 2024). By integrating ZET transition strategies with the evolving logistics landscape, eFAST aims to drive large-scale adoption of zero-emission freight transport through multi-stakeholder coordination. Such a systems approach and forward-looking strategy ensures that ZET adoption aligns with India’s broader freight reforms and logistics-sector modernisation efforts under LEED, MMLP, and Bharatmala.
Technology, infrastructure, and economic and perception headwinds impede ZET transition: ZET adoption is still in its nascency, with very limited model offerings and financing mechanisms (Ghate 2023). Uncertainty surrounding utilisation, payload, residual value, holding period, and day-to-day impact on operations is an impediment to accessing longterm financing options. Higher purchase costs and interest rates further aggravate financing barriers, as small fleet operators with low risk tolerance and limited cash reserves represent a significant share of the trucking segment (CoEZET 2024). Market perception, general EV technology awareness, and industry inertia pose further challenges — many fleet operators remain sceptical about the reliability, maintenance costs, and long-term viability of ZETs compared to conventional ICE variants. Even with declining battery costs, there are still tradeoffs between payload, battery size, range anxiety, total cost of ownership (TCO, INR/km), and breakeven distance for TCO parity with ICE equivalents. These trade-offs highlight the technology barriers and value proposition challenges for EV adoption.
Charger capacity and coverage, and allied upstream power-grid infrastructure are insufficient to support ZET first-movers. Charging infrastructure development has largely remained urban-centric due to the nature of vehicle segments driving the EV transition, namely, two- and three-wheelers: This geographic inequity, and low EVCI availability and accessibility in rural and non-urban areas along highways creates a negative feedback loop, strengthening the perception barrier. Furthermore, ZETs could be equipped with larger batteries, from 75 kWh to 500 kWh (GoI 2023, 2024c), depending on the segment, daily driving distance, and use-case (short-haul, regional, long-haul, etc). They require EVCI with fast-charging capacity — 180–240 kW CCS-II charger — to minimise downtime. Most current fast chargers are rated 60 kW CCS-II, and are suitable for the four-wheeler (cars, vans) and LCV segments. Under the PM e-DRIVE initiative, while INR 2,000 crore is earmarked to support 72,300 EVCI, only INR 346 crore is allocated to incentivise the development of 1,800 high-capacity CCS-II (240 kW) EVCI across 22,000 km and 60 priority corridors along the NH based on bus and truck traffic (MHI 2024). Costs associated with upgrading and/ or developing new grid infrastructure to support high-power EVCI alone could delay the TCO payback period with ICE trucks by 5–10 years (OECD-ITF 2024). This underscores the importance of timing policy interventions with investment decisions as a decisive first step in shaping the ZET adoption trajectory.
Highway corridor electrification as a solution vector for overcoming range and charging anxiety, generating a secondary revenue stream, and promoting local development: Developing robust, reliable and publicly accessible high-power EVCI along high-traffic-density corridors will help overcome ZET perception barriers through visibility. Partnerships and equity with real-estate developers, highway asset developers, concessionaires, oil marketing companies (OMCs) and their retail outlets (ROs) will stimulate regional commerce and improve their financial viability. As ZET adoption increases, integrating variable renewable energy (VRE) and battery energy storage systems (BESS) with the EVCI will provide additional environmental and economic benefits, and boost resiliency. These benefits include grid greening, smart charging, and asset utilisation/monetisation. Over time, the growing evidence of these benefits will help demonstrate their value and effectiveness in supporting ZET transition and strengthening energy infrastructure.
Despite the policy commitments on the side-lines of the G20 Clean Energy Ministerial (CEM) in 2023, and expression of demand for 7,750 ZETs by 2030 (NITI Aayog 2023b), the absence of robust, high-power EV charging infrastructure along highways poses significant hurdles to ZET adoption. This study directly addresses this knowledge, and the aforementioned analytical insights and policy gap, by conducting a quantitative assessment of EVCI sizing, siting, and suitability on the Delhi-Agra highway (NH44)—a priority freight corridor. The study draws on surveys, publicly available traffic reports, and sample toll transaction data, and fuses primary data with multi-layer geospatial intelligence, synthesising nearly a dozen builtenvironment parameters to guide infrastructure deployment. Included are points of interest like fuel stations, truck stops, toll plazas, commercial hubs, satellite-based remote sensing data on land use and land cover (LULC), and solar irradiation potential. By integrating these datasets, the study presents a granular resolved framework for highway EVCI deployment from the perspective of economic and environmental key performance indicators/metrics. The findings will be instrumental in shaping data-driven policy interventions, investment strategies, near-term to long-term policy prioritisation, and implementation roadmaps that bridge the infrastructure gap and accelerate ZET deployment.
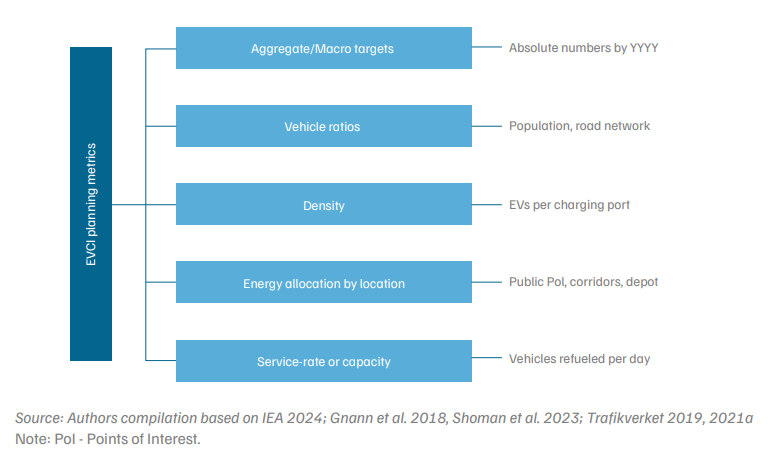
Figure 1. Policy metrics that guide infrastructure roll-out and evaluate progress
As EV adoption accelerates worldwide, developing strategic and well-planned EVCI becomes a critical focus for policymakers. Ensuring equitable access to charging stations, minimising range anxiety, and optimising energy distribution are key challenges that must be addressed. Multiple nations and studies have highlighted the guidelines and deployment methods of charging infrastructure. Some of the studies are discussed in this section.
Contemporary studies highlight different metrics that guide the deployment of charging infrastructure (Raghavan 2024). Figure 1 depicts the most prominently adopted metrics, which include:
Table 2. Snapshot of global Electric Vehicle Charging Infrastructure (EVCI) roll-out targets and provisions in major EV markets as of April 2024
| Country/Region | Targets and provisions |
|---|---|
| EU AFIR (EU 2022; EC 2023) | At least 150 kW every 60 km along the TEN-T network for light-duty vehicles (LDVs); 1.3 kW per BEV At least 350 kW every 60 km along the TEN-T for heavy-duty vehicles (HDVs) and every 100 km along the TEN-T comprehensive; HRS in all urban nodes and every 200 km along the TEN-T |
| France (Government 2023) | 400,000 PCs, including 50,000 DC chargers, by 2030 |
| Germany (T&E 2021; BMDV 2022) | 1 million PCPs by 2030 |
| US NEVI (US DOT 2021) | ~75,000 miles of EV charging corridors |
| India (MoP 2022; BEE 2023, 2024) | 7,500 PCs rated 50 kW or above by March 2024; one 100 kW in a $3 \times 3 \text{ km}$ grid and one EVCI every 25 km on both sides of the highway |
| Japan (Bloomberg 2023; NEDO 2021) | 300,000 PCs by 2030 |
Source: EU 2022, EC 2023; Government 2023; (T&E 2021, BMDV 2022; US DOT 2021; MoP 2022, BEE 2023, 2024;
Bloomberg 2023, NEDO 2021
Note: PCS/P: public charging stations/points or ports; HRS: hydrogen refuelling station; TEN-T: Trans-European transport network. Targets and provisions summarised in this table are non-exhaustive.
Globally, advanced EV markets have adopted different policy frameworks to accelerate EV infrastructure deployment, with the United States and the European Union serving as key case studies. The US National Electric Vehicle Infrastructure (NEVI) programme follows a corridorbased approach, ensuring fast chargers are placed every 50 miles along major highways, particularly focusing on enabling long-distance travel and freight movement (Stenstadvolden 2024). Meanwhile, the EU Alternative Fuels Infrastructure Regulation (AFIR) enforces a mandate-driven, command-and-control approach, requiring charging stations at least every 60 km along the Trans-European Transport Network (TEN-T), along with interoperability and standardisation measures. These global strategies offer valuable insights for India, where a hybrid approach balancing corridor-based development with regulatory mandates could accelerate EVCI deployment, ensuring efficient, scalable, and sustainable electrification of national highways and urban networks.
The National Electric Vehicle Infrastructure (NEVI) programme, launched under the Bipartisan Infrastructure Law (BIL), is a cornerstone of the US government’s strategy to accelerate EV adoption. The programme follows a corridor-style planning approach, with a target of deploying charging infrastructure across 50,000 miles (graphic says 75,000 miles) of designated corridors, to ensure EV drivers have access to reliable charging stations along major highways and intercity routes. A key feature of NEVI is its minimum coverage requirement, which mandates that fast-charging stations be installed every 50 miles (80 km) along designated alternative fuel corridors (AFCs) and within one mile (1.6 km) of highway exits (J. Chu, Gilmore, B., Hassol, J., Jenn, A., Lommele, S., Myers, L., ... & Shah, M. 2023). These stations must offer at least four DC fast chargers (minimum 150 kW each) to support high-speed charging for passenger vehicles and commercial fleets. The approach prioritises range confidence and seamless travel, addressing one of the biggest barriers to long-distance EV adoption.
Funding under NEVI is structured to incentivise state governments, private players, and utilities to invest in EVCI. States are required to submit detailed EV infrastructure deployment plans, ensuring that charging networks align with expected EV growth. Additionally, NEVI promote public-private partnerships (PPPs) to encourage sustainable business models, aiming to reduce dependence on government subsidies over time. The programme also aims to integrate renewable energy sources and grid-resilience measures, enhancing the system-wide sustainability (US DOT 2021).
The European Union (EU) Alternative Fuels Infrastructure Regulation (AFIR) represents a regulatory-driven approach to EV infrastructure development (EC 2023). The EU’s approach is mandate-driven, seeking to ensure that all member states comply with standardised charging infrastructure targets. AFIR sets legally binding requirements, making it a commandand-control policy framework to create a seamless and interoperable EV charging network across Europe. AFIR mandates that public charging stations be available at least every 60 km (37 miles) along the Trans-European Transport Network (TEN-T) corridors. This ensures that passenger and freight EVs can travel without range concerns. It also requires that fast chargers (minimum 150 kW) be installed for light-duty vehicles, and 350-kW chargers for heavy-duty trucks. Unlike voluntary or market-driven initiatives, this regulation compels governments and businesses to meet infrastructure deployment targets, backed by stringent reporting and compliance mechanisms (EC 2023).
A critical component of AFIR is interoperability and payment standardisation. The policy mandates that charging networks across EU member states be harmonised, allowing users to access any public charging station without needing multiple subscriptions or proprietary payment systems. This is achieved through universal charging protocols and transparent pricing mechanisms, reducing friction for EV users. Additionally, AFIR integrates hydrogen refuelling infrastructure alongside EV chargers, recognising the role of multiple alternative fuels in decarbonising transport. The regulation ensures that the entire mobility ecosystem, including long-haul freight, public transit, and private vehicles, can transition seamlessly to cleaner energy sources.
Ministry of Power (MoP) Guidelines on Charging Infrastructure comprise comprehensive standards for EV charging infrastructure deployment (MoP 2022), to ensure uniformity, accessibility, and ease of implementation. Key provisions include:
Studies on the electrification of heavy-duty vehicles in the US (Borlaug 2022, NACFE 2019) and the EU (Gnann et al. 2018, Shoman et al. 2023, Speth and Plötz 2024) indicate that depots will play a similar role as home charging for passenger cars. Overnight depot chargers rated up to 50 kW are expected to be the major charging location, fulfilling 60–80 per cent of the charging requirements. High-power chargers (HPC) up to 150 kW and ultra-fast chargers (UFC) rated up to 350 kW are estimated to meet 15–30 per cent and 5–10 per cent of the total charging demand, respectively (Trafikverket 2021b; Mathieu et al. 2020; Noordjik, Refa, and Rookhuijzen 2020). Studies suggest a 1:1 ratio of Battery electric trucks (BETs) to overnight depot chargers (50 kW), 1–4 high power chargers (HPC up to 150 kW), and 10 ultra-fast chargers (UFC up to 350 kW) for heavy-duty (HD) truck fleets (Noordjik, Refa, and Rookhuijzen 2020; Ricardo 2020; Speth and Plötz 2024)
Both NEVI and AFIR offer valuable lessons forIndia’s EV infrastructure planning. While NEVI’s corridor-style approach is well-suited to India’s Golden Quadrilateral and major freight routes, AFIR’s mandate-driven structure could provide a policy blueprint for standardising and accelerating EVCI deployment nationwide. Integrating insights from these global models will be key to developing a robust, scalable, and future-proof EV charging network in India. India has introduced several policies and schemes to accelerate the adoption of electric vehicles (EVs) and strengthen the Electric Vehicle Charging Infrastructure (EVCI). Recognising that infrastructure readiness is a key enabler for EV transition, the government has implemented financial incentives, regulatory frameworks, and operational guidelines to drive EV adoption across various vehicle segments. India’s multi-pronged approach to EV adoption and infrastructure development through FAME, PM-EDRIVE, and MoP guidelines demonstrates a strong commitment to decarbonising transport and reducing dependence on fossil fuels. However, ensuring efficient execution, addressing infrastructure bottlenecks, and integrating renewable energy into charging networks whilst considering their financial viability will be key.
Multiple studies have examined factors considered for the siting of EV charging stations. These include economic and environmental parameters, besides those concerning transportation, energy, urbanisation, existing resource utilisation, and driver convenience. The economic factors include capital, maintenance, and operational costs. Environmental parameters include green areas, slopes, surface temperatures, with vulnerability to natural disasters like floods, landslides, and earthquakes also considered. The transportation-related factors include vehicular flow, junctions, parking and transit zones; and energy-related parameters pertain to electricity grids and substations, and the renewable energy potential of existing land parcels. The urbanisation factors include the proximity/availability of rest stops, industrial clusters, commercial zones, fuel stations, and other amenities. Existing resource utilisation means the current utilisation rate of existing chargers. As this dataset is very critical to get due to the nascent age of the industry, we are not considering it for this study. User convenience includes user accessibility, wait time, and comfort during charging halts. Table 3 highlights all the factors considered in contemporary studies.
The most effective spatial analysis methodologies employ multi-criteria decision analysis (MCDA) frameworks that evaluate potential charging locations across numerous dimensions. These approaches typically integrate geographic information systems (GIS) with weighted overlay techniques to generate comprehensive suitability maps. Studies on improving EV charging point placement show that these techniques use ‘boolean mask layers’ to remove unsuitable locations, and weighted suitability factors to pinpoint ideal sites (Mahdy 2022). Advanced geo-statistical frameworks incorporate both exclusionary constraints and positive suitability factors. For instance, a study seeking to develop a ‘walkable factor grid’ analysed 27 distinct input factors, including land use, demographics, and employment centres, to generate hot spot maps that visualised high, moderate, and lowsuitability areas for charging infrastructure (Zhang 2018). For high-power charging along transportation corridors, specialised analysis techniques have been developed that focus on strategic placement to enable long-distance travel. The EV Fast-Charging Corridor Road Map in the US identified corridor gaps by analysing driving distances between charging stations, categorising segments as fully compliant (less than 25 miles to charging), partially compliant (25-50 miles), or non-compliant (more than 50 miles) (Carbon Solutions & Great Plains Institute 2023).
Table 3. Economic factors primary concern in EVCI sizing-and-siting research
| Source | Economic factors | Connectivity to urban areas/infrastructure | Environmental | Transportation/ Traffic flow | Energy | Power reliability | Existing resource utilisation | Driver convenience |
|---|---|---|---|---|---|---|---|---|
| Jianghong Feng 2021 | ✓ | ✓ | ✓ | ✓ | ||||
| Dogus Guler 2020 | ✓ | ✓ | ✓ | |||||
| G M Sani 2023 | ✓ | ✓ | ✓ | ✓ | ✓ | |||
| Arijit Ghosh 2021 | ✓ | ✓ | ✓ | |||||
| Omer Kaya 2022 | ✓ | ✓ | ✓ | ✓ | ✓ | |||
| Mehmet Erbas 2018 | ✓ | ✓ | ✓ | |||||
| Ali Karas, an 2018 | ✓ | ✓ | ✓ | ✓ | ||||
| Deb Sanchari 2019 | ✓ | ✓ | ✓ | |||||
| William Morocho-Chicaiza 2024 | ✓ | ✓ | ✓ | ✓ | ✓ | ✓ |
This study seeks to address four research questions:
The rest of the report is organised as follows: Section 3 describes the data, analytical framework and methodology. Section 4 summarises key findings from fleet-wide operational insights to the comparative assessment of the two EVCI build-out strategies. Section 5 lists near-term priority interventions necessary to enable ZET uptake. Using the insights from this study, Section 7 provides policy recommendations to support long-term ZET transition.
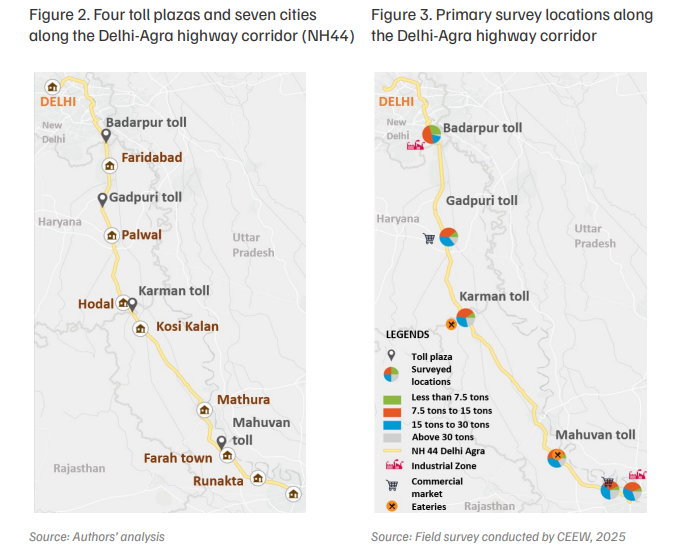
The Delhi-Agra corridor (NH44) is designated by the Ministry of Power (MoP) and Ministry of Heavy Industries (MHI) as one of the priority traffic corridors (truck, car, and bus). This NH corridor spans two major interchanges—Badarpur and Palwal—and five toll plazas, interlinking industrial clusters, logistics parks, and two major tourist hubs in Mathura/ Vrindavan and Agra.
The Delhi-Agra highway is a part of the Golden Quadrilateral segment that connects Delhi and Kolkata. It also provides connectivity to the east-west and north-south corridors of the national highway development plans (India). It spans approximately ~250 km, stretching from the Badarpur elevated toll plaza in Delhi to the NH19 Guru Ka Taal in Agra. This highway traverses three states—Delhi, Haryana and Uttar Pradesh—and passes through several cities and towns, including Faridabad, Palwal, Hodal, Kosi Kalan, Mathura and Agra. There are five toll plazas along the route: the Badarpur elevated toll plaza and Badarpur toll plaza at the Delhi-Haryana border which are very nearby, the Gadpuri toll plaza between Faridabad and Palwal, the Karman toll plaza at the Haryana-Uttar Pradesh border near Hodal and Kosi Kalan, and the Mahuvan toll plaza located between Mathura and Agra in Uttar Pradesh. The highway serves as a critical connection between Delhi and Agra, apart from the Yamuna Expressway. The corridor experiences a diverse mix of traffic, which includes cars, trucks, LCVs, and buses.
Data collection broadly involves two complementary streams: vehicle-specific data (primarily MHDTs) and geospatial aspects of the built environment or physical infrastructure.
Truck- and built-infrastructure-related data were collected through primary surveys, and supplemented with secondary data from diverse sources. Three primary surveys were undertaken: i) Fleet and establishment survey of 100 logistics service providers (LSPs); ii) Vehicles-in-use and inventory survey (VIUS) of approximately 2,800 MHDTs; and iii) 200 km of road network intelligence (RNI). A hybrid purposive and convenience sampling strategy was adopted. Secondary sources for data augmentation and imputation included, but were not limited to, historical monthly toll transaction reports, regional and sub-regional mobility plans, and traffic surveys from research. Likewise, the RNI is supplemented by GIS intelligence acquired via Google Places API and publicly available satellite imagery, OpenStreetMap (OSM), and land-use land-cover (LULC) datasets. Figure A1 in the Annexure details the scope and type of data collection activities.
Vehicles-in-use and inventory survey (VIUS) for trucks : Vehicles-in-use and inventory survey (VIUS) were administered in a computer-assisted personal interview (CAPI) format using a smartphone app at industrial clusters, logistics hubs, fuel stations, and other points-of-interest (PoIs) such as commercial markets, toll plazas, parking stops, and eateries (dhabas), Figure 3. This is an extended version of conventional fuel station surveys that goes beyond vehicle-level information and O-D by gathering freight activity information essential for evaluating ZET suitability/ feasibility and, consequently. EVCI planning. The survey captured the following key constructs: vehicle attributes (such as axles, GVW, fuel type, make/model, mileage, and odometer), commodities transported, trip metrics (trip distance, frequency, and city-highway tonne-km split), refuelling patterns, origin-destination, and toll-related stops and dwell times (Annexure Table A1). Of ~3,200 respondents, 367 were excluded (LCV), resulting in an adequate sample size of 2,826 MHDTs.
Unless otherwise mentioned, a 15-tonne threshold was chosen to bifurcate the sample as MDT (> 7 t and ≤ 15 t, N=1,250) and HDT (> 15 t, N=1,576). This was done to reconcile MHDT categorisation divergence between the regulatory framework and the industry (Table 1) whilst aligning with the most recent ZET technology assessment, conducted on the DelhiJaipur corridor by the office of the Principal Scientific Adviser (PSA) (GoI 2023). This study, when viewed with the PSA’s Delhi-Jaipur study, completes the coverage across the highpriority trucking corridors of the Delhi–Agra–Jaipur triangle. This helps mitigate potential biases in the stated responses; reflects the wider operational realities of the trucking industry, which often don’t adhere strictly to regulatory weight limits; facilitates easier comparison of findings with the Delhi-Jaipur assessment; and increases the practical applicability of findings for EVCI planning and ZET adoption at large.
Fleet and establishment survey of logistics services providers (LSPs): An additional 100 LSPs with a total fleet size of ~2500 commercial vehicles (LCVs and M/HDTs) were surveyed at three major logistics hubs: Apeejay Logistics, IMT Manesar, and Sanjay Gandhi Transport Nagar. Major survey themes included fleet profile, fuel mix, age and GVW; typical operating characteristics, trip metrics, most frequented O-D, typical loading/unloading locations; EV adoption perceptions, type of policy support required, and significant barriers (refer to Annexure Table A4).
As an add-on, data collected from the targeted survey of 100 LSPs was utilised to validate key insights from the VIUS dataset, rationalise technical assumptions regarding ZET and EVCI technology specifications, and strengthen the recommendations emerging from the overall analysis. Rather than replicating the full scope of the VIUS analysis, the themes most pertinent to the study’s objectives are discussed. These include, albeit in a limited manner, the alignment —or lack thereof—between current ZET model offerings and the expectations of LSPs, their perceptions and concerns around EV adoption, prevailing barriers and the role of enabling policies, and the types of vehicles fleet operators are most inclined to electrify. The responses also provide directional insights on the desired technical specifications, such as range, battery size, power, and charging needs, for future ZET models that would make adoption more viable.
Sample representativeness: Aggregate summary statistics and sample breakdown by OEM, GVW, use-case, fuel mix, commodity transported, and driving/dwelling/re-fuelling as well as other pertinent operational aspects are provided in the Annexure. For brevity, through lines speaking to the sample characteristics’ alignment with the sectoral realities alone are discussed. Descriptive and distributional statistics of the VIUS provide a grounded and contextual understanding of India’s trucking ecosystem, as presented earlier in the introductory section, reflecting its structural concentration, dominance of diesel, ageing fleet, fragmented operation, diversity of use-cases, and market composition.
The overwhelming dominance of Tata (1,331/47 per cent), Ashok Leyland (778/28 per cent), and Volvo Eicher (~780/18 per cent) among the sampled vehicles reinforces the entrenched position of these OEMs. Of the trucks sampled (2,826), 90 per cent (2,548) were diesel — HDTs (1,521/1,576) and MDTs (1,027/1,250). The remaining 278 were CNG/LNG variants, of which 223 comprised MDTs and 55 HDTs. Though the survey captured a cross-sectional snapshot of commodity flows within and through the NH44, it nevertheless underscores the trucking sector’s role in supporting consumption and infrastructure-driven growth. Food grains (571/20 per cent), bulk construction materials (463/16 per cent), and industrial inputs (438/15 per cent), like rubber, chemicals, and perishables, make up nearly half of the samples. Breakdown by emission norms indicates the persistence of older-generation trucks—BS-IV (954/34 per cent) and BS-III (824/29 per cent) dominate, accounting for nearly two-thirds of the sample. The presence of pre-BS-III trucks (870/31 per cent) highlights a critical tension between cost constraints, enforcement, and environmental implications—criteria pollutants, GHG emissions, and fuel consumption. Driving and dwelling data show meaningful variation in stop frequency, tolls, and mileage, while tonne-km shares by road type delineate the spatial logic of freight routing— MDTs straddling city-periphery corridors, and HDTs anchoring long-haul highway routes. This data is consistent with the existing body of knowledge on India’s road freight market, industry, and product and ZET transition assessments (GlobalDrivetoZero 2022; GoI 2023; NITI Aayog 2022; OECD-ITF 2024; IEA 2023; TCIL 2015).
Table 4. Fuel stations to rest stops where the road network intelligence survey was conducted
| Category | N |
|---|---|
| Fuel station | 68 |
| Transit stops | 19 |
| Rest stop | 16 |
| Pickup/Drop Bays | 10 |
| Industrial areas | 11 |
| Substations | 2 |
Source: Field survey conducted by CEEW, 2025
Note: Transit stops include bus stops, bus depots, metro stations, and railway stations; pickup/drop bays include mandis and warehouses; rest stops include dhabas, repair shops, hotels, shopping malls, and railway stations.
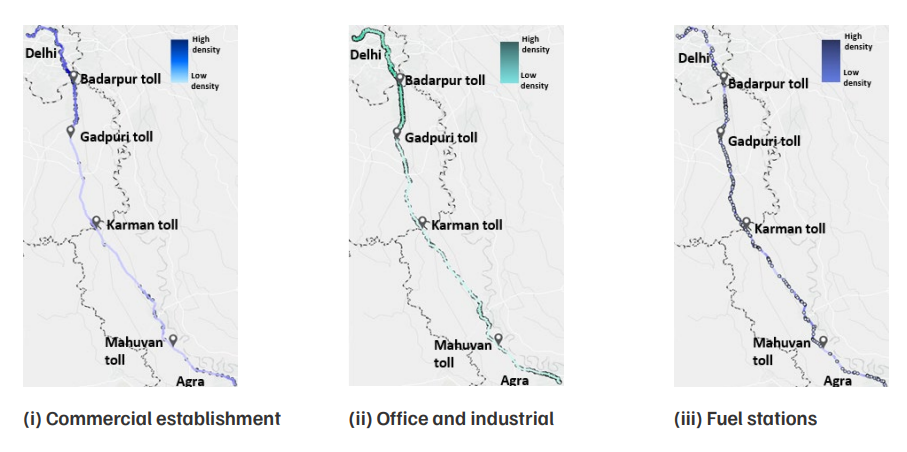
The geospatial intelligence study utilised multi-attribute geospatial modelling and locational intelligence for sizing and siting prospective EVCI installations, considering nearly a dozen attributes across four domains. The four broad domains include proximity to urban infrastructure and density, economic feasibility, energy infrastructure availability and reliability, and traffic flow. User convenience includes user accessibility, wait time, and comfort during charging halts. Based on previous studies, 10 factors were considered to determine infrastructure suitability along the Delhi-Agra highway corridor (Annexure Table A8). Over a 200-km stretch, RNI mapped key establishments—industrial areas, markets, fuel stations, warehouses and rest stops—within a 500-metre buffer on either side of the highway.
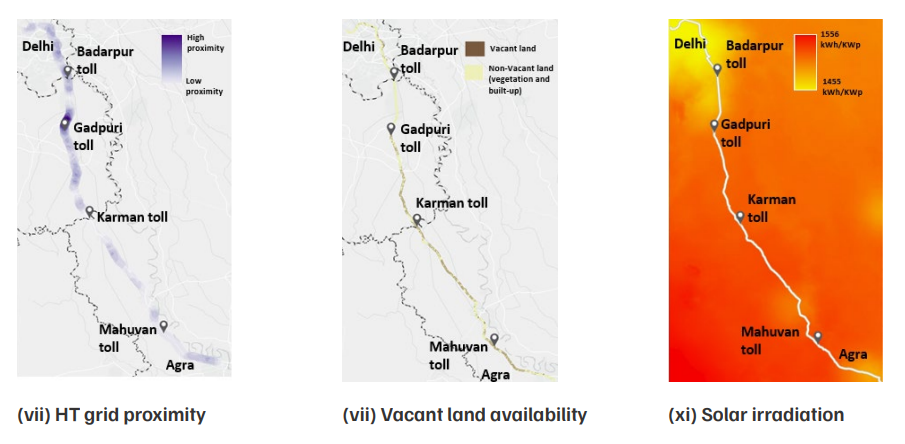
To further refine site selection, the study incorporates land use and land cover (LULC) layer, building density, and vacant land parcels. LULC classification combined with building density captures the urban growth and development along the corridor. Proximity to high-tension (HT) power grids is another key factor, as sites far from the grid require substantial investment in transmission upgrades. Prioritising locations near the HT grid ensures a cost-effective and reliable charging network. Two nearby solar plants—Gautam Buddha Nagar district plant (5 MW, 30 km away from the highway stretch) and Mathura district plant (5 MW, 10 km away from the highway stretch)—offer potential opportunities for integrated renewables.
Table 4 summarises the number of locations geo-tagged by PoI category. Figure 4 depicts the individual GIS layers characterising the built environment, and Figure 5 shows the utility interconnection accessibility and availability along the corridor.
Figure 4. Ten factors considered for infrastructure suitability assessment for EVCI
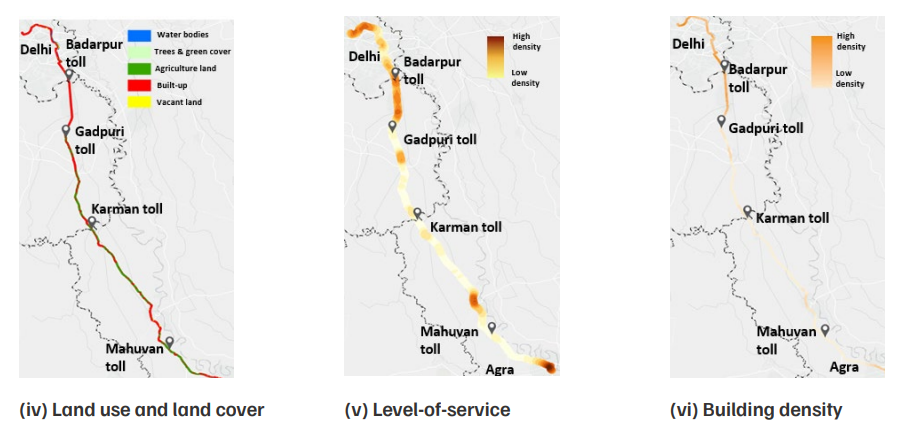
Source: Authors’ analysis
Note: The 10th factor is the proximity of a site to the highway corridor
Figure 5. Location of two substations and two PV plants of 5 MW each along the Delhi-Agra (NH44) corridor
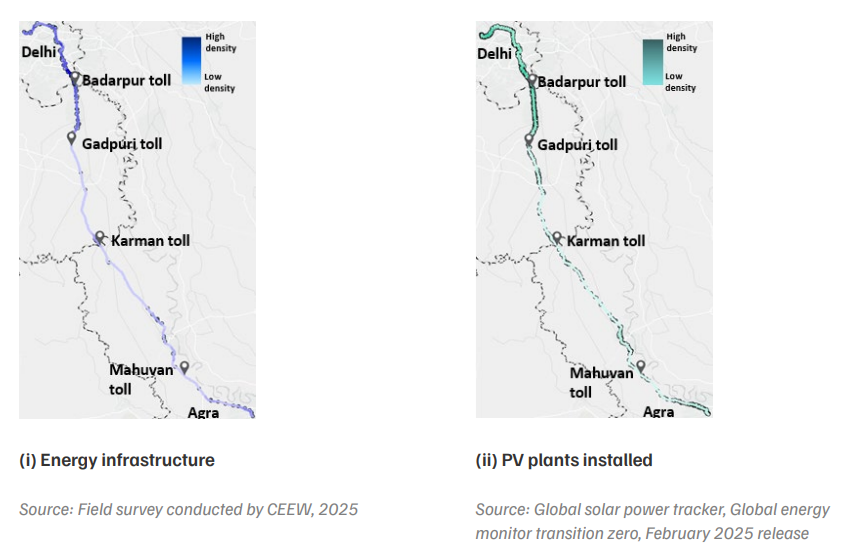
Figure 6. Screen, Size, Strategies and Site framework for EVCI build-out to support ZET transition
Screening and demand estimation — Two ZET adoption scenarios are considered: the first involves screening 100 MHDTs most suitable for pilot deployment; the second, a 30 per cent ZET transition scenario. Screening in both cases is based on three criteria (Annexure Figure A20): marginal benefits, where older vehicles nearing the end of their useful life offer higher environmental and operational gains upon replacement; second is ZET availability and feasibility, ensuring that current models can meet daily driving requirements without range limitations. The third criterion is operational compatibility, assessed by examining route alignment with the corridor and the share of tonne-kilometres occurring on highways.
Four operational categories and specifications of ZETs (Annexure Table A10)—MDT short, MDT mid, HDT regional, and HDT long—are considered. Historical average daily traffic (ADT), according to toll plaza reports and metadata, is ~60,000 PCU. To put this in perspective, the Delhi-Jaipur highway, often considered a ‘lighthouse’ or pilot corridor for ZET deployment, witnesses 110,000 pcu/day (A. Singh 2024). The PSA office’s ZET technology assessment estimates that 5,500 trucks operate daily along the Delhi-Jaipur corridor (GoI 2023). For the Delhi-Agra corridor, this study considers an ADT of 3,000 MHDTs.
Using toll plazas as breakpoints, the entire corridor is segmented into five stretches: Delhi<>Badarpur; Badarpur<>Gadpuri; Gadpuri<>Karman; Karman<>Mahuvan; and Mahuvan<>Agra. Historical toll transaction data is used to distribute the MHDTs across these segments, as shown in Figure A16. Additional information about these toll plazas is provided in the Annexure. Historical 14-month average monthly transaction counts and percentage share by vehicle type are depicted in Figure A16. Table A19 presents the corresponding traffic breakdown and estimated peak-hour ZET volumes derived from historical toll transaction reports and toll plaza metadata.
Charging demand is calculated by combining technical specifications —such as battery size, energy consumption, and trip distance—with estimated daily MHDT flows along each stretch of the corridor. The analysis uses stated responses on typical refuelling habits expressed in terms of fuel tank level collected by the VIUS. Three state-of-charge (SoC) assumptions are mapped to these: 90 per cent SoC for full-to-full refuelling, 75 per cent SoC for refuelling slightly above mid-tank, and 50 per cent SoC for mid-tank refuelling. Peak charging demand is calculated for different peak hour fractions (PHFs), from 5 per cent to 25 per cent, in steps of 5 per cent points.
Sizing and deployment strategizing — Existing EVCI along the NH44 Delhi-Agra corridor is first examined to assess its compatibility for ZET charging — charger ratings, working status, connector types, and locations. Installed charging capacity (supply) is calculated for each corridor stretch. This is then compared against the projected peak charging demand levels to estimate the supply gap. Based on the projected charging demand across different corridor stretches and operational segments, EVCI sizing forecasts the number of chargers required and the aggregate site capacity (in MW).
Two EVCI deployment strategies that differ in several key aspects, such as capacity, spatial requirements, risk profile, and use-case, are considered: i) anchor node or ‘hub’; and ii) distributed network or ‘corridor-wide’. The anchor node or ‘hub’ strategy focuses on consolidating many chargers (12–15 per site) at fewer, strategically located hubs, typically spaced every 50 km along the corridor. These hubs demand high installed capacity (3–5 MW) and could draw up to 1,000 A. The corridor-wide distributed network strategy requires more sites spaced ~10-20 km apart with fewer chargers (2–4 chargers per site), and an installed capacity of less than a MW.
These distinctive approaches indicate potential trade-offs between scale and spread. Anchor nodes emphasise centralised capacity for high-demand zones, while distributed networks prioritise accessibility and flexibility across broader geographic areas. The decision between the two eventually comes down to a combination of factors, such as costs, convenience, corridor characteristics, land availability, discom readiness, expected utilisation patterns, and the deployment timeline. Evaluating both approaches provides a comparative view of their suitability, accessibility, and readiness.
Siting and comparative evaluation — Site selection for both the anchor node and distributed network strategies builds on demand estimation and infrastructure sizing. The composite GIS layer for suitability assessment is used to evaluate candidate locations, combining spatial demand, corridor segmentation, and peak ZET charging load with existing infrastructure to identify the most suitable sites for EVCI deployment. The weighted overlay method is used to assess the infrastructure’s suitability. Each layer was assigned equal weights (0.1) for a balanced evaluation. Detailed steps and assumptions on the weighted overlay are provided in the Annexure.
System-wide environmental and economic implications are examined from the vehicle fleet and associated EVCI requirements. Annual GHG, PM, and NOx reductions, along with diesel savings from 30 per cent ZET adoption, are quantified. Capital costs, location-specific suitability for EVCI deployment, and the appropriateness of upgrading/retrofitting current versus new EVCI installations, inclusive of onsite and behind-the-meter electrical upgrades, are assessed. Lastly, variable renewable energy (VRE) potential from solar PV to reduce charging emissions is explored.
Doubling the range of current ZET models to 400 km would readily meet 75 per cent of MDT and 60 per cent of HDT daily driving requirements.
Figure 7 depicts the cumulative distribution function (CDF) plot of daily driving distances. Nearly 50 per cent of MDTs and 40 per cent of HDTs drive 250 km or less. However, the steep slope of both curves shows a high share of truck operations in the 250 to 400 km daily distances. Consequently, the electrification potential is highly sensitive or elastic to modest improvements in battery range. A 400 km range could accommodate the daily travel demand of over 70 per cent of MDTs and 60 per cent of HDTs. The median absolute deviation—MAD (119/142 km for MDT/HDT)—and interquartile range—IQR (276/305 km for MDT/HDT)— values indicate greater trip distance variability among HDTs. Furthermore, a notable share (25 per cent) of HDTs travel 500 km and beyond, as seen in the distribution.
Figure 7. Cumulative distribution function of daily distance driven
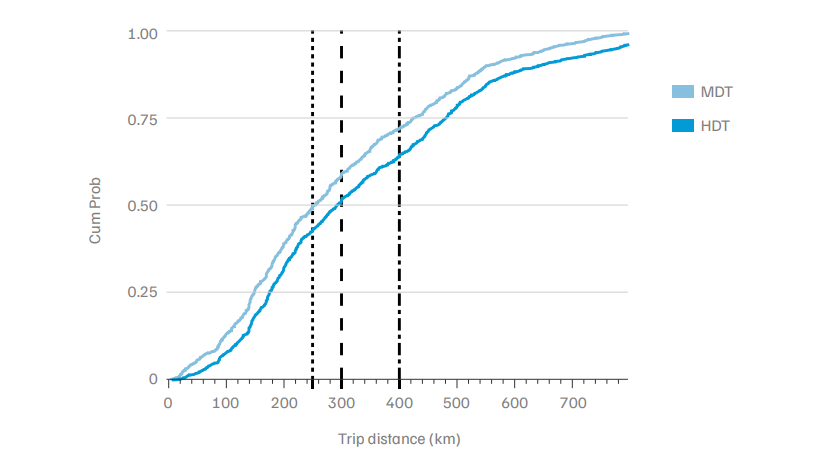
Source: Authors’ analysis
Note: Dashed and dotted lines show the different ZET ranges.
Interestingly, the MAD and IQR of the average rest time per stop of both MDTs and HDTs were 15 minutes, despite HDTs making more stops (2.1 versus 1.7 for MDTs) and taking longer breaks per stop (44 versus 38 minutes for MDTs) on average. The existing dwelling patterns and stoppage frequency already offer favourable charging windows without needing major operational or intra-day schedule changes.
Key driving and dwelling parameters of MDTs and HDTs were analysed using non-parametric tests to determine if ownership type (3PL/LSPs, owned & operated or O&O, hired or leased) is a factor. For O&O fleets, differences in trip distance, number of rest stops, rest duration, and tolls were not statistically significant between MDTs and HDTs (Table A3). The contrast was observed across all the above parameters between MDTs and HDTs operated by 3PL/LSPs, perhaps alluding that a differentiated (by ownership) yet targeted (by ZET segment) strategy for electrification could be necessary.
The majority of trucking activity on NH44 is within Haryana and Uttar Pradesh, concentrated around the main corridor and key arterial distribution points.
The origin-destination (O-D) pattern analysis of the freight dataset obtained from the VIUS reveals that trucks move across 15 states, running from Jammu and Kashmir in the north to Rajasthan in the west, West Bengal in the east and Telangana in the south. Delhi, Haryana, Madhya Pradesh, Punjab, Rajasthan, and Uttar Pradesh account for 98 per cent of recorded NH44 trucking activity origins and destinations, establishing them as the primary hubs. Approximately 40 per cent of the freight activity occurred to and from Haryana and Uttar Pradesh. Twelve per cent of the trucks operate within Uttar Pradesh, and 10 per cent ply from Uttar Pradesh to Delhi. In Uttar Pradesh, Mathura and Agra districts emerge as key nodes,
Figure 8. 96 % of truck flow is concentrated in Delhi, and cities in Haryana and Uttar Pradesh
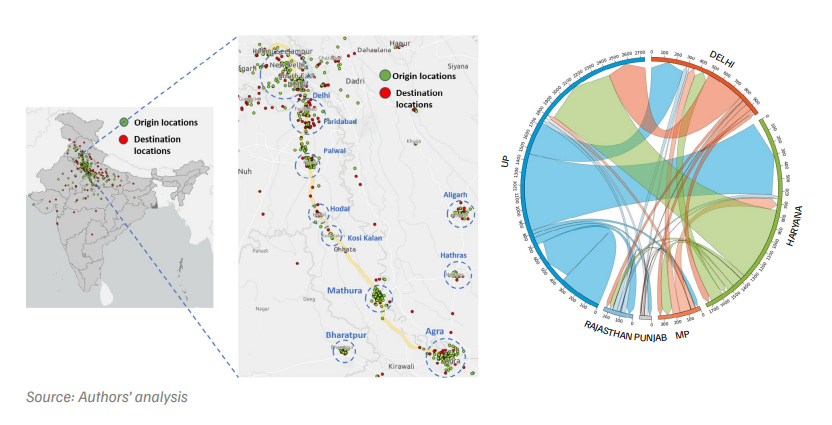
which lie directly along the corridor. Similarly, the Faridabad and Palwal districts play a crucial role in Haryana’s freight network. Smaller towns on the highway network, such as Hodal and Kosi Kalan, are emergent freight centres on the highway corridor. Figure 8 shows the origin and destination locations.
On average, the geodesic trip distance was 310 km (self-reported distance was 327 km, Figure A8), while the length of the corridor is approximately 250 km. This indicates that the trucks are utilising the highway corridor as well as travelling to nearby areas beyond their immediate stretch. Key nearby freight centres include Bharatpur in Rajasthan, Kanpur, Aligarh, Etawah and Firozabad in Uttar Pradesh, and Gurugram and Rohtak in Haryana. Key commodities transported along the corridor include perishables such as food grains, fruits, vegetables, and dairy products, along with cement and construction materials, making it a vital link for regional and interstate trade (Figure A5 and Figure A8). These observations indicate intense trucking activity through the corridor and the peri-urban area. The spatial clustering of truck O-D pairs and their adjoining districts confirms high route predictability and a concentrated tonne-kilometre share on NH44.
Convergence of haulage, commodity demand and operational fit offers the highest entry point for early ZET adoption.
Figure 9 shows the use-case, axle configuration, and tonnage profile of the first 100 highpotential ZET candidates identified according to the chosen screening criteria. Close to 60 per cent of these are MDTs, of which 2-axle MDTs with daily driving distances in the 200–300- km range account for the largest share (~35 per cent). Nearly a third are 4–6-axle HDTs operating in the 200–300-km range. Figure 10 offers another perspective on the first 100 ZETs based on the commodity transported. Construction materials and cement represent
Figure 9. ‘The First 100 ZETs’ by use-case, tonnage and MHDT segment
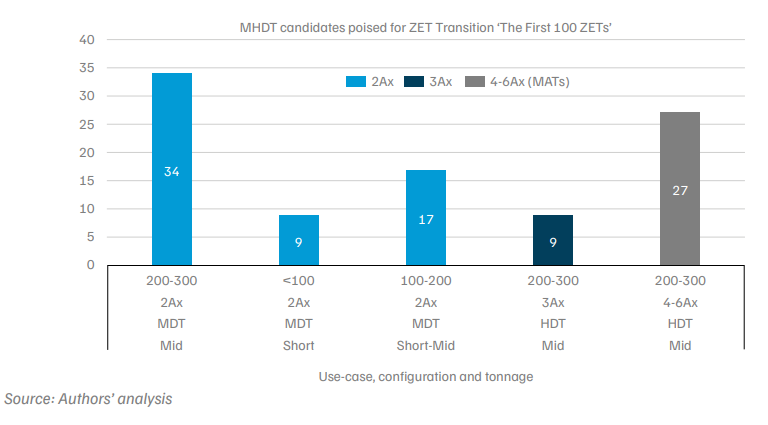
Figure 10. The First 100 ZETs by major commodity category transported
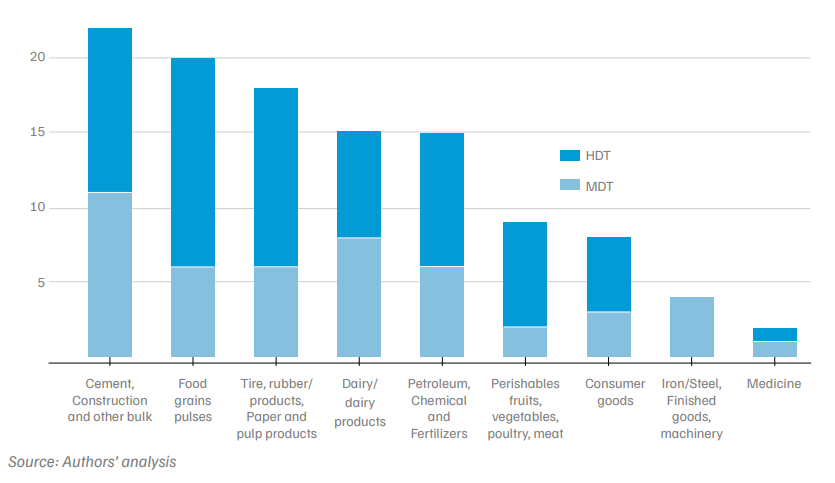
the largest transition opportunity, characterised by predictable routes between production facilities and major urban centres. These materials’ high density and heavy loads explain the predominance of HDTs. Food grains and pulses present the second-largest opportunity, with a notably higher proportion of MDTs compared to other categories. This reflects the regional nature of grain distribution networks, where farm-to-processor and processor-to-market routes are routine. The use case of MDTs in dairy products highlights the time-sensitive nature of this supply chain, with high-frequency, fixed-route operations between collection centres, processing facilities, and urban markets. Similarly, fruits and vegetables show balanced MDT/ HDT distribution, reflecting local and regional distribution patterns. A slightly higher share of HDTs transporting petroleum products and chemicals may be tankers plying from refineries to regional demand centres.
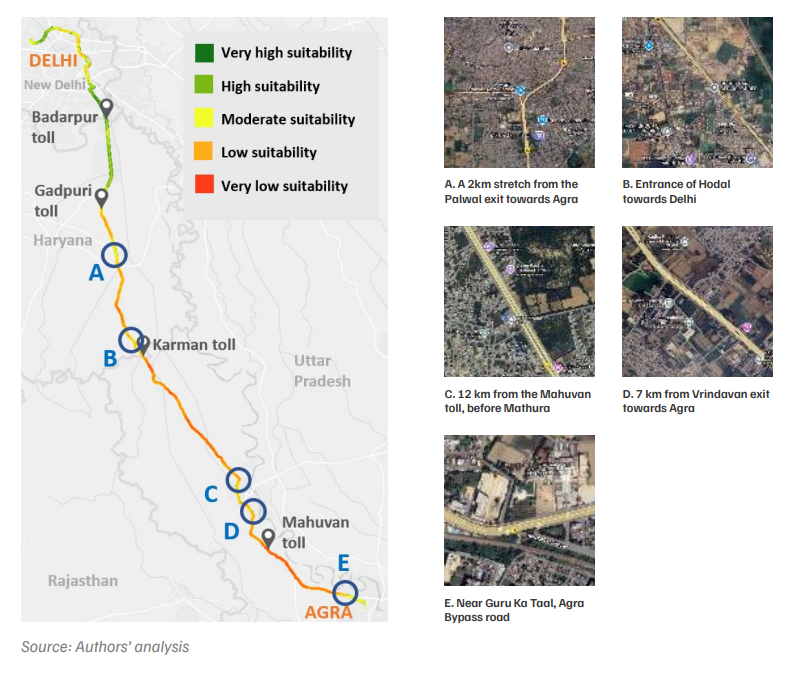
High suitability zone clusters near urban and peri-urban nodes, interspersed with long stretches of moderate to very low suitability towards Agra.
The resultant composite layer reveals the integrated suitability pattern along the Delhi-Agra corridor, with distinguishable variations within specific segments between Delhi, the toll plazas at Badarpur, Gadpuri, Karman, and Mahuvan, and Agra. The spatial distribution of suitability scores reflects the combined influence of all 10 criteria—depicted in Figure 4 and described in depth in the Annexure—at each location. The resultant composite layer was classified into five distinct suitability classes, ranging from least suitable to most suitable. This classification, with its granular location data, helps stakeholders prioritise locations for infrastructure development.
The five classes range from low- to high-suitability zones based on 10 factors mentioned in Table 5. The objective is to identify high-suitability clusters within low-suitability segments to highlight areas where land is affordable, demand is rising, and supporting infrastructure is present, ensuring optimal development opportunities.
Table 5. EVCI site suitability classification
| Suitability class | Description | Area (%) |
|---|---|---|
| Very low suitability | Predominantly agricultural or vacant land with little to no infrastructure, low population density, and limited energy infrastructure | 23 |
| Low suitability | Areas with sparse infrastructure and low population density, possibly with scattered settlements but insufficient supporting facilities | 28 |
| Moderate suitability | Emerging towns or peri-urban areas with moderate infrastructure and population density show potential for development | 21 |
| High suitability | Areas with well-developed infrastructure, good connectivity and adequate population density to support EV charging infrastructure | 16 |
| Very high suitability | Highly urbanised zones with dense infrastructure, high population density, existing commercial activity, and reliable energy infrastructure | 12 |
Source: Authors' analysis
The corridor, including a 500-m buffer on both sides, covers a total area of 204 sq km. Approximately 50 per cent of the corridor is not suitable for EV charging infrastructure due to the dominance of agricultural or vacant land, which lacks essential amenities, accessibility, and commercial activities Only 12 per cent can be classed as having very high suitability, and it is concentrated mainly in the Delhi to Gadpuri stretch. The Gadpuri to Agra stretch primarily features low- and moderate-suitability sites for potential EV charging locations. The overall volume of toll-plaza transactions (including cars/jeeps/vans, LCVs, and buses) decreases from Delhi to Agra (Annexure). However, daily truck volumes (2, 3, and 4-6 axles) rises sharply; near Mahuvan (~6,700), they increase five times relative to Badarpur (~1400), and, near Agra (~3300), they more than double.
Figure 11. EVCI suitability map showing high suitability clusters accompanied by stretches of low suitability
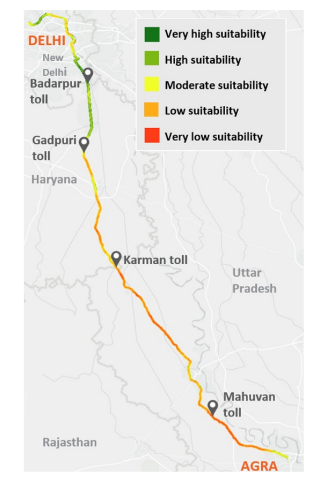
Source: Authors' analysis
It is interesting to observe that the same stretches of highway fall under the moderateto very-low-suitability classifications. The increase in truck traffic along segments with moderate to low suitability, coupled with the presence of high freight activity (refer to O-D pairs, Figure 8), clearly underscores the need for a balanced evaluation of anchor node or hub-based and distributed network or corridor-wide EVCI build-out. Unless otherwise explicitly mentioned, the preceding analysis and observations mainly pertain to the 30 per cent ZET scenario (N=1,000 ZETs).
Capacity, reliability, compatibility and equitable coverage pose challenges and opportunities for kick-starting high-power and fast charging for trucks.
Figure 12. Existing EVCI along the corridor by charging kW levels
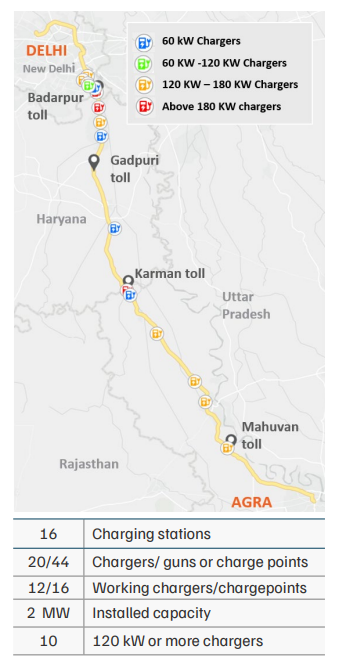
Source: https://www.statiq.in/ev-charging-station and Google Places API
The NH44 corridor between Delhi and Agra currently hosts 16 fast-charging stations with 44 charging guns (or charge points), of which only 30 are operational, translating to a working availability of ~70 per cent (Figure 12). The cumulative installed charging capacity across the corridor is approximately 2 MW, with only 10 chargers rated 120 kW or higher. The average daily throughput, depending on the stretch, utilisation, charging power, and number of existing EVCIs on NH44, varies between 3.5 MWh and 10.5 MWh (details refer to Annexure)
However, the spatial distribution of chargers is highly uneven. The Delhi–Badarpur stretch alone accounts for six chargers, all within a zone with moderate to very high suitability. This clustering continues, albeit moderately, through the Badarpur<>Gadpuri (6 chargers) stretch, gradually dwindling over Gadpuri<>Karman (3 chargers), and appearing again in Karman<>Mahuvan (5 chargers) stretches.
This imbalance is a symptom of the broader issue of inconsistent coverage, where fast chargers are concentrated in and near urban fringes, but taper off in peri-urban and rural stretches. Considering the opportunity cost, both geographic parity and higher installed capacity are vital design aspects, especially in stretches with increasing truck throughput and suitability potential, be it the pilot or scale-up phase of ZET adoption.
Directional build-up of traffic and thereby charging demand is observed in areas with sparse EVCI coverage and/or site suitability constraints
Figure 13. 30% ZET: (a) truck flows and (b) average daily charging demand by NH44 stretch and ZET segment
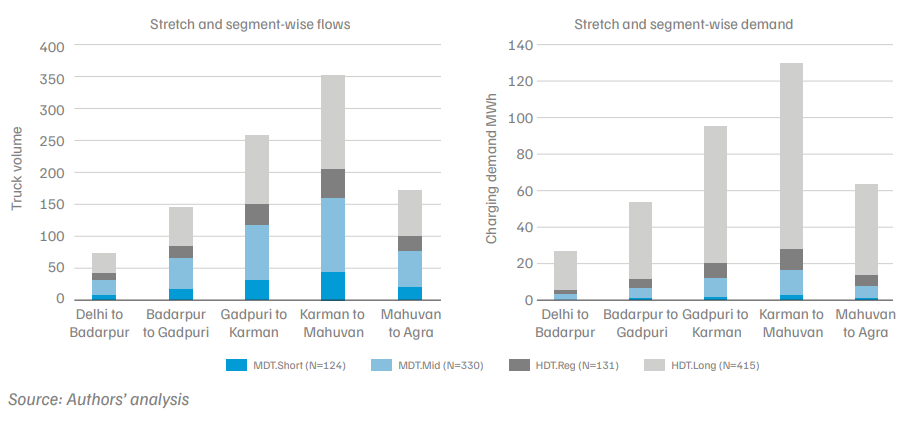
Truck movement and estimated charging demand across the NH44 corridor segments highlight a clear concentration of freight activity between Karman and Mahuvan, whereas the existing EVCI is more concentrated in the Delhi-Badarpur stretch (Figure 11). The average daily demand was estimated to be ~370 MWh, of which the Karman-Mahuvan stretch accounted for ~35 per cent or 130 MWh (Figure 13). The demand builds progressively and consistently at every stretch from north to south, peaking at Karman–Mahuvan. Gadpuri– Karman emerges as the second-highest demand stretch with ~95 MWh, followed by Mahuvan–Agra (63 MWh) and Badarpur–Gadpuri (53 MWh). Notably, there are no chargers (120 kW and above) in the Mahuvan–Agra stretch (Figure 12).
Though MDTs account for 45 per cent of flows, they represent only 13 per cent of the overall demand. Of the 454 MDTs, 242 are expected to charge to only 50 per cent SoC, whereas HDTs exhibit a higher share of deeper charging cycles. The data shows that nearly a third (175 out of 546) HDTs charged to 90 per cent SoC (compared to 144 MDTs), while 303 HDTs charged 50 per cent SoC (compared to 242 MDTs). Given that the analysis relies on a stated response to refuelling their existing ICE variant truck as a proxy for charging, such assumptions are practically plausible, as it constitutes one among the many possible real-world choices. For instance, it is reasonable to assume that, for HDTs, any stop they make needs to be worthwhile, given that the longer the average stoppage time, the higher the opportunity cost of idling. This makes deep charging (e.g., ≥75–90 per cent SoC) rational and apropos.
MDTs are often deployed for high-frequency, low-distance runs with relatively tight delivery schedules, such as consumption goods, or shuttle logistics between nearby industrial nodes and warehousing clusters (Palwal, Faridabad, and mandis on the outer periphery of Agra, for example). In such contexts, drivers may opt to “top up” rather than refuel fully, especially if they anticipate a short turnaround or the next trip may not require a full tank. If these are assumed to mirror ZET charging practices, a 50 per cent SoC is reasonable. Hence, the prevalence of mid-tank to full-tank or, equivalently, 50 per cent SoC among MDTs reflects a practical balance between duty cycle, predictability and recurring nature of trips, and usecase alignment—where a full tank is not always necessary.
To estimate the supply gap, peak hourly demand is compared against the capacity of existing EVCI installations. This intermediate step serves as a necessary precursor to identifying where retrofitting, reinforcement, or augmentation of existing EVCI, either as stand-alone chargingonly sites or where co-located with fuel stations, without requiring major utility grid overhauls at 33 kV and above levels. Isolating and determining the supply gap that cannot be met by existing and retrofitted sites forms the basis for examining the anchor node and corridor-wide distributed network approach for EVCI build-out.
Figure 14. Peak hourly demand across the NH44 stretch-wise and total corridor-wide for various PHF
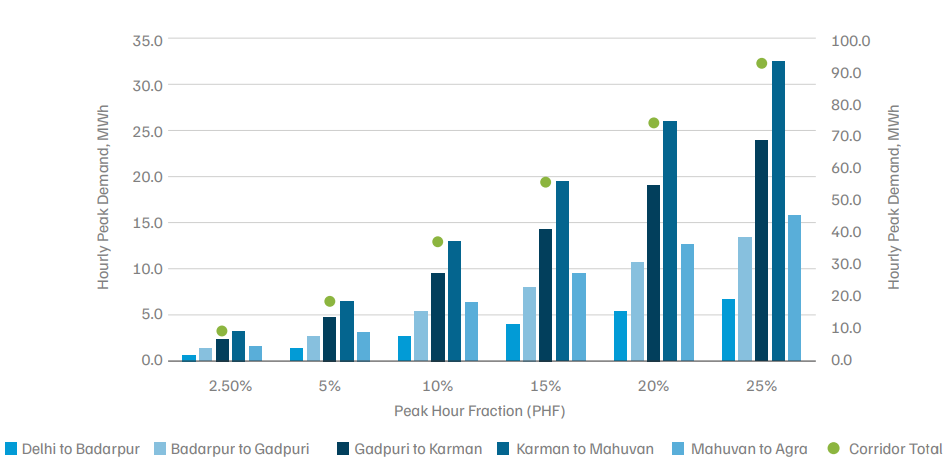
Source: Authors’ analysis
Note: Strictly speaking, from a classical travel demand and highway capacity planning perspective, PHF refers to the ratio of average volume during the peak hour period to four times average volume during the peak hour period. For simplicity and convenience, a relaxed definition of PHF is adopted, expressed as the ratio of peak hour to average daily traffic.
Figure 14 presents the hourly peak demand across the five stretches of NH44 for PHF varying from 2.5 to 25 per cent. Even at relatively low to modest PHF (5-10 per cent), corridor-wide demand reaches 30-45 MWh, indicating substantial baseline power requirements. The demand profile is not evenly distributed, with certain stretches (particularly Karman<>Mahuvan and Mahuvan<>Agra) having a noticeably higher peak demand. At higher PHF values (20-25 per cent), the overall corridor demand increases dramatically, suggesting potential grid stress points during the peak traffic period.
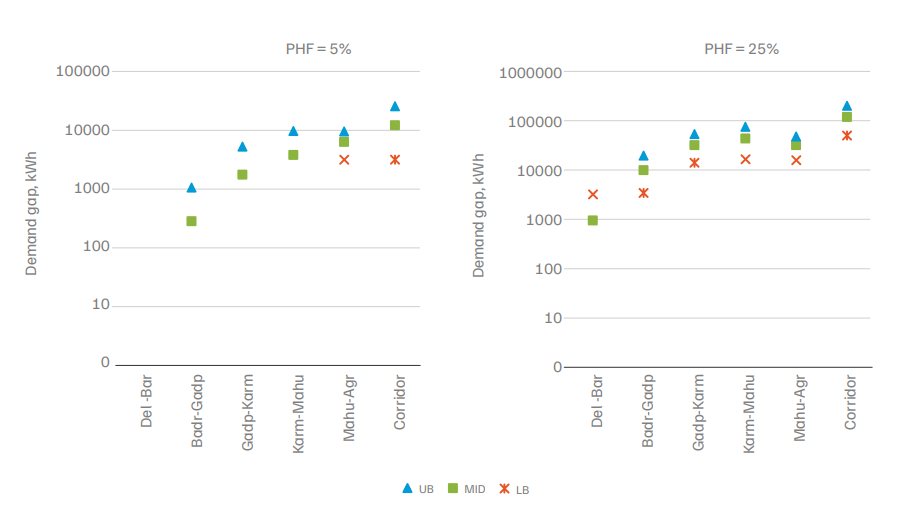
Figure 15. Existing EVCI capacity—supply and demand gap under select PHFs
Source: Authors’ analysis
Note: Zero values (or supply adequate) are excluded from the Y-axis in log-scale. LB/UB– lower and upper bound and charging relation assumptions are detailed in Annexure, Figure A22. The corridor peak demand assumes the worstcase coincident peak demand across the individual stretches happening at the same instance.
Figure 15 depicts the supply gap, expressed as the difference between peak hourly demand and existing EVCI capacity across the five NH44 stretches, as well as the total corridor, under 5 per cent and 25 per cent PHF. While multiple intermediate PHF values were considered, only these two cases were elaborated to streamline interpretation and serve as exemplar bookends for planning and stress testing. At 5 per cent PHF, the supply gap is minimal to moderate and largely concentrated in the southern stretches. While segments such as Delhi– Badarpur and Badarpur–Gadpuri theoretically show no observable gap, practically ~300 kWh—800 kWh and 1 MWh–2 MWh is still required in the stretches. The total supply gap across the corridor varies from ~3 MWh to 13 MWh. In the case of 25 per cent PHF, a notable supply gap can be evidenced across all stretches, with the corridor’s demand or supply gap rising sharply to anywhere between ~50 MWh and 80 MWh. It is more pronounced in the Gadpuri<>Karman (14 MWh–21 MWh) and Karman<>Mahuvan (~17 MWh–31 MWh) stretches. The Mahuvan<>Agra stretch is completely unserved by the current EVCI installations, effectively a ‘charging desert’ or ‘blindspot’, where the entire demand defaults to a supply gap.
At higher PHFs, the demand burden shifts and spreads north: Karman<>Mahuvan and Gadpuri<>Karman together contribute over 60 per cent of the corridor’s total supply gap. Delhi<>Badarpur consistently shows low to no supply gap (3 per cent at most) even at 25 per cent PHF. It must be clarified that this seemingly marginal share could be misleading by sheer virtue of interpretation as a percentage of the corridor’s total gap. However, in absolute terms, this still translates to 2 MWh. The Mahuvan<>Agra stretch occupies a persistent and significant share (20 per cent –30 per cent) of the corridor’s total supply gap at 25 per cent PHF. The extremities in PHF were chosen to show how and where the supply gap emerges, as well as intensities and shifts within the stretches and across the entire corridor. In the subsequent analysis, a PHF of 5 per cent is chosen.
Speed and future-proofing versus scale and flexibility govern the decision-making contours of EVCI build-out for ZET adoption, viz-à-viz anchor node ‘hubs’ or distributed network ‘corridor-wide’ strategy.
This section estimates the scale of infrastructure needed to support a 30 per cent zeroemission truck (ZET) uptake across NH44. Indicative and recommended sizing benchmarks are the focus over exact and precise prognosis. Due to the interrelationships between these technical aspects, siting and, consequently, costs, the two strategies are examined separately. A comparative summary of the key characteristics of the nodal and network strategy for EVCI build-out is presented in the Annexure, Table A12.
An anchor node or charging hub prioritises concentrating EVCI in fewer, high-capacity sites rated up to 6 MVA at approximately 40–50 km intervals. A distributed network or corridorwide strategy emphasises coverage using charging stations rated up to 1.5 MVA across the corridor at 10–20 km intervals. Or the chosen PHF, the peak hour demand varies between 1.3 MWh in the Delhi<>Badarpur stretch to 6.5 MWh in the Karman<>Mahuvan stretch.
Table 6. Exemplar unit specifications of nodal and network site
| Attributes | Anchor Node or 'Hub' | Distributed Network or 'Corridor-Wide' |
|---|---|---|
| Installed capacity | 4–6 MVA | 1–1.5 MVA |
| Number of chargers per site | 10–20 | 3–6 |
| Charger rating | 240–350 kW | 350–500 kW |
| Average corridor spacing | 40–50 km | 10–20 km |
| Land required (Average) |
1600–2100 m² ($1850 \text{ m}^2$) |
200–450 m² ($325 \text{ m}^2$) |
| Grid interfacing | Local reinforcement and substation level | Local reinforcement |
Source: Authors’ interpretation from (K.-C. Chu, Miller, K. G., Schroeder, A., Gilde, A., & Laughlin, M. 2024; D2Z 2023; Green 2020; Ladeinfrastruktur 2022; Unterluggauer 2022; ABB 2021; Burges 2021)
Notes: Local reinforcement refers to upgrading low-voltage (LVDS) to high-voltage distribution system (HVDS); the primary substation is 33/11 kV. Details in Annexure.
The worst-case coincident peak demand is 18 MWh across the corridor. This can be provided by 5 anchor nodes or 12 distributed-network (‘corridor-wide’) sites. A high-level description of each hub and network site is shown in Table 6. The preceding sub-sections describe candidate locations for siting anchor nodes and distributed network sites. Subsequently, unit, site, and overall corridor specification and cost estimates are discussed in the system-wide economic and environmental performance comparison, in Annexure. The estimated cost per station under the anchor node strategy ranges between INR 53 million and INR~90 million (INR 5.3 crore and INR 9 crore), whereas the corresponding estimates in the network strategy for EVCI build-out were between INR 140 and INR 230.
Anchor node ‘hubs’ strategy or Nodal ‘distributed network’ strategy moderates EVCI gaps and requirements in northern and middle stretches up to Gadpuri, whilst targeting severe deficits in southern stretches from Karman onwards, and especially in the Mahuvan<>Agra stretch
Figure 16. Five potential locations for the anchor node ‘hub’ EVCI build-out strategy along the NH44 corridor
Anchor Node or ‘Hub’ — Multiple EV chargers currently exist and are operational along the Delhi–Gadpuri toll stretch, primarily located near the Okhla industrial area, a key freight hub in Delhi. This section of the corridor serves as a critical link that connects Faridabad with Delhi. This stretch is characterised by a high density of offices, industries, warehouses and logistics facilities. A substantial amount of capital is required to set up a new charging station hub across this stretch due to the high cost of land. Based on the site suitability scores on the Gadpuri to Agra stretch, the proposed top five candidate anchor nodes or hubs are presented in Figure 16.
These locations are strategically positioned at the city entry and exit points (e.g., Palwal, Hodal, Mathura, Vrindavan, Agra), ensuring high demand due to ongoing commercial activities. These five locations align spatially with the trip O-D, as illustrated in Figure 8. The identified anchor nodes, viewed together with the regional industrial and commercial activities, fulfil the quantum and gradient of EVCI requirements—moderate gaps in northern and middle stretches (sites A and B) whilst targeting severe deficits in southern stretches (sites C, D and E), especially Mahuvan<>Agra. Each of these sites is briefly described below.
Distributed network or ‘corridor-wide’ strategy mitigates range and charging anxiety whilst improving redundancy, coverage and accessibility.
Figure 17. Potential sites for a distributed network EVCI build-out strategy along the NH44 corridor
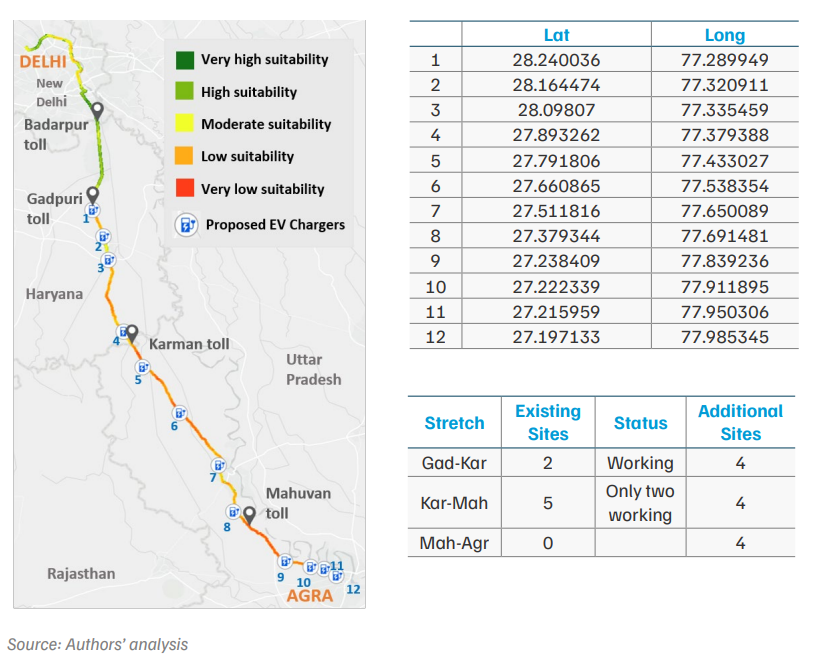
Distributed network or ‘corridor-wide’— On the Delhi to Gadpuri stretch, the existing chargers are functional and well distributed. Rather than new installations, an upgrade is recommended. The Gadpuri to Agra stretch constitutes approximately two-thirds of the total corridor length, and most existing chargers are non-functional. New charging stations are required to ensure adequate coverage. Based on the infrastructure suitability analysis, locations with a suitability score above 0.45 have been selected. Four locations per stretch have been identified for new installations. Between the Gadpuri and Karman toll plazas, existing chargers are located near proposed sites 3 and 4. In such cases, the existing chargers can be retained instead of installing new ones. Notably, proposed location 3 is an NHAI wayside-amenities site, making it an ideal candidate for new EVCI installation.
Only two chargers are operational between the Karman and Mahuvan toll plazas, which is also the longest stretch of the corridor. Given the spatial distribution, only the existing chargers between proposed sites 5 and 6 can be considered, as others are either not working or very close to existing ones. In total, five locations are recommended (four proposed + one existing).
Proposed charger locations have been strategically placed at entry and exit points of towns and cities, major intersections, industrial and commercial hubs, and designated rest stops, ensuring accessibility and alignment with traffic flow. Several warehouses, mandis, and factories are located near these sites. In the Mahuvan<>Agra stretch, as there are no existing chargers, proposed charging locations based on the suitability map are positioned towards and closer to Agra.
Hub-based strategy offers a greater, it requires an additional CAPEX between INR 530 lakhs– INR ~900 lakhs, whereas the corresponding estimates in the network strategy for EVCI build-out were contingent on parallel grid decarbonisation.
Table 7. Anchor node vs distributed network for EVCI rollout: A cost comparison (in INR lakh)
| Hub | Network | Remarks | ||
|---|---|---|---|---|
| Chargers | ||||
| 240 kW Hub 350 kW Network |
Cost per unit | 75 | 90 | Charger-Equipment, Cables, Earthing, Lighting, Structural & Civil, Service; Onsite/Upstream-RMU, 11 KV HT Cable, Compact Substation, LT Cable, Cable Trench, Service Installation, 20% included in equipment |
| N per site (or) |
15 | 5 | ||
| 350 kW Hub 500 kW Network |
Cost per unit | 90 | 105 | |
| N per site | 10 | 3 | ||
| Grid Interfacing | ||||
| Local reinforcement LV to HVDSS |
New Installation (or) |
124 | 124 | (Distribution transformer, cables, HT/LT line) Assumed 10% of hardware costs |
| Augmentation Installation |
85 | (Distribution transformer, cables, HT/LT line) Assumed 10% of hardware costs |
||
| 33/11 kV Primary substation |
Equipment | 124 | 17 | PSCC poles, 1 x 5 MVA power transformer three 11 kV feeders with 11 kV/ 2 MVAr capacitor bank |
| Structural and Civil |
150 | |||
| Other | ||||
| Fixed | Line Charge | 4 | 2.5 | |
| Total | ||||
| 240/350 kW (or) |
7759 | 7216 | 5 Hubs, 50–75 chargers | |
| 350/500 kW | 6634 | 5596 | 12 Network sites, 36–60 chargers | |
Source: (BEE 2024; CEA 2023, n.d.; MHI 2024; Tata n.d.; TSSPDCL 2023; UHBVNL 2023; UPERC 2022; ISGF 2024)
Notes: Detailed cost benchmarks and compiled data in Annexure.
Unit costs, site-level specification and the overall CAPEX to meet the charging demand are presented in Table 7. The CAPEX for five hubs across NH44 costs between ~INR 720 million (INR 72 crore) and INR 780 million (INR 78 crore), depending on whether 240-kW or 350-kW chargers are chosen. In the network strategy EVCI roll-out, the CAPEX varies between INR 560 million (INR 56 crore) and INR 660 million (INR 66 crore) for 350-kW and 500-kW chargers, respectively. The economics of network strategy versus hubs can be seen in Table 7, particularly with higher-capacity chargers, leading to 5 per cent to 25 per cent overall CAPEX reductions.
It should be noted that the cost figures presented are approximations compiled from extant studies and industry benchmarks rather than detailed site-specific quotations, such as the bill of quantities/materials (BoQ/M). Land acquisition costs have been deliberately excluded due to varying rates across the Delhi–Agra corridor, with reliable land parcel rate data unavailable. Nevertheless, the CAPEX estimated in Table 7 is based on the best available data and is plausible. Though the absolute unit, site or system-wide costs may vary during the realworld implementation phase, cost differentials provide directionally cogent inferences.
Potential fuel cost reductions and thereby GHG benefits of ZET transition have been studied from various angles — sectoral benefits of ~3–4 gigatonnes of cumulative CO2 reduction through 2050 (Raina 2023), 9–35 per cent GHG reduction depending on MHDT segment (Abhyankar 2022), 840 billion litres of diesel savings by 2050 (GoI 2023). and up to 80 per cent less GHG savings over vehicle’s lifetime (Yadav 2024), to name a few. An overarching theme governing such studies and their respective findings is the importance of decarbonising the electricity grid. Renewables account for 45 per cent of India's existing capacity of ~450 GW (GoI 2024a). However, 70 per cent of the generation is thermal — coal and lignite (GoI 2024a). The average electricity grid emissions factor is 0.75 kg CO2 /kWh for the vintage year 2024 and varies between 0.55 and 0.96 kg CO2 per kWh (CEA 2024).
Time-of-day, charging location, charging duration, regional grid mix, season and meteorological influence, renewable energy integration and coordination with charging and subsequently effect the potential for reducing charging emissions. Nascency of ZETs, limited to the non-availability of highly resolved spatio-temporal charging patterns of representative ZETs or utilisation data from compatible public chargers (rated at least CCS2, 120 kW), further limits the ability to conduct spatially and temporally resolved granular analysis. In light of these challenges, a stylised reduced-form approach has been adopted to evaluate whether and to what extent the EVCI strategy chosen has any bearing on charging-related emissions. This approach is outlined below.
First, using ISRO's solar calculator, at each of the chosen hub and network sites, the PV potential was evaluated. Average PV output was estimated to be 7.65 kWh per m2 per day. Referring to Annexure Table A22, there was little to no variation in PV potential across all 17 locations (5 hubs and 12 network sites) in the entire corridor. Structured scenario analysis was performed to determine fuel consumption across all combinations of low/medium/ high (L/M/H) of select parameters — distance, energy consumption, fuel efficiency, and PV utilisation (see Annexure Table A24). A few other assumptions were made regarding the realistic share of area available for PV installation on-site (40 per cent), and the incremental area for PV in anchor nodes (25 per cent) over distributed network sites. The area required per charger is based on MoHUA guidelines for public EVCI (15 × 7 = 105 m2 per charger) (MoHUA 2015). Five-number summaries across all modelled scenarios (81 in all) are presented in Annexure Table A25. Annual energy demand (under the 30 per cent ZET or N = 1,000 ZETs) varied from 56,250 kWh to 2,18,750 kWh. Diesel consumption and emissions ranged from 18,750 to 62,500 litres, and 51,563 kg CO₂ to 1,71,875 kg CO₂, respectively. Charging-related emissions lie between 42 t and 164 t CO₂.
Based on the PV generated, PV capacity (in kW) and battery energy storage system (BESS) back-up (1-hour of the same capacity as the PV and 4-hour options) were estimated (See Annexure Table A26). Based on publicly available data and industry estimates, the additional CAPEX for PV, BESS and the integrated PV+BESS were then calculated (Refer Table A18 and Table A26). The anchor node strategy can generate 2–4 times more PV than the network strategy. Simultaneously, it requires an additional CAPEX between INR 53 million to INR 90 million, whereas the corresponding estimates in the network strategy for EVCI build-out are between INR 14 million to INR 23 million Furthermore, both the anchor node and distributed network strategy for EVCI roll-out with PV+BESS can fully offset the charging-related emissions. This stylised and reduced form scenario analysis demonstrates the trade-offs of integrating PV+BESS for emission-neutral ZET charging.
Augmentation is a resource-effective option to reduce CAPEX and set-up time. Typically, it involves increasing the cable amperage to handle higher loads, reconductoring, replacing ageing transformers with higher-capacity units, and installing intermediate poles or aerial bunched cables to minimise line losses. This is suited for retrofitting areas already served by 11 kV networks, where incremental enhancements could suffice, are technically feasible and economically prudent. Co-location is another use case for augmentation. Charging stations situated at existing fuel stations, logistics hubs, or otherwise, are already equipped with commercial and industrial-grade electrical connections that could be reinforced.
Figure 18. Barriers to ZET adoption
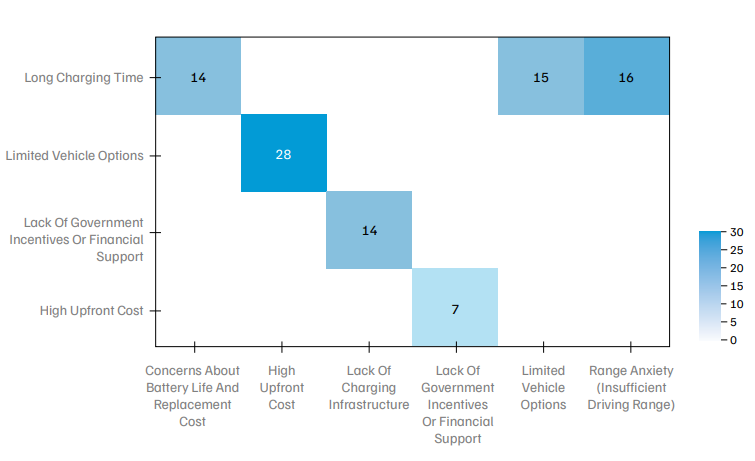
Source: Field survey conducted by CEEW, 2025
Note: Respondents were asked to select up to 2. Heatmap shows the combined response in matrix form.
ZET adoption perceptions of LSPs almost three-fourths-fourths remain opposed or uncertain due to high upfront costs, charging infrastructure gaps and the misalignment between the current ZET product landscape and their preferences—longer-range (300-500 km), extended warranty (8+ years), battery swappable variants and asset-light ownership.
This add-on component of the overall data collection exercise, previously clarified in the ‘Data and Methods’ section, surveyed LSPs—a key stakeholder group in the trucking ecosystem. This survey of 100 LSPs revealed key insights into their fleet composition, operational patterns, and perceptions regarding ZET adoption expectations—policy, technology, and business models. The aim was to learn ground-truth logistics needs and fleet preferences with the status quo, and identify the policy levers needed to catalyse ZET penetration. Descriptive and distributional data summaries are provided in the Annexure.
The findings revealed that 46 per cent of LSPs are unwilling to electrify their fleets, 19 per cent favour EV adoption, and 35 per cent remain uncertain about the transition. The respondents highlighted several barriers, with the upfront cost and limited availability of EV freight vehicle models emerging as the primary concern. Other barriers to EV transition in freight include long charging durations, range anxiety, lack of adequate charging infrastructure, and insufficient government incentives. The heatmap in Figure 18 shows that the high upfront cost and limited model offerings are the dominant—and perhaps mutually reinforcing—barriers to ZET adoption. Technological reliability and usability challenges manifest as a pressing hurdle highlighted by the overlaps between range anxiety, charging concerns, and model offerings.
The survey captured key requirements of LSPs regarding fleet electrification—the candidate vehicle they are most likely to replace with an EV, and its desired specifications. This includes battery capacity, range and warranty, axle configuration, ownership model, maintenance expectations, and charging preferences. To better understand the actual needs, the study focuses on the responses of LSPs who showed their willingness for EV transition (Yes) and are uncertain about it (Maybe). Together, these segments account for 54 per cent of the sample. Regarding battery specifications, 40 per cent of the LSPs prefer a battery capacity of 250–500 kWh, with an optimal driving range of 300–500 km. Their battery warranty expectations almost equally favour 8 years/500,000 km, or 10 years/1 million km, ensuring long-term reliability, cost-effectiveness, and assuaging concerns about battery replacement.
Under vehicle specifications, 51 per cent of the LSPs expressed their willingness for HDT (above 12 tonnes GVW) in a 6 X 4 axle configuration, reflecting the industry’s demand for high-capacity transport solutions. In terms of body type, refrigerated trucks emerged as the most preferred option (64 out of 100 LSPs), followed by a similar share of preference towards flat beds and tankers. Regarding ownership models, leasing and rental models have gained traction among LSPs, as they eliminate the need for high upfront investments and mitigate the risks associated with direct ownership. Additionally, for vehicle maintenance, 54 per cent of the LSPs preferred third-party service providers, reducing their operational burden and ensuring efficient fleet management. Interestingly, a quarter of the respondents expressed interest in vehicle usage or a per-km-based annual maintenance contract (AMC).
Charging infrastructure inadequacy was one of the prominent concerns among the LSPs surveyed. While ultra-fast charging was preferred (150–350 kW), a notable demand for battery swapping was also observed, and approximately 40 per cent showed a willingness to explore this option. The LSPs showed consensus (72 per cent) on a 2–4 hour charging time span, striking a balance between current operational efficiency and downtime. In terms of access, logistics hub-based charging was the most preferred approach, followed by highway public charging, ensuring convenience and minimal disruption to existing supply chain operations.
Fleet modernisation, tent pole pilots, harnessing existing and or co-locating new EVCI with OMCs are tactical avenues for accelerating near-term ZET uptake.
The Delhi-Agra highway is a key freight corridor spanning multiple logistics hubs, warehouses and industrial zones such as Faridabad, Palwal, Hodal and Tughlakabad ICD, interspersed with major tourist attractions and travel hubs like NCR, Mathura, Vrindavan and Agra. This is an exemplary integrated and multi-modal corridor supporting the manufacturing, logistics, tourism, and service sectors. Through a combination of primary surveys of ~3,000 truck drivers and 100 LSPs, augmented by diverse secondary and tertiary data sources, our analysis revealed several practical insights that highlight NH44 as the natural lodestar to the Delhi-Jaipur ‘lighthouse’ corridor for ZET pilot deployment. In particular, this work critically examined suitability, adequacy, and future needs from the perspective of charging infrastructure. Using a four-step methodology—screen, size, strategise, and site—the analytical framework quantified the economic and environmental implications of two EVCI build-out strategies, anchor node or ‘hubs’, and distributed network or ‘corridor-wide’, to support the charging needed under a 30 per cent ZET scenario. Fleet modernisation, pilot deployment, and maximising asset utilisation will be crucial during the nascent stage of ZET adoption.
Specific to the Delhi-Agra corridor, perhaps a hybrid strategy with anchor nodes only can work in stretches with sparse EVCI installations and or moderate to low suitability. While a greenfield charging hub incurs a higher CAPEX, it is best construed as a one-time investment that can be future-proofed through PV+BESS integration, and substation upgrades — Mahuvan<>Agra and Karman<>Mahuvan stretches are cases in point as Mathura, Vrindavan and Agra, including cold chain logistics, APMCs, and warehouses catering to the diverse commodity flow mix on the outskirts of Agra. These are highthroughput stretches that service key logistics nodes, making them well-positioned for multiMW charging hubs that can anchor the broader ZET rollout. This can be complemented by a partially distributed network of EVCIs along stretches with high suitability, and at sites where retrofit, upgrade, or co-location is feasible. This could offer synergistic benefits in terms of both coverage and capacity.
Tactical interventions in the immediate term were discussed above. Overarching policy recommendations are presented in the section 6.
Zero emission truck transition requires system wide efforts and initiatives that involves multiple stakeholders across the value chain. In the context of charging infrastructure and considering the nascency of ZET penetration below are the summary 10 key recommendations for accerlerating ZET transition (Table 8).
Table 8: Summary of key policy recommendations and interventions
| 1. Right-sizing EVCI for high-volume segments with habitual patterns |
|
→ Prioritise deployment of charging infrastructure in high-frequency, short-haul logistics segments such as **FMCG and agro-logistics**. These flows exhibit predictable routes and anchor clients – ideal for EVCI right-sizing and pilot rollouts. → Charging demand from **cold-chain logistics and essential consumption goods** offers guaranteed utilisation. Incentives (such as viability gap funding, concessional land, or toll waivers) in these segments can unlock anchor demand. |
|
• MoRTH, DHI, state logistics cells, private FMCG/agri logistics players, CPOs |
| 2. Develop multi-MW charging hubs in freight-intensive zones |
|
→ Facilitate freight hubs with **2–5 MW capacity** near toll plazas, mandis, and industrial corridors like Gadpuri-Karman or Mathura Industrial Area. These hubs could house **15–20 DC fast chargers** with power ratings of **240–350 kW**, supported by **3–5 MVA transformers**. → Encourage battery energy storage systems (**BESS**) and solar PV integration to improve grid flexibility and reduce long-term peak load costs. Each hub should have **1–2 MWh of BESS capacity** and **~500 kW of solar PV**. |
|
• MoP, CEA, UPEIDA, HSIIDC, NICDC, DISCOMs, industrial estate authorities, CPOs |
| 3. Central regulatory agencies and state DISCOM coordination |
|
→ **DISCOMs** must proactively identify substation-level, secondary feeder and distribution transformer upgrade requirements at the **HT level (33/11 kV)**. → A **zone-wise capacity audit** in collaboration with state nodal agencies can help pre-empt bottlenecks and facilitate 'plug-and-play' readiness at charging sites. → Establish minimum technical specifications for distributed energy storage systems at multi-MW charging hubs. → Issue planning and implementation guidelines for EVCI-ready substations and integrate EVCI in DISCOM investment plans via **SERC directives**. |
|
• DISCOMs, SERCs, state nodal agencies, MoP, CEA, NITI Aayog |
| 4. Public-private partnership and OMC co-location |
|
→ Leverage oil marketing companies (**OMCs**) along **NH19 and NH44** for the co-location of public charging points. Target underutilised or marginal OMC plots near key freight exits like Runkura (Agra), Nagla Padia, Sikandra on **NH2; along NH19 (Mathura Road/Delhi-Faridabad); and Palwal**. → Encourage and adopt standardised **PPP models** with shared risk and guaranteed uptime clauses. → Partner with private logistics companies operating in the region to co-invest in charging infrastructure at key logistics hubs like **Tughlakabad ICD and Agra’s Foundry Nagar**. |
|
• OMCs (IOCL, BPCL, HPCL), MoPNG, private logistics operators, MHI, ULBs |
| 5. Retrofit, upgrade, upkeep and reinforce underperforming infrastructure |
|
→ Incentivise or mandate upgrading existing **60–120 kW** to at least **180–240 kW CCS2 chargers**. This reduces redundant asset lock-in and allows cost-effective scaling. → Encourage repurposing of fleet depots and converting privately held chargers into **semi-public charging infrastructure** to improve accessibility and availability. |
|
• MHI, MoP, DISCOMs, CPOs, fleet operators |
| 6. Foster technology-agnostic enablers |
|
→ Define uniform charging standards (**CCS2**) across voltage tiers (**150–350 kW**) for ZET charging. → Promote standardised interfaces and thermal management benchmarks for batteries > 300 kWh. |
|
• MHI, BIS, ARAI, DHI, OEMs, battery manufacturers, BSO/CPOs |
| 7. Enable data-driven spatial decision support systems |
|
→ Institutionalise data sharing from tolling (**FastTag**) and **OEM telematics** to improve understanding of MHDT O–D, dwelling, trip, and refuelling habits. → Facilitate **pilot data collection activities** from charging stations—charging times, duration, peak and average load, as well as utilisation. → Develop a harmonised framework for such data-sharing, both from trucking activity as well as charging stations. |
|
• NHAI, MoRTH, concessionaires, OEMs, fleet telematics providers, MHI, CPOs |
| 8. CSR and experimental models for de-risking |
|
→ **CSR-linked capital** from OEMs, logistics majors, and fleet operators can serve as catalytic funding for new EVCI pilots and BaaS facilities. → Treat corridor development as a testbed for bundling interoperable services — charging, swapping, repair, parking — under anchor tenancy models. |
|
• OEMs, logistics majors, fleet operators, MoCI, financiers |
| 9. Agile ownership, leasing and maintenance |
|
→ Develop policies to support **third-party maintenance providers**, such as certification or accreditation programmes for providers specialising in ZETs. → Provide the option of **per-kilometre-based annual maintenance contracts (AMCs)** for interested operators, aggregators, shippers and LSPs. |
|
• MHI, Ministry of Skill Development, financiers, shippers, LSPs, OEMs |
| 10. Constitute regional ZET taskforce for corridor-level implementation |
|
→ Develop **ZET roadmaps and investment plans** aligned with national targets whilst tailoring them to local freight patterns, land, and grid infrastructure. |
|
• ULBs, Transport department, MoRTH, MHI, DISCOMs, NITI Aayog, OEMs, CPOs |
Source: Authors’ analysis
Note: For each action item, the relevant stakeholder group(s) are indicated in blue.
As of 2024, only about 600 electric trucks are in operation across India, the majority being heavy-duty trucks (HDTs). To accelerate the deployment, industries and government agencies have signalled demand for around 5,000 ZETs by 2027 and approximately 7,700 ZETs by 2030. These projections are supported by multi-prolonged initiatives, including NITI Aayog’s e-FAST India programme, the Bharat ZET policy Advisory framework with 30 proposed interventions, and the National Green Hydrogen Mission, which provides viability gap funding for alternate fuel vehicles. Despite these efforts, ZET adoption faces headwinds related to technology, infrastructure, costs, and operator perceptions.
The PM -Edrive initiatives allocate ₹ 11,000 crore, ₹ 2,000 crore as a capital grant for charging infrastructure development. It also sets an aggregate target of 1800 fast chargers (240 kW each) across 20 major truck corridors and 35 national highways, providing the foundation for large- scale ZET adoption. The Delhi-Agra section, NH44, is a strategic freight corridor connecting multiple logistics hubs, warehouses, and industrial zones in Faridabad, Palwal, Hodal, Mathura, Vrindavan, and Agra, as well as to widen NCR. It forms part of both the Amritsar-Kolkata Industrial Corridor (AKIC) and the Golden Quadrilateral, linking east-west and north-south national highway corridors. Recognised as a priority trucking corridor by the Ministry of Heavy Industries (MHI) and a high-traffic corridor by the Ministry of Power (MoP), it carries diverse loads, including time-sensitive perishables, bulk materials, and essential consumption goods. Its consistent truck volumes and travel patterns make it a strong candidate for piloting ZET deployment and planning EVCI.
The greenfield anchor nodes, which are large centralised charging hubs, are necessary in stretches with sparse existing installations or low-to-moderate site suitability. But these hubs require higher upfront CAPEX; they can be future-proofed through substation upgrades and renewable integration (PV+BESS). Meanwhile, retrofitting and co-locating chargers at fuel stations, warehouses, and logistic parks can expand coverage quickly and cost-effectively along high-suitability stretches. This distributed approach reduces land acquisition needs, accelerates deployment, and mitigates range anxiety. So a hybrid approach with greenfield anchor hubs at sparse existing installations and retrofitted EVCIs at high suitability stretches can provide both throughput and accessibility, anchoring broader ZET rollout.
To meet the daily charging demand of ~1000 ZETs (30% of truck movements on NH44), two deployment strategies are possible: Anchor node (hub) model: There are about five hubs with 50-75 high-capacity chargers in total. The 240 kW hub option has a higher upfront cost (~ ₹ 77.6 crore) but delivers strong throughput and long-term efficiency. The 350 kW hub option has a slightly lower cost (~ ₹ 66.3 crore) while also maintaining reliability, requiring new 33/11 kV substations and larger land parcels. Distributed network model: About 12 network sites with 36-60 chargers spread along the corridor. The 350 kW network option deployment cost is approximately ₹ 72 crore, offering accessibility at shorter intervals (10-20 km), whereas in the 500 kW network option, there is a slightly lower cost of ₹ 56 crore but with risks of underutilisation and demand fragmentation. In short, 5 hubs (240/350 kW) or 12 distributed sites (350/500 kW) could support 1,000 ZETs. The hub model is CAPEX-heavy but efficient for long-term GHG abatement, while the distributed network improves accessibility, redundancy and early adoption.
How States can Build Capacity for Urban Mobility Officials:
India On The Move:Stories of people driving the bus sector
How can India Accelerate Electric Three-wheeler Adoption?
How can India Make the Electric Three-wheeler Transition Gender-inclusive?