Council on Energy, Environment and Water Integrated | International | Independent
Suggested citation: Arora, Chetna, Vaibhav Chaturvedi, and Pallavi Das. 2025. How can India's Automobile Manufacturing Sector Go Net Zero? Exploring Decarbonisation Pathways. New Delhi: Council on Energy, Environment, and Water.
As the world moves towards net-zero emissions, a transition is expected across all economic sectors. While the shift to electric vehicles addresses tailpipe emissions, deep decarbonisation must also come from how vehicles are manufactured and how materials like steel and rubber are sourced. Many leading auto companies in India and globally are already setting science-based targets to reduce emissions across their operations and supply chains. Using CEEW-adapted version of the GCAM model, the analysis focuses on scope 1, scope 2, and upstream scope 3 emissions from vehicle manufacturing and key materials used such as steel and rubber. It also explores how production-linked emissions, energy use, and input prices may evolve under a net-zero scenario, offering insights for OEMs, component manufacturers, and material suppliers. The modelling exercise projects vehicle production to rise nearly 3.7 times by 2050, significantly increasing energy use and material demand. Although emissions intensity declines under BAU, a greater push is needed to achieve net zero.
As the world moves towards net-zero emissions, a transition is expected across all economic sectors. For the automobile sector, this would lead to a higher demand for low-carbon vehicles (Hannon et al. 2022). Currently, about 65–80% of a vehicle’s emissions come from its use phase. Electrification is a major step toward reducing these emissions (Hannon et al. 2020), while hybrid vehicles are also being explored as a bridge in the short to medium term. This, in turn, means that there will be major shift in the type of vehicles being manufactured.
The Indian automobile sector contributes around 7.1 per cent to the country’s Gross Domestic Product (GDP) (Jha, Mishra, and Singh 2023) and employs over 19 million people (Ministry of Heavy Industries GoI 2023). Indian Original Equipment Manufacturers (OEMs) will need to ramp up low-carbon vehicle manufacturing to tap into the growing demand in the future. For auto OEMs to be competitive in this changing landscape, they will need to focus on decarbonising their own manufacturing and upstream supply chains. It is therefore important to understand the future pattern of vehicle production, associated energy use, and emissions, as well as the growth in demand for materials like steel or rubber used in vehicles. The OEMs must make informed decisions based on long-term assessments on the kind of materials and energy required for vehicle manufacturing. This assessment examines the potential implications if India’s automobile sector aims to achieve net-zero by 2050, ahead of the national goal of net-zero 2070.
Many leading auto companies in the world and India are already setting targets under the Science Based Targets initiative (SBTi) to reduce their scope 1, 2, and 3 emissions. As per the SBTi’s corporate net-zero standard, companies are required to cut all possible emissions by 2050 to achieve net-zero and limit global warming to 1.5°C (SBTi n.d.).
Our analysis for the decarbonisation of Indian auto manufacturing uses the Global Change Analysis Model (GCAM, CEEW version) to project future energy demand and emissions for this industry. GCAM is an integrated assessment model (IAM), widely used and cited in top international scientific literature. In this effort, we restructured the model to specifically represent both direct and indirect energy use and emissions from India’s automobile sector.
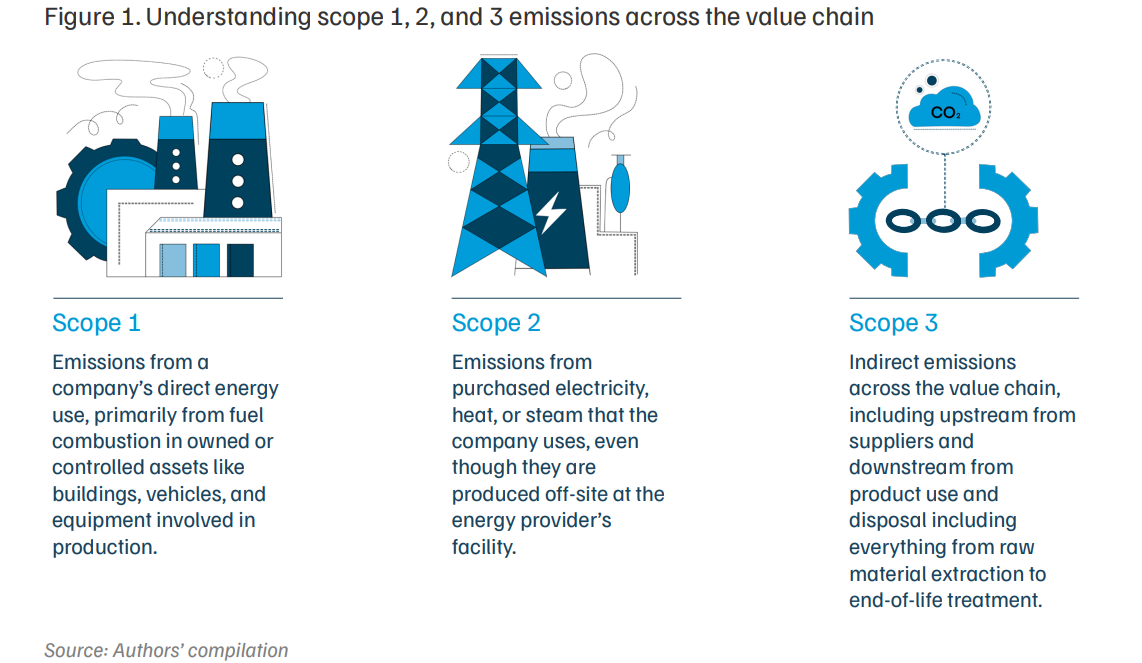
BOX 1. Classifying direct and indirect emissions in the automobile supply chain
In this analysis, we consider both direct and indirect emissions related to vehicle manufacturing in India, as explained below:
Source for the Box 1: Authors’ compilation
This modelling exercise, based on vehicle production trends, aims to draw some key insights on future energy use in vehicle manufacturing by OEMs, component manufacturers, and material suppliers, along with associated emissions. Moreover, under a net-zero scenario, we explore how the energy mix of OEMs, component manufacturers, and material suppliers would need to evolve. We also investigate how future fuel and material prices may change, and their implications for vehicle manufacturers. Further, if the auto sector moves to net-zero 2050, it will have overflowing implications on upstream sectors such as steel and rubber etc. This will position the auto industry as a key driver in accelerating the economy-wide 2070 net-zero transition.
Based on data sourced from the Society of Indian Automobile Manufacturers (SIAM) and Annual Survey of Industries (ASI), in 2020, it was observed that the largest share of emissions in vehicle manufacturing and its supply chain came from material production (scope 3), with steel being a significant contributor due to its reliance on coal-based processes.
To achieve net-zero by 2050, the auto sector would need to address not just its direct emissions (scope 1) but also its indirect emissions (scope 2 and scope 3), as these are much higher compared to their scope 1 emissions. To reduce scope 2 emissions OEMs must source electricity from renewable energy sources. This can be achieved through Power Purchase Agreements (PPAs) with renewable energy generators, purchase of Renewable Energy Certificates (RECs), and investments in captive renewable energy installations. Many automakers, both global and domestic, have already committed to sourcing 100 per cent renewable electricity by 2035. The annual electricity demand for auto OEMs will be around 195 PJ by 2050, approximately 54.17 TWh. If this demand were to be met entirely through solar energy, about 34 GW of solar capacity would be needed just to provide clean electricity for automakers.
Collaboration with upstream suppliers is also key for cutting scope 3 emissions. By jointly assessing emissions and setting clear science-based targets, OEMs can encourage innovations in low-carbon materials. This is particularly important for energy intensive components like batteries and engines, as well as materials such as steel and rubber.
Using more recycled scrap will help reduce the overall environmental and carbon footprint of vehicle manufacturing. In order to reach netzero, taking into account scope 3 emissions where carbon capture and storage (CCS) technology is not commercially feasible, the share of scrap in steel production would have to be scaled up significantly to around 48 per cent by 2050. This will reduce the energy requirement of upstream suppliers.
Along with increasing the use of scrap-based steel, increasing the share of hydrogen in steel suppliers’ energy mix is also essential for achieving net zero by 2050. Under the Net-zero (NZ) scenario, hydrogen for producing steel for the auto sector would be approximately 1.71 million metric tonnes per annum (MMTPA). To put this into perspective, this represents about 20 per cent of India’s current annual hydrogen consumption (IEA 2024b). By 2050, this amount would be needed solely for producing steel used in vehicles, alongside increased scrap-based steel production. Automakers can support this transition by getting into Advanced Market Commitments (AMCs) with steel manufacturers. These AMCs will help establish market certainty for green steel and channel investments in emerging technologies through future demand certainty.
Moreover, given the system boundary of this analysis, as shown in Figure ES1, sourcing electricity generated from renewables and low-carbon steel under the NZ scenario could help reduce emissions from vehicle manufacturing by 87 per cent. Finally, for residual emissions that are harder to eliminate, OEMs can explore carbon offsets. By investing in high-quality offset projects, they can complement their direct emission reduction strategies.
India is the third-largest automobile market in the world, and produced 28.43 million vehicles in FY2023–24 (SIAM 2024). It contributes to 7.1 per cent of the nation’s GDP and nearly half (49 per cent) of India’s manufacturing GDP (Jha, Mishra, and Singh 2023). The sector directly and indirectly supports more than 19 million jobs. Further, India is the world’s second-largest twowheeler producer, sixth-largest passenger vehicles producer, and seventh-largest commercial vehicles producer (Jha, Mishra, and Singh 2023). The country is also the leading tractor manufacturer in the world (Ministry of Heavy Industry, GOI 2023).
India is expected to continue to strengthen its automobile manufacturing as domestic demand for mobility and vehicles increases with rising income. However, as economies try to decarbonise, this industry will need to manufacture low-carbon vehicles, driven by governmental regulations and consumer preferences. Alongside meeting the growing demand for these vehicles, OEMs are also working to decarbonise their own manufacturing and upstream supply chains. Categorising emissions into scope 1, 2, and 3 is a method for accounting for a company/sector’s emissions. Organisational boundaries define the entities and assets that are accounted for in scope 1 and scope 2 greenhouse gas emissions, as explained in Figure 1.
Analysis shows that a vast majority (97.5 per cent) of emissions from the automobile industry come from what is known as scope 3 emissions, while scope 1 and 2make up just 2.5 per cent (Vengat and Ashar 2022). In particular, the largest sources of scope 3 emissions are found in purchased goods and services (category 1)1 and the use of sold products (category 11), highlighting key areas for automakers to focus on in order to lower their greenhouse gas emissions. Many leading auto companies2 are already setting near-to medium term emission targets under the SBTi. While currently, these targets focus on scope 1 and 2, along with downstream scope 3 emissions, it is essential to understand emissions from the upstream supply chain as well.
Studies suggest that on a Lifecycle Assessment (LCA) basis, despite higher manufacturing emissions associated with producing the battery, an electric vehicle’s cumulative emissions are lower than its internal combustion equivalent after two years in operation (IEA 2024a). Specifically, the life-cycle GHG emissions of battery electric vehicles registered in India today are significantly lower than those of gasoline, diesel, or CNG cars (Bieker 2021).
OEMs around the world have ramped up their vehicle programmes to shift from traditional internal combustion engine vehicles (ICEVs) to low-carbon vehicles. Various government initiatives, such as production-linked incentives (PLI) for automobile and auto components, aim to boost the manufacturing of Advanced Automotive Technology, while primarily focussing on ZeroEmission Vehicles. Additionally, the PLI on Advanced Chemistry Cell (ACC) battery storage aims to set up giga-scale ACC and battery manufacturing facilities, while also incentivising substantial domestic value addition (Sharma 2023).
For automakers to be competitive in the changing demand dynamic along with decarbonising their production, it is important to understand future vehicle production trends; energy use in vehicle manufacturing by OEMs, component manufacturers, and material suppliers, along with associated emissions. This assessment explores the implications of the impending transition if India’s automobile sector targets 2050 as the net-zero year—well ahead of the national goal of 2070. Under such a net-zero scenario, how will the energy mix of OEMs, component manufacturers, and material suppliers change, how fuel and material prices might change, and what these changes mean for vehicle manufacturers?
This report primarily examines scope 1 and scope 2 emissions from OEMs, along with category 1 scope 3 emissions. These emissions together represents around 15 per cent of the total emissions across the value chain (Vengat and Ashar 2022). The study aims to develop pathways for the Indian automobile sector to achieve net-zero and explore the developments that will shape the sector’s emissions profile through 2050.
For modelling decarbonisation pathways for the automobile sector, we use the Global Change Analysis Model (GCAM, CEEW version). GCAM is an integrated assessment model that represents the behaviour of and interactions between five systems: the energy system, water, agriculture and land use, the economy, and the climate. It is an open source community model developed at the Joint Global Change Research Institute (JGCRI), University of Maryland.
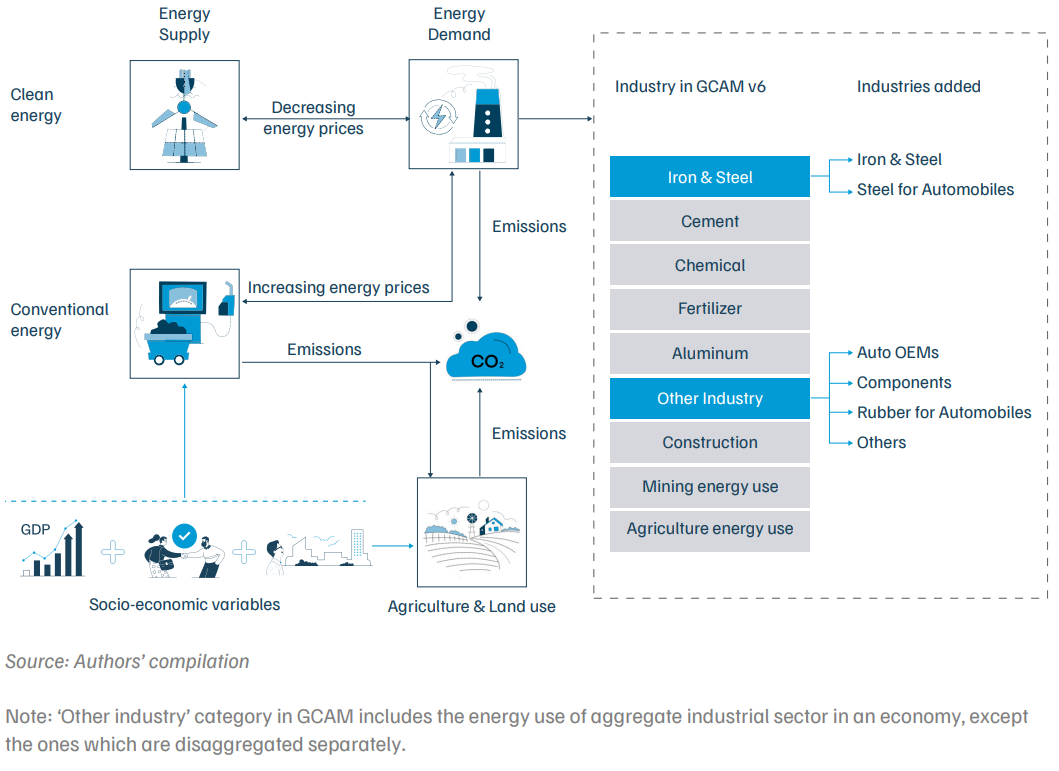
GCAM takes in a set of assumptions including key socioeconomic drivers such as population and GDP, along with technology costs, efficiency improvements, and other policies to project future trends in energy and emissions along with price effects. Nine detailed industrial sectors are modelled in GCAM, and they include six manufacturing sectors (iron and steel, chemicals, aluminium, cement, fertiliser, and other industry), and three non-manufacturing sectors (construction, mining energy use, and agricultural energy use) (JGCRI n.d.).
We disaggregate the manufacturing sector within GCAM to add detailed automobile industrial sectors (2W, 3W, 4W, bus and LCV, HCV) along with their components (seat, body, chassis, electrical equipment, engine, battery, and other parts) to the model structure. Moreover, given that steel and iron components account for 65 per cent of an average vehicle (World Steel Association 2025) and rubber makes up for around 7 per cent in the total volume in production of an average car (Ahmad et al. 2020), we have added two additional industries, steel and rubber for automobiles, to track the supply of key materials for the manufacturing of vehicles.
Figure 2. Adapted modelling framework to track emissions from the automobile industry in GCAM
Historical production (both 2015 and 2020) of automobiles has been calibrated using data sourced from the Society of Indian Automobile Manufacturers (SIAM) (see annexure, Table A3). Data on per-unit energy consumed for manufacturing vehicles and their parts has been calculated using the Annual Survey of Industries (ASI) conducted by the National Sample Survey Office (NSSO) (detailed in annexure Table A1 and A2). The ASI is the principal source of industrial statistics in India, particularly data on organised manufacturing. It covers all factories employing 10 or more workers using power, and those employing 20 or more workers without using power (MOSPI 2024).
We classified the categories available in ASI into sectors/subsectors that are part of the industries added in GCAM. Data for rubber and steel manufacturing, along with the per-vehicle requirement of these materials, was taken from literature (annexure, Table A4) and other sources.3 Detailed mapping, data tables and sources are available in the annexure. For each sector, the future industrial output growth is driven by GDP, income elasticities, and price elasticities.
We calculated the number of all parts and components manufactured in the suppliers’ industry based on the vehicle manufacturing data in OEM, as specified in our analysis’ system boundary. For example, for 1,000 two-wheelers (2W) produced by an OEM, we take 1,000 2W engines on the component suppliers’ side. This is done for all parts used in a vehicle, to ensure that we count the indirect energy consumption of the OEMs only.
Our analysis considers scope 1 and scope 2 emissions of automobile OEMs, which are covered and represented in the OEM industry added to the GCAM. For upstream4 scope 3, we consider only category 1 emissions—that is, emissions on account of purchased goods and services represented in the parts and components and material industries (steel and rubber) added to GCAM. We present the results and insights from four scenarios that were developed using GCAM as depicted in Table 1.
Table 1. Key features of scenarios developed in the modelling exercise
| Scenario | Description | EV/Hybrid penetration by 2050 |
|---|---|---|
| Business-as-usual (BAU) | No specific emission reduction target | EV: Around 48 per cent by 2050 |
| High-hybrid (HH) scenario | Similar to BAU, but OEMs produce a higher share of hybrid vehicles. The difference lies in components (battery vs engine). | EV: Around 12 per cent by 2050 Hybrid: Around 36 per cent by 2050 |
| Net-zero (NZ) scenario | The auto industry, along with upstream suppliers, aims to achieve net-zero emissions by 2050. | EV: Around 54 per cent by 2050 |
| Alternate net-zero (A-NZ) scenario | Auto OEMs aim for net-zero by 2050, while upstream suppliers, including component and material suppliers target net-zero by 2070. | Same as NZ |
Source: Authors’ compilation
It is crucial to understand the current status of India’s auto sector to understand the future evolution of energy use and emissions. As a first step, we estimated emissions and energy use for 2020 across vehicle segments and the automobile supply chain in India, using data from SIAM and ASI. This section highlights key insights on energy consumption and emissions, categorised separately for vehicle manufacturing, components, and materials.
Figure 3. Material suppliers account for 60% of energy used for manufacturing vehicles in India (2020)
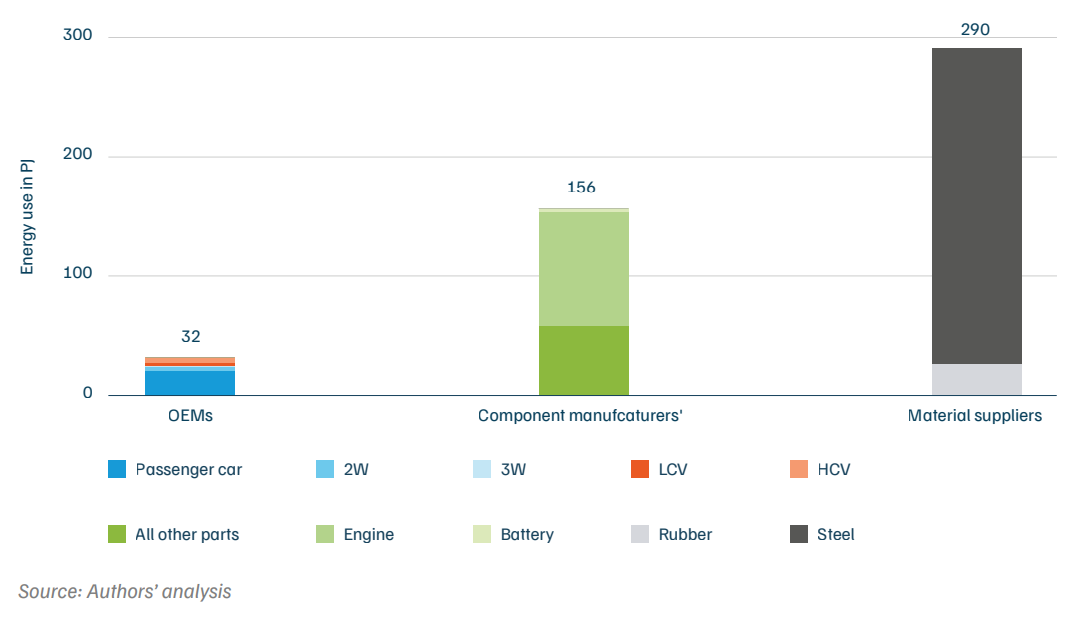
Bulk of energy use for vehicle manufacturing happens in the upstream supply chain
Figure 3 provides an overview of energy consumption in the vehicle manufacturing sector in India for 2020. A total of around 478 PJ was utilised, with approximately 32 PJ directly utilised by automobile OEMs, inclusive of electricity, and 156 PJ used in manufacturing equipment and parts used in vehicles. Interestingly, a major chunk of the energy used was in manufacturing materials, including rubber and steel for vehicles—almost 290 PJ. This means almost 60 per cent of India’s vehicle manufacturing-related energy was consumed in manufacturing materials, 33 per cent in manufacturing parts and components for vehicles, and only 7 per cent was directly used by OEMs.
The energy intensity of OEMs varies from those of component manufacturers
The manufacturing of heavy commercial vehicles (HCVs), including semi-trailers and trailers, has the highest per-unit energy intensity at around 21 gigajoule (GJ) per unit, followed by fourwheelers and light commercial vehicles (LCVs) with 5.97 and 4.64 GJ per unit, respectively. In comparison, manufacturing an automobile battery5 has an energy intensity of 5.58 GJ per unit, followed by engines at 3.66 GJ per unit, and electrical equipment (generator, ignition) with 1.74 GJ per unit.
Four-wheeler and engine manufacturing account for majority energy use in OEMs and components, respectively
It is interesting to note that while the energy intensity of freight vehicles is high, it is the four-wheeler segment that consumes higher energy in absolute terms within OEMs. This is because the total number of passenger vehicles produced in India far outstrips the number of freight vehicles manufactured. Notably, 63 per cent of the energy used by OEMs was allocated to the manufacturing of 4W. In comparison, commercial vehicles together account for only 22 per cent of the energy consumed by OEMs. Two-wheeler (2W) manufacturing also consumes more than a tenth of the energy used by OEMs.
Of all vehicle components manufactured, 62 per cent of the energy used in the production of vehicle parts was specifically directed towards engine manufacturing in 2020. Other components, including bodies for motor vehicles, chassis, electrical equipment, seats, and the rest, together accounted for around 37 per cent of the energy used for manufacturing components.
Steel used in vehicles dominates energy consumption in the upstream supply chain
Materials used in vehicle manufacturing consume a high amount of energy in their production.
In 2020, a total of 290 PJ of energy was used for producing materials to be used in vehicles. Given that steel accounts for around 65 per cent of an average vehicle (World Steel Association 2025) and is highly energy intensive, over 90 per cent of this was used solely for manufacturing steel for vehicles.
Of the 264 PJ of energy used to manufacture steel, majority of it came from coal. On the other hand, around 27 PJ of energy was used to produce rubber that was used in vehicles. Around 56 per cent of this energy used in rubber production came from electricity, while the rest was from gas and refined liquids.
Figure 4. 83% of emissions from vehicle manufacturing in 2020 were scope 3 emissions
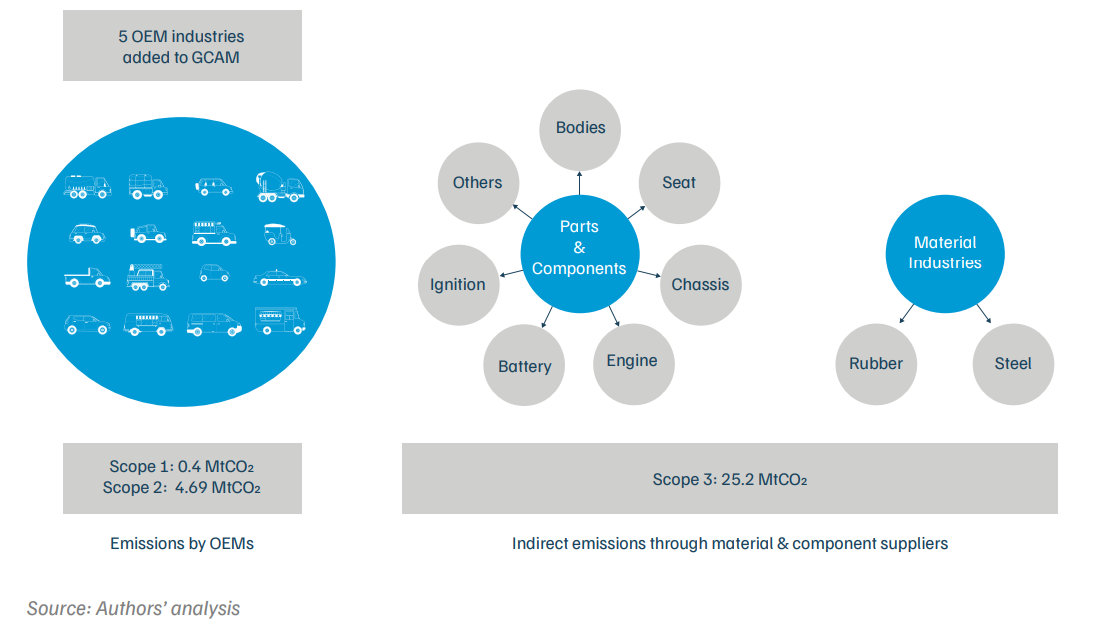
Direct emissions of OEMs are negligible compared to emissions from component and material manufacturing
Emissions from vehicle manufacturing in India for 2020 stood at 30.3 MtCO2, as noted in Figure 4. Scope 1 and scope 2 (electricity related) emissions of OEMs, were approximately 0.4 MtCO2 and 4.69 MtCO2, respectively. Under scope 3 emissions, the analysis considers only category 1 emissions from purchased goods and services, which feed into the OEMs’ supply chain through parts, components, and materials (steel and rubber). In 2020, these emissions exceeded 25 MtCO2, which interestingly makes up 83 per cent of the total emissions studied. Steel manufacturing alone accounted for more than 77 per cent of the total emissions, which is around 23.39 MtCO2. The remaining 1.11 MtCO2 came from the manufacturing of parts and components for vehicles, including the battery, engine, seat, chassis, and electrical equipment, ignition systems, etc.
In this section, we present key results from the modelling exercise across all four scenarios, as described in table 1.
Under this scenario, auto OEMs and upstream suppliers follow market trends and policies without specific emission reduction targets. In this section, we present key insights related to future energy requirements and emissions in the BAU scenario across different stages of vehicle manufacturing.
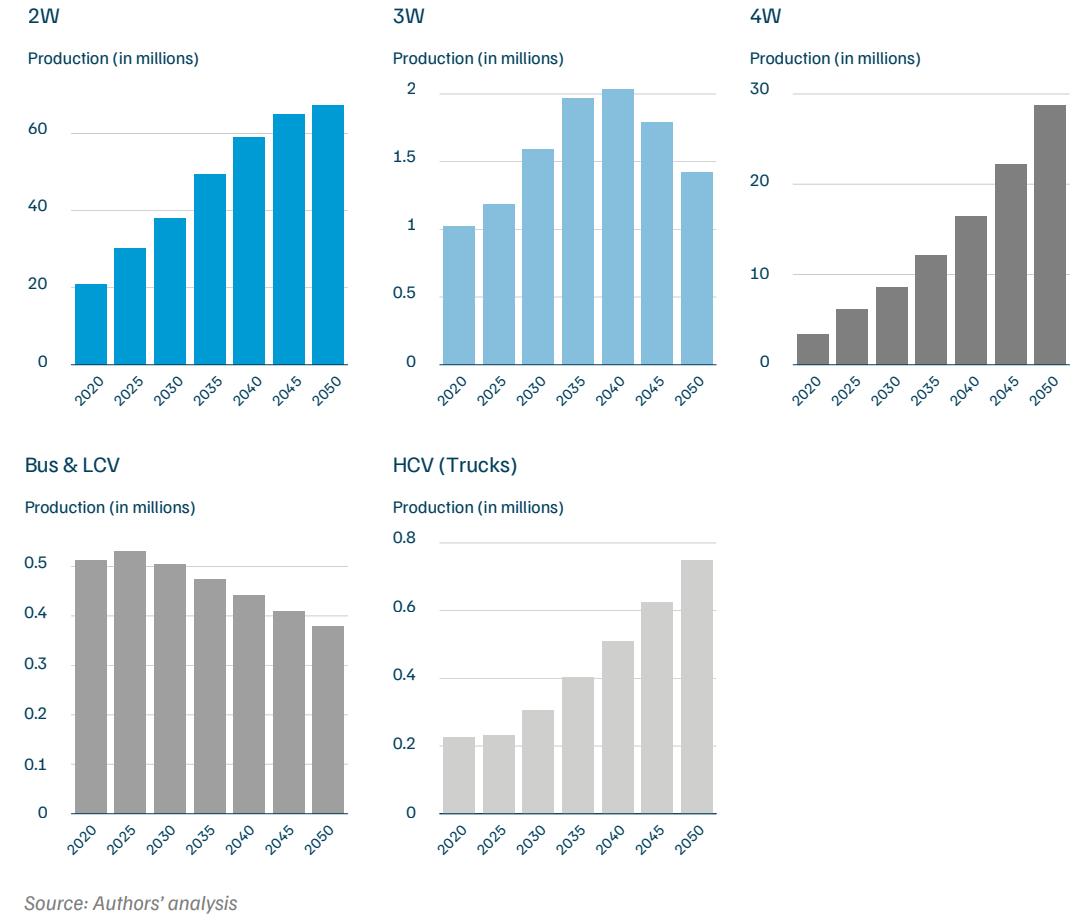
Annual vehicle production in India is projected to grow by 3.7 times between 2020 and 2050, driven by increasing demand for transport services
Annual vehicle production is expected to increase from 25 million in 2020 to around 96 million in 2050 (GCAM – CEEW). Two-wheelers are expected to increase more than threefold between 2020 and 2050. Similarly, three-wheeler production would double from 2020 to 2040, post which it would start to decline. In contrast, LCVs such as buses would experience a decline in production after 2025, because as income increases, people will start shifting to private cars.
Annual passenger car production would witness a significant surge, increasing approximately ninefold from 2020 to 2050. This rise is attributed to higher income levels, prompting a shift from two-wheelers and public transport to private car ownership. Additionally, HCVs such as trucks are expected to more than triple in production during this period due to the growing demand for freight mobility, as shown in Figure 5.
Figure 5. Annual vehicle production in India is projected to reach 96 million by 2050
Given the rise in vehicle production, the demand for parts and components would grow at the same pace between 2020 and 2050, as shown in Figure 6. Additionally, with increasing EV penetration, the annual production of batteries for vehicles would start to grow post-2025, reaching 46 million by 2050. Conversely, annual engine production is expected to decline post2045 due to the shift away from ICEVs, but it would still amount to 49 million in 2050 under the BAU scenario.
Figure 6. Demand for parts and components used in vehicles is projected to grow 3.7 times between 2020 and 2050
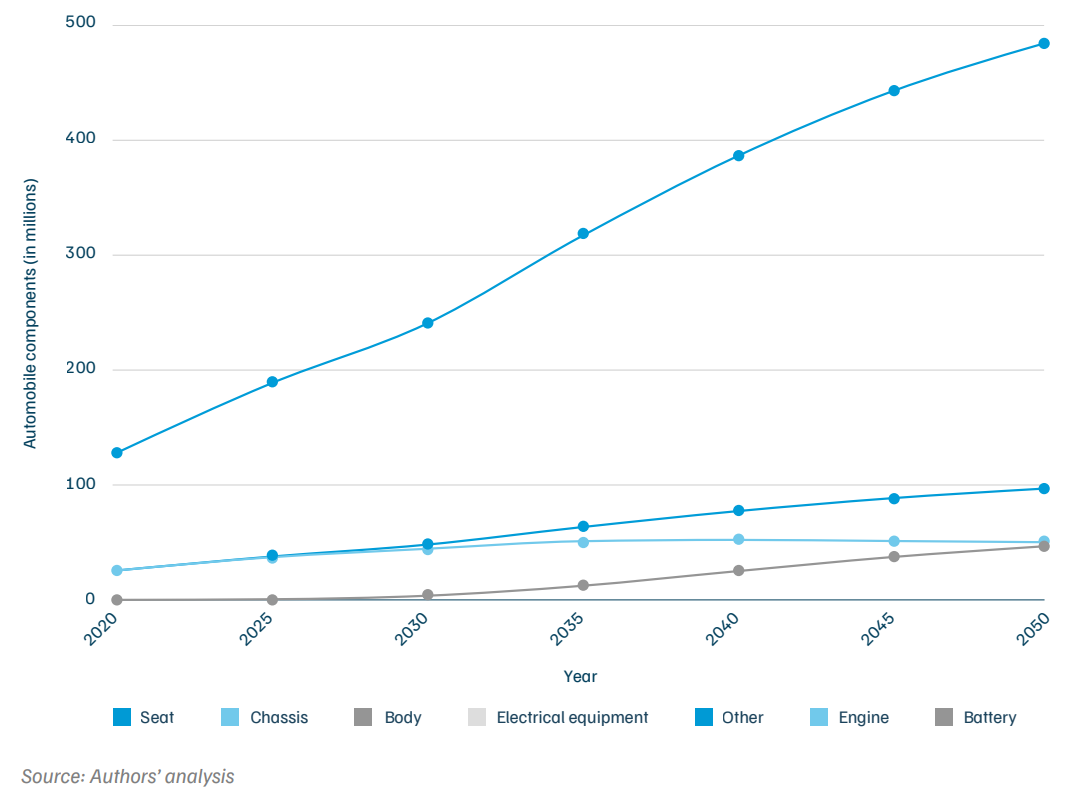
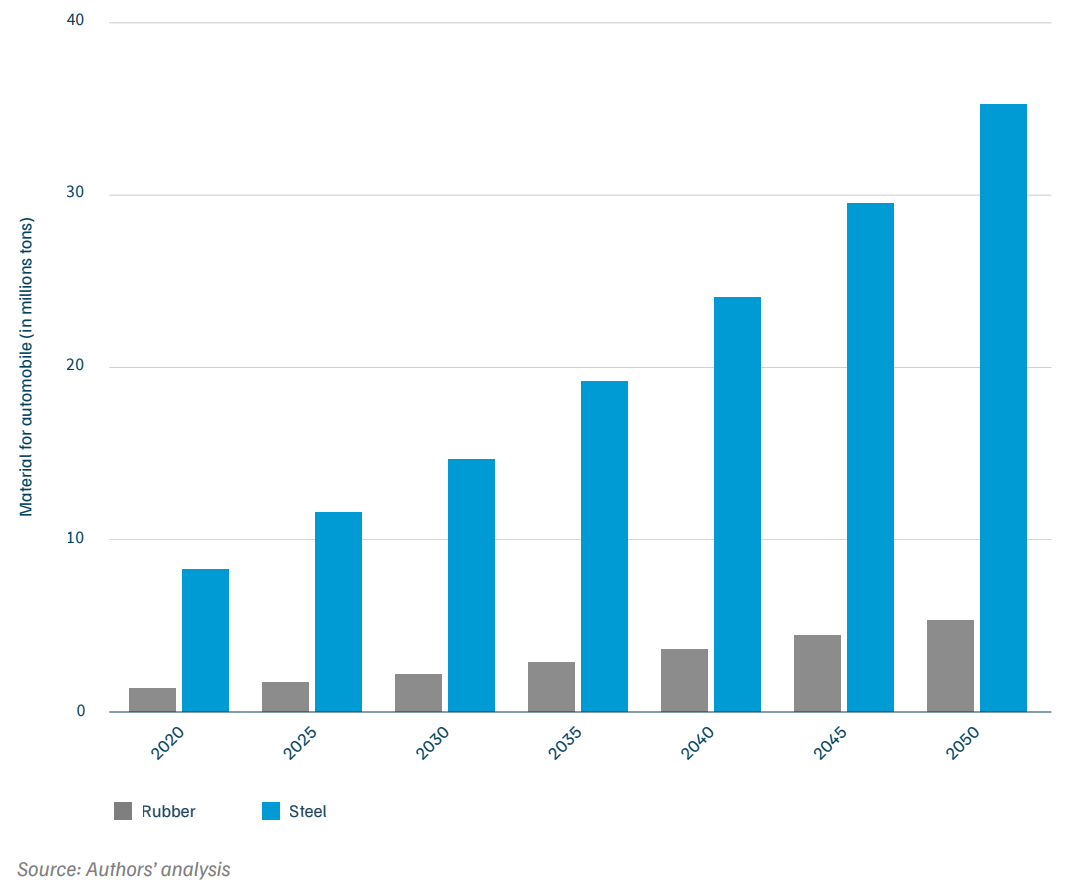
The demand for rubber in automobile manufacturing is expected to rise from 1.32 million tonnes per annum in 2020 to more than 5.2 million tonnes per annum by 2050. Similarly, steel required for automobiles would increase from 8.1 million tonnes to around 35 million tonnes by 2050,6 as shown in Figure 7.
Figure 7. By 2050, around 35 million tonnes of steel and 5.2 million tonnes of rubber will be required annually for vehicle manufacturing
Annual energy requirement of OEMs and component manufacturers is projected to grow manifold by 2050, with electricity dominating the energy mix
In 2020, OEMs used about 32.7 PJ of energy for manufacturing vehicles, with over 26 PJ (approximately 79 per cent) being electricity and the remaining being gas. By 2050, the annual energy consumption of OEMs would rise to 197 PJ, which represents a six fold increase. With efficiency improvements and a greater shift towards electricity, the share of electricity in OEMs’ energy mix is expected to increase from 78 per cent in 2020 to 93 per cent by 2050, as shown in Figure 8. As mentioned in section 2, in terms of vehicle segments, the energy used in manufacturing 4W was the highest at around 63 per cent. This share would grow to 89 per cent by 2050, driven by the manifold increase in production.
Figure 8. By 2050, under the BAU scenario, OEMs will require around 197 PJ of energy annually, and component manufacturers about 640 PJ
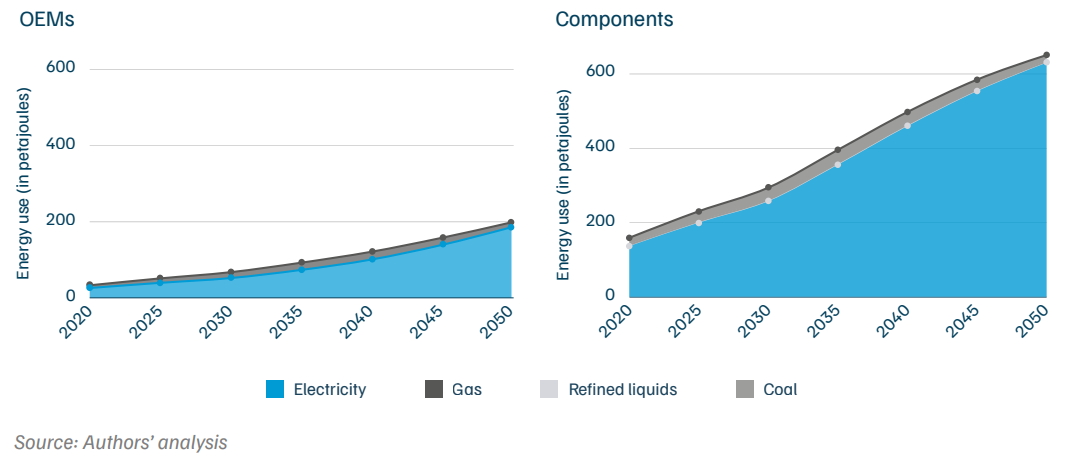
The annual energy consumption of parts and component suppliers is expected to increase from 156 PJ in 2020 to 640 PJ (representing a fourfold increase) by 2050. For parts and component manufacturers, electricity accounted for around 87 per cent of the energy mix in 2020, followed by gas at 12 per cent, with coal and refined liquids together accounting for less than 1 per cent.
By 2050, a total of 622 PJ of electricity would be required for manufacturing vehicle components. Of this, 245 PJ would be used in producing batteries, due to their higher energy intensity compared to other parts and components. The per-unit energy intensity of a battery is 5.8 GJ, whereas that of an engine is between 3.6–3.8 GJ. Therefore, manufacturing a battery requires 50 per cent more energy than manufacturing an engine.
Energy mix of rubber suppliers would be electricity dominated while that of steel suppliers would be coal dominated under BAU
In 2020, rubber suppliers used around 26.5 PJ of energy, with electricity accounting for 56.6 per cent, followed by gas at 25 per cent, refined liquids at 18 per cent, and the remainder from biomass, as shown in Figure 9. By 2050, producing 5.2 million tonnes of rubber (for automobiles) annually would require approximately 105 PJ of energy, almost a fourfold increase.
Figure 9. Coal accounts for majority share in steel suppliers’ energy mix while electricity dominates energy use for rubber suppliers
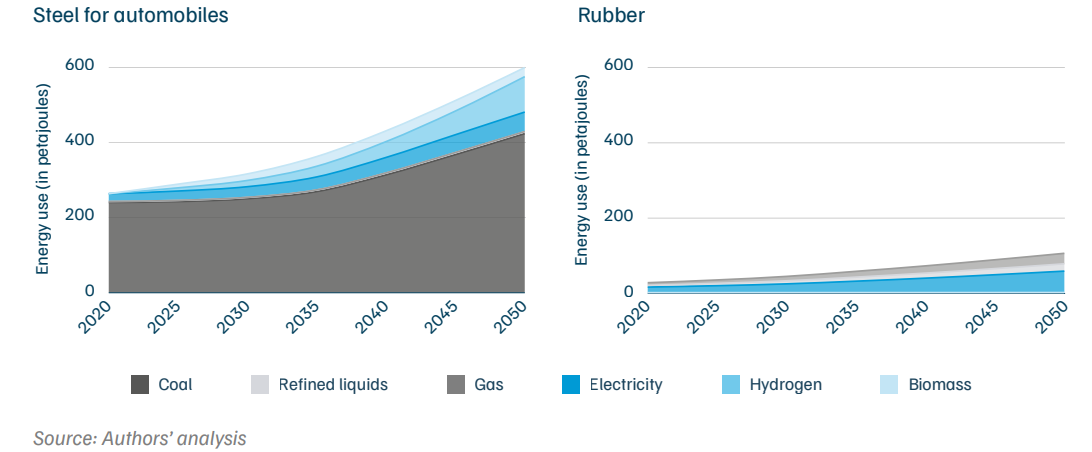
The majority of energy used in vehicle manufacturing and its supply chain comes from steel suppliers. Currently, the automotive sector accounts for 9 per cent of India’s total steel consumption (Ministry of Steel, GoI 2024). In 2020, around 8.1 million tonnes of steel was used for manufacturing vehicles, consuming almost 264 PJ of energy. Of this, over 90 per cent (240 PJ) was coal, followed by electricity (20 PJ), as shown in Figure 9.
By 2050, the annual energy consumption of steel suppliers for producing 35 million tonnes of steel for vehicles would increase to 599 PJ. More than 70 per cent of this energy would still come from coal, followed by 16 per cent from hydrogen. Electricity and biomass would account for 9 per cent and 4 per cent, respectively.
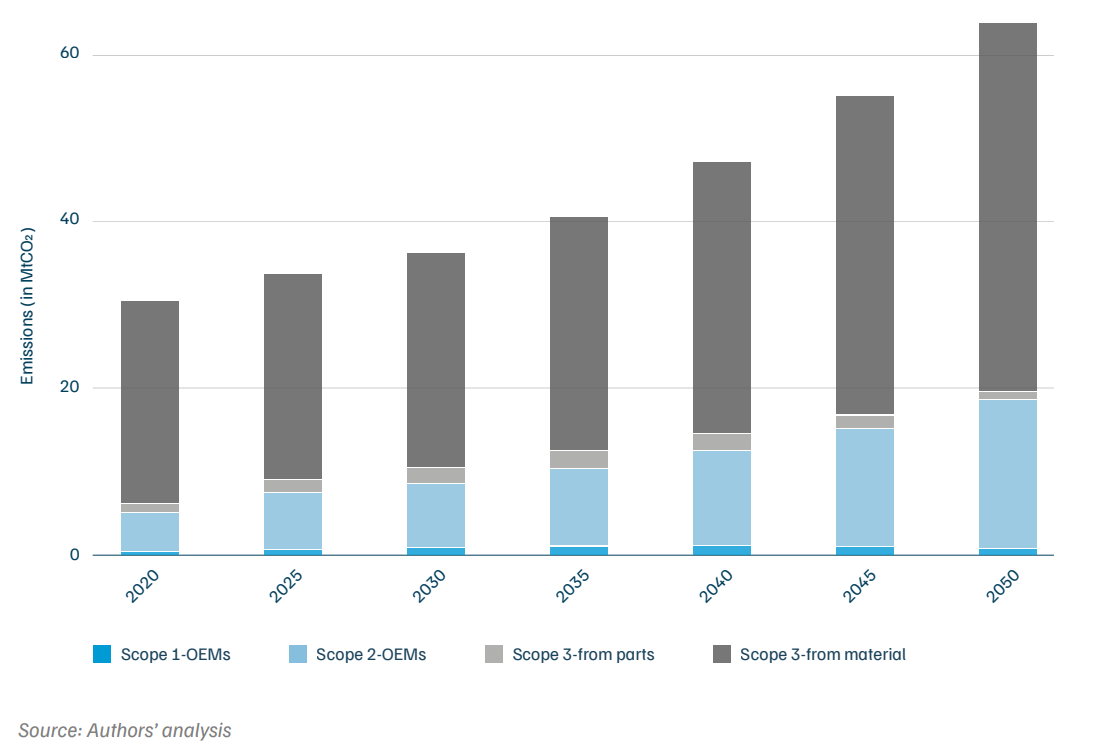
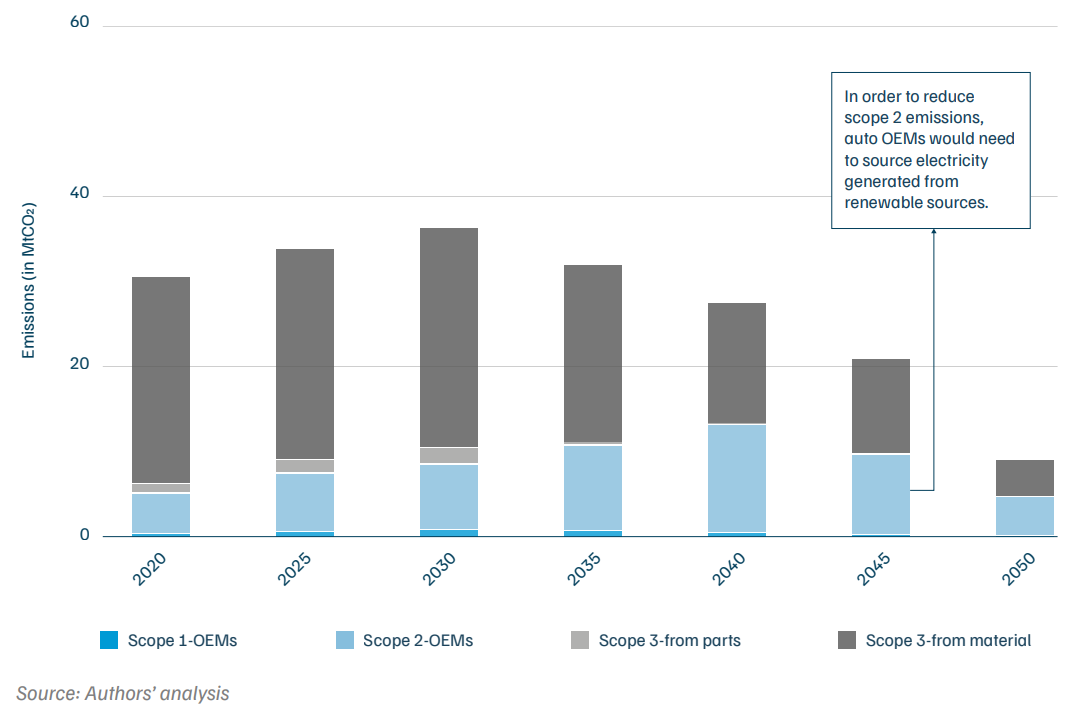
Under BAU, emissions from vehicle manufacturing would double by 2050
In 2020, vehicle manufacturing, including OEMs and their suppliers, emitted a total of 30.3 MtCO2, as shown in Figure 10. More than 83 per cent of these emissions were from manufacturing materials that are used in vehicles.
By 2050, annual emissions from OEMs and their suppliers are projected to nearly double, rising from 30.3 MtCO2 in 2020 to 63.7 MtCO2. Of these, 70 per cent would be through material suppliers (category 1, scope 3), and 28 per cent from the use of electricity by OEMs (scope 2). Among material suppliers, steel would account for the majority share, emitting 41.2 MtCO2 in 2050, which is 94 per cent of the material emissions.
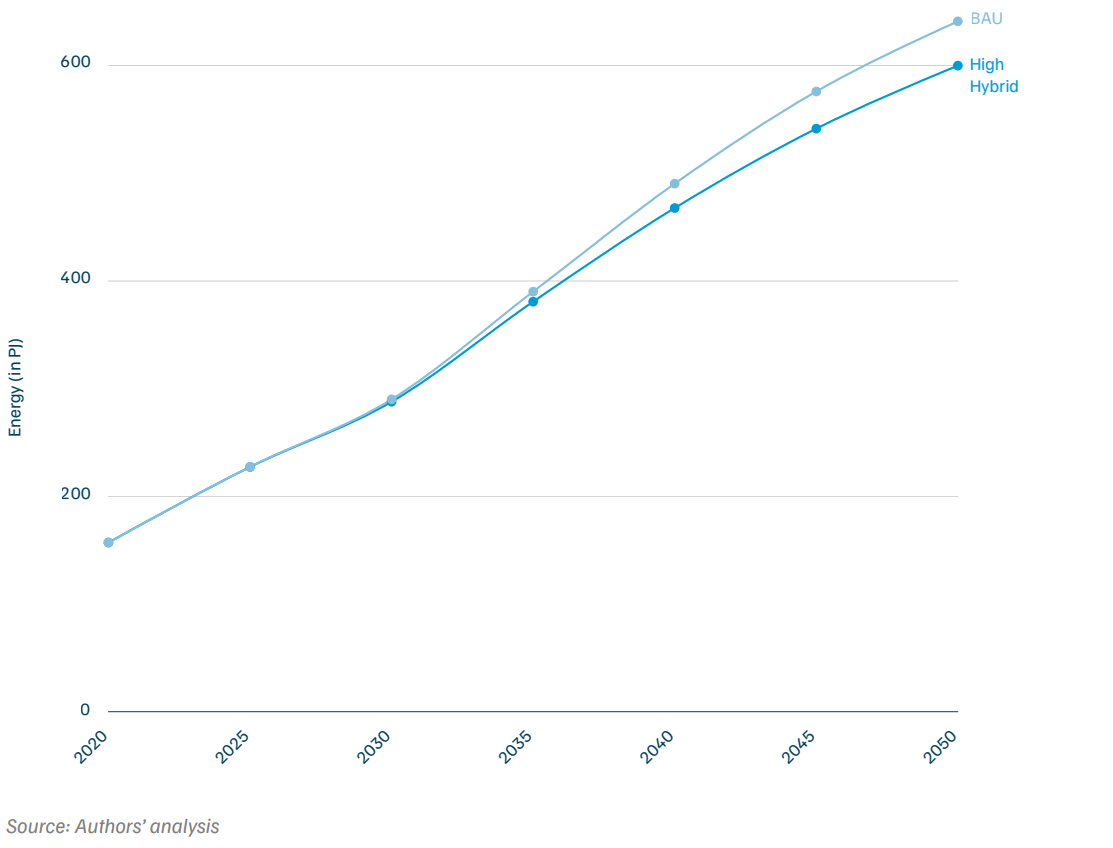
In order to explore what would change if Indian automakers produced hybrid vehicles instead of conventional ones, we constructed a high-hybrid vehicle scenario. This is largely similar to the BAU. The manufacturer has all options—ICEVs, EVs, and hybrid. However, by design, we assume a faster-growing share of hybrids in future.
Energy use of component manufacturers would be lower in the high-hybrid scenario
In a high-hybrid scenario, the energy consumption of only the component suppliers would change (direct energy use of OEMs and material suppliers remains largely similar), as shown in Figure 11. The annual energy consumption of component manufacturers would be 7 per cent lower in the high-hybrid scenario by 2050. However, since hybrid vehicles still have engines, we might see a slightly greater share of gas in the energy mix, leading to slightly higher emissions compared to the BAU, where electric vehicles were replacing ICEVs.
Figure 11. Energy use by component manufacturers is lower in the HH scenario compared to BAU; however, emissions are slightly higher due to a relatively higher share of gas
Given the rising energy use and emissions from vehicle manufacturing, the sector must bend its emissions curve to achieve net-zero. Under this scenario, we assess the implications if auto OEMs and upstream suppliers aim for a net-zero target by 2050.
In NZ scenario, electricity would continue to dominate energy use by OEMs and component manufacturers
Figure 12 illustrates the energy mix of OEMs in 2050 under the NZ scenario vis-à-vis the BAU. While electricity already accounts for the largest share in energy mix of auto OEMs in the BAU, this would increase to around 99 per cent by 2050 in the NZ scenario, while share of gas would decline to just 1 per cent.
Figure 12. Under the NZ scenario, electricity accounts for 99% of the energy used by auto OEMs, with minimal use of gas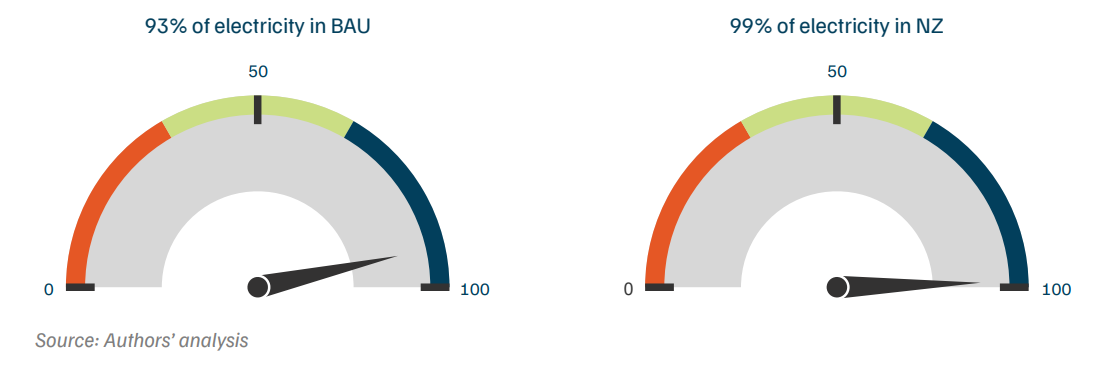
Similarly, as shown in Figure 13, electricity would make up for almost all the energy use by component manufacturers by 2050. This shift is driven by carbon pricing on the use of gas under the NZ scenario, and the transition from ICEVs to hybrid/EVs. Batteries have higher per-unit energy intensity, plus manufacturing batteries primarily uses electricity, whereas the production of engines requires some gas. With the shift towards electric vehicles, component manufacturers must scale up battery production, leading to higher electricity demand.
Figure 13. Electricity accounts for nearly all of the energy used by parts and component manufacturers under the NZ scenario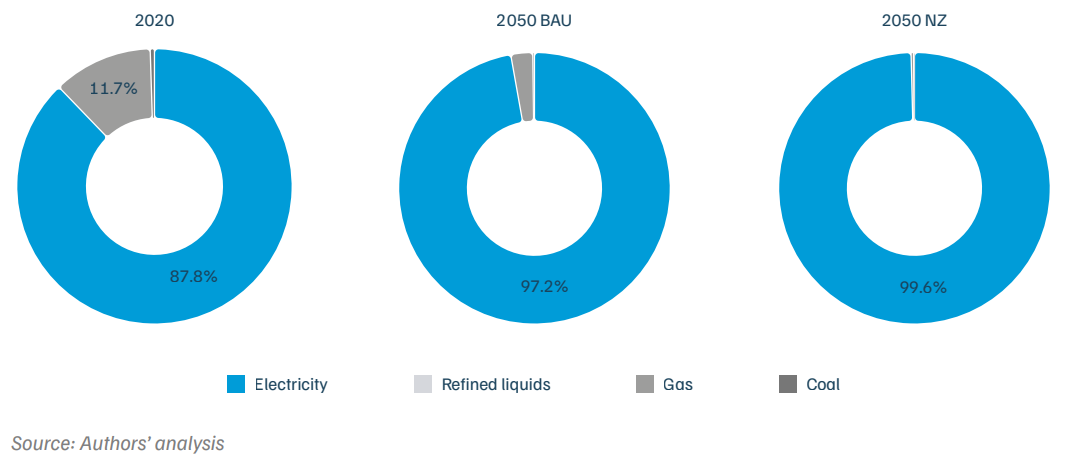 Under NZ scenario, energy mix of material suppliers would have to shift significantly towards electricity and hydrogen by 2050
The energy mix for rubber suppliers would see a substantial increase in the share of electricity. While, in the BAU scenario,7 electricity accounted for 56.4 per cent of the energy mix, in the NZ scenario, this would rise to nearly 99 per cent. Further, the use of refined liquids and gas is expected to decline after 2030, reaching nearly zero by 2050, as illustrated in Figure 14.
Figure 14. Under net zero, material suppliers to shift towards electricity and hydrogen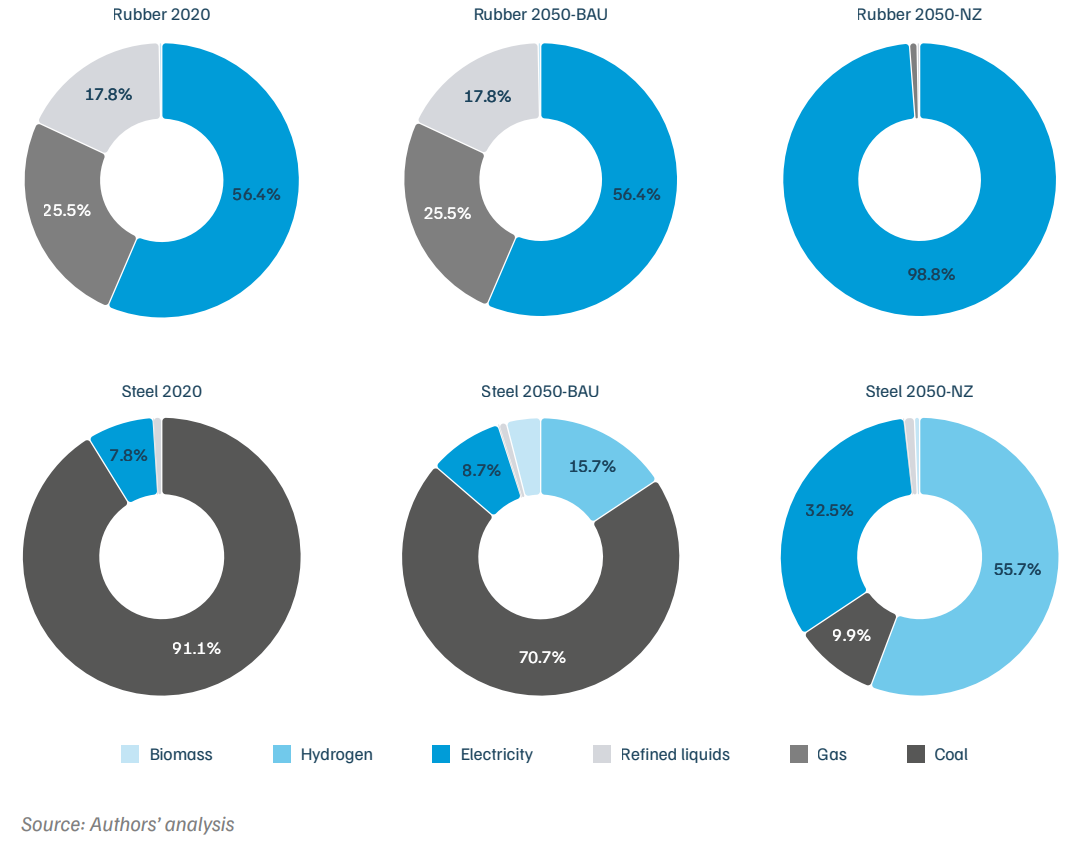
On the other hand, steel suppliers would transition from coal to hydrogen as shown in Figure 14. The share of coal would decrease sharply from over 70 per cent to less than 10 per cent, driven by stringent climate policy. Additionally, the share of electricity is expected to increase from 7.8 per cent to 32.5 per cent.
Annual emissions from vehicle manufacturing would drop to 9 MtCO2 by 2050 under the NZ scenario
Emissions from vehicle manufacturing and its supply chain are projected to decline significantly post-2030, as depicted in Figure 15. Under the NZ scenario, annual emissions would drop to nearly 9 MtCO2 by 2050, compared to 64 MtCO2 in the BAU, wherein, scope 3 emissions from rubber and steel suppliers are expected to see a drastic reduction. These emissions would decline nearly tenfold, from 45.2 MtCO2 in the BAU scenario to just 4.29 MtCO2.
However, it is important to note that scope 2 emissions of OEMs would be slightly higher between 2030 and 2040, given the shift from gas to electricity under the NZ scenario. Despite higher use of electricity, these emissions would be lower than those in the BAU post-2040, as the grid also begins to decarbonise in line with India’s economy wide 2070 net-zero target. Scope 2 emissions are currently based on grid emission factors. Therefore, in order to achieve full decarbonisation, auto OEMs would have to reduce their scope 2 emissions (from the use of electricity) as shown in Figure 15.
Figure 15. Annual emissions from vehicle manufacturing in 2050 are expected to drop to 9 MtCO2, with a drastic reduction in Scope 3 emissions from rubber and steel suppliers
Fuel and material prices would increase under the 2050 net-zero scenario
In the NZ scenario, higher electricity demand across end-use sectors would lead to an increase in electricity prices for industry, particularly after 2040. On average, electricity prices are projected to be around 3–5 per cent higher between 2040 and 2050 as compared to the BAU. For OEMs, this means higher costs, as their energy mix increasingly relies on electricity.
Similarly, material suppliers would also face higher prices for electricity and hydrogen under the NZ scenario. Moreover, in order to reach net-zero, including the upstream scope 3 emissions, wherein carbon capture and storage (CCS) technology is not commercially available, the share of steel produced (for vehicles) by recycling scrap would have to be scaled up significantly to around 48 per cent by 2050. Additionally, steel, as a hard-to-abate sector, would have to opt for high-cost mitigation options that rely on hydrogen, and ultimately, the cost of production would increase. As a result, cost of producing steel could be about 56 per cent higher between 2030 and 2050 as compared to the BAU scenario. This would, in turn, impact the cost of raw materials for vehicle manufacturing.
Also, as steel suppliers transition to hydrogen and electricity, the cost of producing near-zerocarbon steel would be around 56 per cent higher between 2035 and 2050 vis-à-vis the BAU. This will lead to an increase in the steel prices at which auto OEMs purchase. Ben m’barek et al (2022) find that the cost of steel production in India is around INR 46–47 per kg (around 630$ per ton). The auto OEMs get it at INR 80 per kg. However, under NZ, this price would be 33–34 per cent higher. This will, in turn, increase OEMs’ cost of production. After factoring in the steel used per vehicle, the premium for using near-zero-carbo
Since it is relatively hard to decarbonise upstream suppliers such as steel and component manufacturers and to reduce scope 3 emissions, we constructed an alternate net-zero scenario. Under this, upstream suppliers follow India’s economy wide 2070 net-zero target instead of a sector-specific 2050 target, while only auto OEMs aim to achieve net-zero by 2050, covering their scope 1 and 2 emissions. In this section, we explore how this differs from the NZ 2050 and BAU scenarios.
Under A-NZ, emissions from vehicle manufacturing would start declining post 2040
In this scenario, the emissions for automobile manufacturing and its supply chain would peak in 2040, and then start to decline. However, by 2050, although the emissions would be lower compared to the BAU scenario, they would still be at 36.6 MtCO2, with around 83 per cent coming from manufacturing steel used in vehicles. Figure 16 shows the emissions trajectory under an alternate scenario and the drop in emissions that would occur relative to the BAU.
Figure 16. Under A-NZ, emissions from vehicle manufacturing drop to 36.6 MtCO₂ by 2050; however, this remains higher than in the net-zero scenario
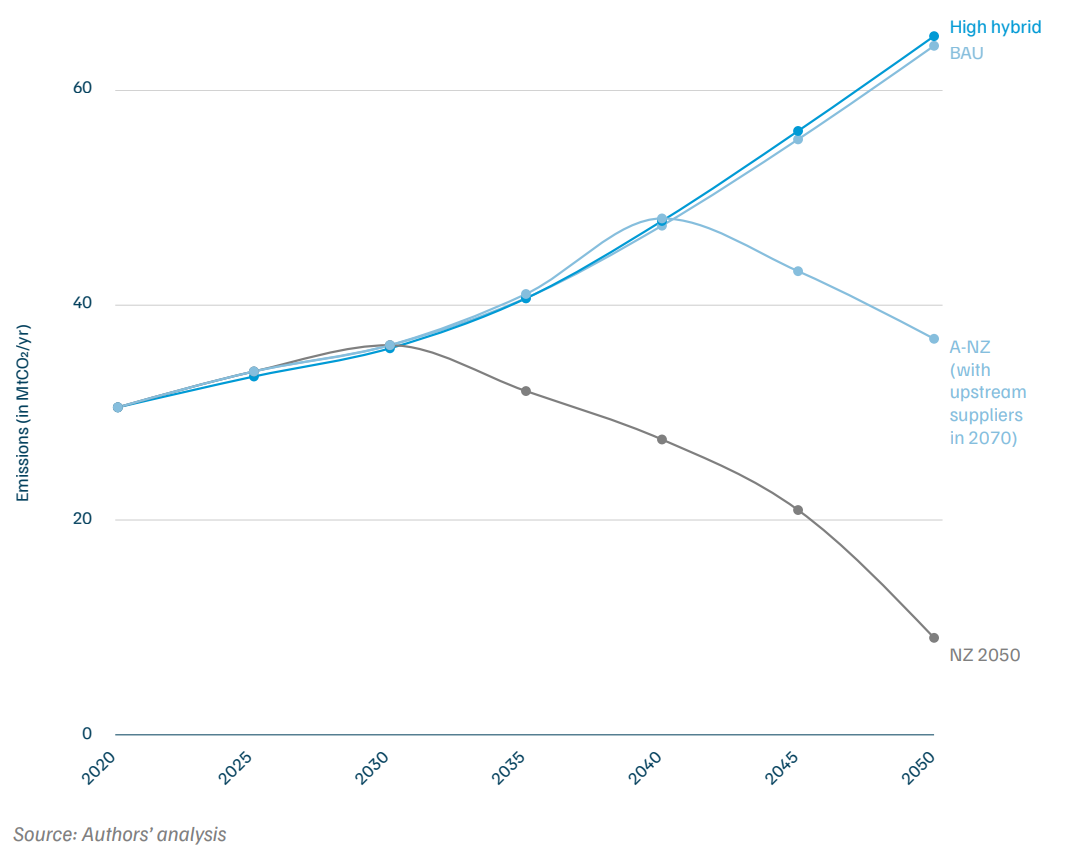
Additionally, emissions under the A-NZ scenario would be slightly higher between 2030 and 2040, as shown in Figure ES1. This is because scope 2 emissions of auto OEMs follow a similar trend as the grid emission factor, since they are sourcing electricity from the grid. Moreover, auto OEMs would use more electricity under a net-zero scenario. Therefore, in total, scope 2 emissions are slightly higher during this period. These will start declining post the power sector peak in 2040, when the average grid factor also starts to reduce.
In the BAU scenario, scope 3 emissions would be around 45 MtCO2 in 2050. Under A-NZ, where upstream suppliers follow the economy wide Indian net-zero target of 2070, scope 3 emissions would be reduced to 32 MtCO2, which means an emissions reduction of only 13 MtCO2 in comparison to the BAU. The lack of a sector-specific net-zero target for upstream suppliers by 2050 results in a more gradual emissions reduction trajectory.
Significant differences in the energy mix of steel suppliers under the two net-zero scenarios
Figure 17 demonstrates these differences by comparing the energy mix for steel suppliers under the two scenarios against the BAU. In the A-NZ scenario, while coal’s share is lower than in the BAU, it would still make up for more than 60 per cent of the energy mix. This is in contrast to the NZ scenario, where steel suppliers are also aiming for net-zero by 2050, in which hydrogen becomes the dominant energy source.
Additionally, the share of electricity in the energy mix is higher in the alternate scenario compared to the BAU, but remains lower than in the 2050 net-zero scenario. This is because high carbon prices encourage the faster adoption of technologies that rely on hydrogen. However, under the economy wide 2070 target, carbon prices rise more gradually, and thus, the share of hydrogen in the steel energy mix only increases substantially toward the years closer to 2070. Consequently, the cost of producing steel could be around 37–38 per cent higher on average than the BAU between 2040 and 2050, less pronounced compared to the 56 per cent increase under NZ 2050.
Figure 17. Under alternative net-zero scenario, coal would still account for the largest share of energy used by steel suppliers in 2050
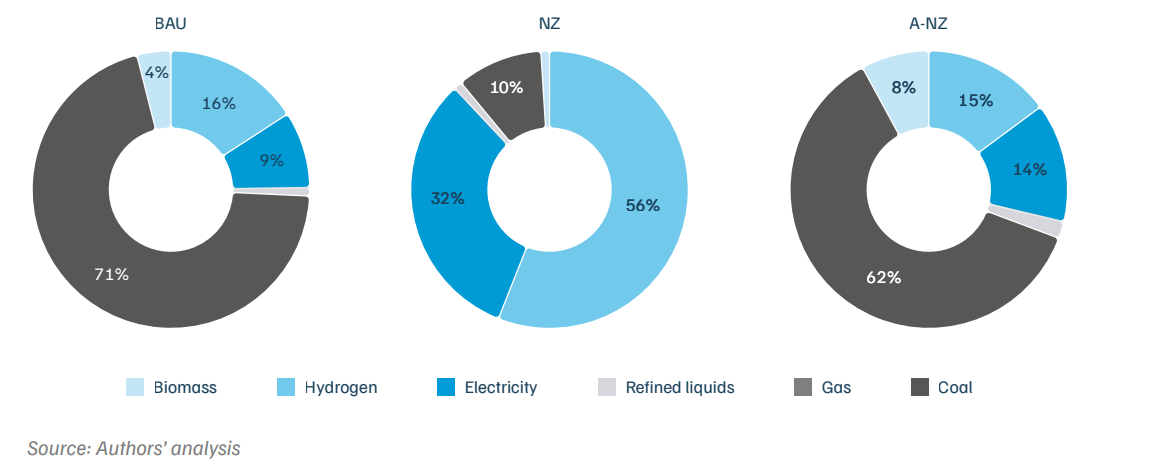
Figure 18. Energy mix of rubber suppliers shifts towards electricity under alternative net-zero scenarios, although it would remain lower compared to sector-specific net zero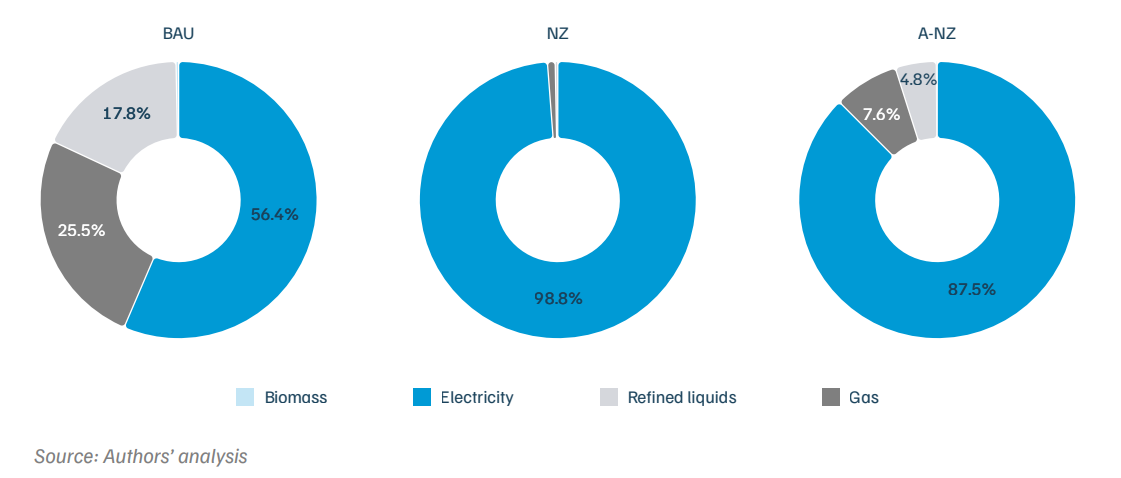
Similarly, as shown in Figure 18, gas and refined liquids account for a higher share in the energy mix of rubber suppliers in the A-NZ scenario vis-a-vis the NZ 2050. In essence, while emissions are reduced compared to the BAU, the overall effort falls short of achieving full decarbonisation in the automobile manufacturing supply chain by 2050. Additionally, it highlights the need for understanding and aligning the decarbonisation timelines of critical upstream suppliers, like the steel industry, with the more ambitious climate goals set by the automobile sector.
Given the contribution of vehicle production to India’s economy, the auto industry plays an important role in shaping the nation’s industrial landscape. As the auto sector moves towards low-carbon vehicles, in line with the global efforts to decarbonise transport, understanding energy use in manufacturing vehicles and emission patterns is necessary.
Leading OEMs are already setting targets to cut emissions and support decarbonisation. For instance, Mahindra & Mahindra, under the SBTi, aims to reduce scope 1 and 2 emissions by 47 per cent, and scope 3 emissions by 30 per cent, by 2033, using 2018 as base year. The SBTi helps companies create clear and achievable plans to lower their greenhouse gas emissions, in line with the goals of the Paris Agreement. Over 6,000 businesses worldwide are now part of SBTi, benefitting from structured pathways to minimise their environmental impact and ensure sustainable growth (SBTi n.d.).
Similarly, Tata Motors also targets a 46 per cent reduction in scope 1 and 2 emissions by FY2030, and a 54 per cent cut in scope 3 emissions (Tata Motors, 2024.). Component makers like JK Tyres are also committing to significant reductions in scope 1, 2, and 3 emissions by 2035 (SBTi n.d.). If the sector aims to achieve net-zero by 2050, it is important to understand emissions from manufacturing and supply chain, and figure out ways to reduce these emissions.
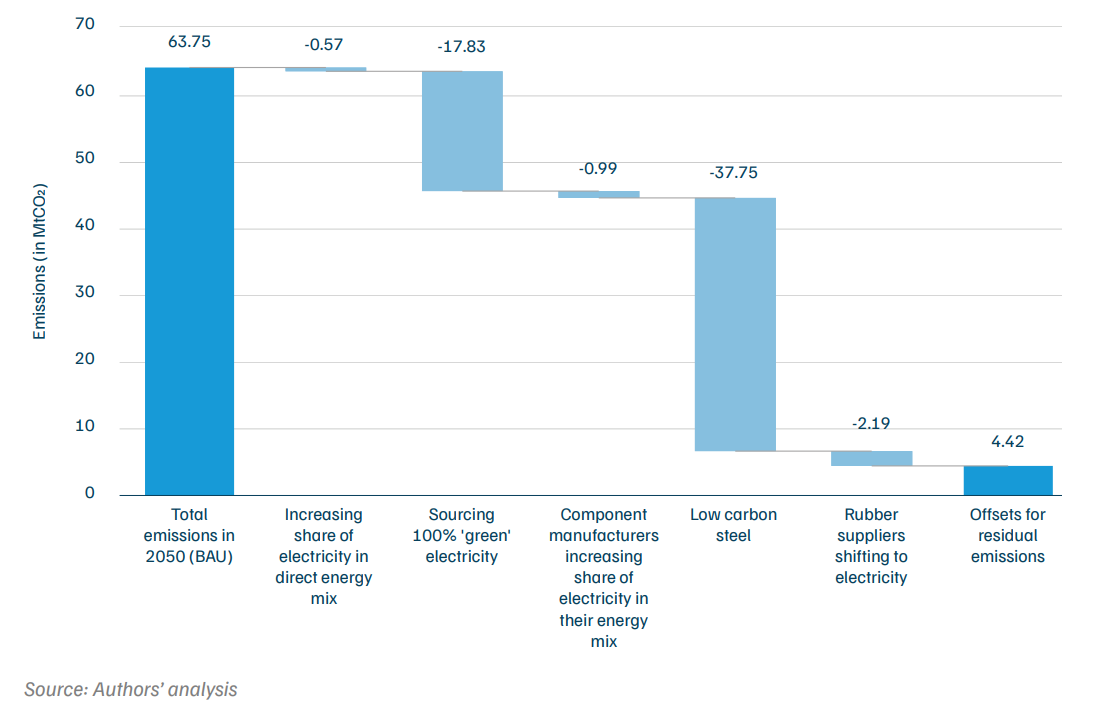
In this section, we present key recommendations based on the modelling assessment to help the sector develop a strategic roadmap toward net-zero for the automobile industry. Figure ES1 presents a break-up of total emissions reduction under the NZ scenario that could be achieved from each of the recommendations across scope 1, 2, and 3.
As discussed above, scope 2 emissions account for more than 50 per cent of the residual emissions in the NZ scenario by 2050, that is around 4.5 MtCO2. Therefore, as auto OEMs largely rely on electricity in their energy mix, they will need to make efforts to reduce these indirect emissions from purchased electricity. For this, automakers need to start sourcing electricity generated from renewable sources. As shown in Figure ES1, if OEMs start sourcing all of their electricity from renewables, they could achieve an annual emissions reduction of over 17 MtCO2 by 2050.
There are two main ways to secure renewable electricity. One is through open access power purchase, best suited for large industrial and commercial buyers who want to purchase electricity directly from the generator at a relatively lower price. Under this arrangement, customers pay directly to the generator under a long-term PPA (Jacob and Garg 2024). The other way is to invest in captive renewable power, for example, investing in an on-site solar or wind farm that generates clean energy for a facility’s own use. For instance, Maruti Suzuki is increasingly investing in captive solar power and installing solar plants at its production facilities, planning to meet over 30 per cent of its electricity needs through renewable energy by FY2024–25 (Maruti Suzuki 2023). Along with this, OEMs can also explore RECs to further complement their efforts in sourcing electricity generated form renewables.
Earlier, PPAs were mostly signed between electricity generators and utilities. However, as more and more industries are focussing on decarbonising their production processes, PPAs are commonly being used to obtain renewable energy (Gulia et al. 2022). Automobile OEMs can also consider entering into such long-term agreements to ensure a reliable and clean electricity supply.
Leading automobile manufacturers, both globally and in India, are already making efforts to scale up the share of renewables in their energy mix. For instance, Mahindra & Mahindra sources almost 26 per cent of its total electricity consumed in FY2023 from renewables, and is committed to increase it to 100 per cent by 2030 (Mahindra 2023).
Ford Motors aims for 100 per cent carbon-free electricity globally in all its manufacturing facilities by 2035 (Door and Wroten 2024), and is increasingly investing in renewables. Similarly, in order to cut down on scope 2 emissions, General Motors is also targeting sourcing clean electricity throughout all its facilities around the world by 2035 (General Motors n.d.). Additionally, many automakers like General Motors, KIA, and TATA Motors are also part of the RE100 initiative—a group of companies committed to 100 per cent renewable electricity (RE100 n.d.).
For achieving emissions reduction, collaboration is crucial between OEMs and their component and material suppliers. Conducting detailed emissions assessments jointly with key suppliers will help in identifying processes that are energy and carbon-intensive, like batteries, engines, steel, and rubber. Given that a majority of the emissions in vehicle manufacturing are through upstream supply chain, Figure ES1 shows that an emission reduction of more than 3 MtCO2 can be achieved annually by 2050 if component and rubber suppliers shift to electricity.
Working closely with upstream producers before preparing mitigation strategies will help auto OEMs align their investment decisions (Montermini and Hernandez 2024). This will, in turn, help auto manufacturing companies to set clear, science-based targets for scope 3 emissions, aligned with the industry’s overall net-zero goals.
Along with better target setting, joint efforts will also allow both automobile manufacturers and their suppliers to focus and collaborate on key areas where innovation has the potential to drive down emissions—for example, research on lighter materials, or low-carbon battery technologies. This will also ensure that decarbonisation extends throughout the entire supply chain.
It is expected that the annual vehicle production would triple by 2050, and the demand for components, rubber, and steel would rise alongside. This would increase the demand for energy required for manufacturing. Steel for automobiles is set to remain the largest source of emissions in the supply chain, as its energy mix is dominated by coal. Hence, in order to achieve net-zero by 2050, it would be crucial for OEMs to source low-carbon steel, which could help cut annual emissions by around 38 MtCO2, as shown in Figure ES1.
One way to decarbonise the steel produced for automobiles is to increase the share of scrap used in its production. This reduces the energy requirement of upstream suppliers, thereby cutting down emissions (Nicholas and Basirat 2021). As notified by the environment ministry, as per the new Extended Producer responsibility, starting in April 2025, Indian auto-makers will have to recycle 8 per cent of the steel that was used in manufacturing automobiles in 2005–06, and this share will be increased to 18 per cent by 2035–36 (ET Auto 2025).
Currently, the steel that is used for vehicle manufacturing contains about 15–20 per cent scrap. Switching to electric arc furnace (EAF) technology, which relies on recycled steel, can be an effective way of increasing its use (World Economic Forum 2023).
Our modelling results suggest that by 2050, the annual steel requirement for manufacturing vehicles would be around 35 million tonnes. Moreover, for achieving net-zero, including the upstream scope 3 emissions, wherein CCS technology is not commercially feasible at scale, the share of steel produced by recycling scrap would have to be scaled up significantly to around 48 per cent by 2050. Industry leaders such as Volvo, BMW, Mercedes-Benz, and others are already making plans to significantly increase their use of recycled steel by 2030 (N. Hill et al. 2024). Similarly, leading automobile OEMs in India, such as Mahindra & Mahindra, Maruti Suzuki, and Tata are also establishing vehicle scrapping facilities (Majumder 2021). These scrap centres will dismantle and recycle vehicles while recovering materials that can be reused. While 80–90 per cent of steel is recycled, majority of it is down-cycled, meaning it cannot be used for highvalue applications such as automotive-grade steel (World Economic Forum 2023). Hence, by increasing demand for high-quality scrap, the auto industry can, in turn, incentivise supply side improvements in scrap collection, sorting, and upgrading, etc.
Given that steel makes up for almost 65 per cent of vehicle weight (Hu and Feng 2021) and conventional steel is carbon-intensive, sourcing low-carbon steel is a key step for the Indian auto sector to achieve net-zero by 2050. Automobile manufacturers need to procure ‘green’ steel in order to reduce the carbon footprint of their manufacturing processes.
Under a sector-specific net-zero scenario, along with increasing the share of scrap-based steel production, the share of hydrogen in the energy mix would also be necessary. As per our modelling assessment, in the NZ scenario, around 205 PJ, or approximately 1.71 MMTPA of hydrogen, would be used to produce steel for vehicles. Interestingly, this is almost 20 per cent of India’s current hydrogen consumption.
These shifts will, in turn, mean a higher cost of manufacturing. Assuming that it is possible to absorb some of this cost increase from near-zero-carbon steel, OEMs can consider sourcing steel through Advanced Market Commitments (AMCs). By guaranteeing a market for new products, AMCs reduce the financial risk associated with innovation, thereby encouraging private sector investment (Gangotra et al. 2023). These are particularly effective in sectors like climate technology, autonomous vehicles, and advanced computing, where long-term development and high upfront costs make traditional market mechanisms less viable.
Such AMCs will therefore allow auto manufacturers to commit early purchases at specified prices, volumes, and timelines, thus creating strong demand signals for low-carbon steel (D. Hill 2023). This approach helps in establishing market certainty, and channel investments to emerging technologies by reducing risks of no or limited demand in future. This arrangement will ensure steel suppliers with a ready market that awaits ‘green’ steel.
As discussed above, a large part of emissions in vehicle manufacturing comes from purchased electricity and materials like rubber and steel, which are indirect scope 2 and 3 emissions. Therefore, in order to go net-zero by 2050, decarbonising the upstream supply chain of auto OEMs will be of key importance. However, this will happen gradually, and doing this for the entire supply chain will take time, requiring investments, technological innovations, and strong policy support.
Given this, carbon offsets can be used to address any residual emissions that are hard to eliminate. These allow companies to buy carbon credits by supporting emission reduction elsewhere, given that it is not feasible to mitigate these residual emissions in-house (Lawton 2023). Each carbon credit represents one tonne of CO2. Also, the cost of mitigation will depend on the price of offsets in the carbon market, which varies based on project type, location etc. Some of the leading carmakers, fossil-fuel producers, and tech firms across the world are using carbon offsets to support their decarbonisation efforts. For example, between 2020 and 2022, just 34 companies worldwide purchased offsets, amounting to almost 38 million tonnes of carbon dioxide (MtCO2) (Gabbatiss 2023).
The OEMs can, therefore, use offsets to address any residual emissions. They can buy offset credits in the voluntary carbon market by investing in high-quality offset projects—such as renewable energy, forest conservation, or carbon capture initiatives. But, it is important to note that offsets should complement direct emissions reduction efforts, rather than replace them.
Battery production is an energy intensive process, although it majorly requires electricity. However, by under the BAU, annual scope 2 emissions of battery manufacturers will be more than 23 MtCO2 (although this is outside of the system boundary in this analysis). Therefore, the recycling of batteries will be very important in decarbonising the supply chain of electric vehicles.
When viewed across the entire lifecycle of vehicles, emissions from EVs are relatively small due to no emissions in the vehicle use phase (Linder et al. 2024). However, batteries account for almost 60 per cent of the embedded emissions in vehicle production.
While the industry is working to address environmental and social impacts of mining, many battery manufacturers around the world are also working towards alternative cell chemistries. However, given that the share of low-carbon vehicles would increase manifold, the number of batteries required for vehicles will increase at the same pace. Hence, the industry needs to address the embedded carbon emissions. Battery recycling is an essential strategy to further decarbonise the supply chain under an EV-focussed scenario. As batteries can last many years, and up to 95 per cent of the materials, including lithium, nickel, cobalt, and manganese, can be recovered, they can be repurposed for other uses as well once they reach the end of their useful life in vehicles (Stefanovic 2023). This approach, thus, lowers the carbon footprint of battery production.
The automobile industry’s journey to net-zero emissions by 2050 will require a mix of different strategies. While a lot of progress and efforts are being made for tailpipe emissions—emissions when vehicles are in use—OEMs should now also focus on emissions from manufacturing. Moreover, the sector must address not just manufacturing processes, but also emissions from their upstream suppliers.
The majority of emissions in vehicle manufacturing are indirect; that is, emissions from purchased electricity and steel used in vehicles. Hence, if Indian automobile OEMs want to target 2050 for net-zero, they need to focus on shifting to 100 per cent renewable energy, sourcing green steel, and fostering partnerships with suppliers to cut emissions. An ambitious automobile sector would pave the way for many other sectors to accelerate ambition, transition to a net-zero future, and contribute to India’s long-standing global climate leadership.
Identifying industrial processes and underlying materials that significantly contribute to carbon emissions throughout product supply chains is crucial. Strategies such as sourcing green steel, component decarbonisation, and battery recycling can help the automobile industry, but similar approach must extend to industries that drive demand for materials such as steel, cement, and aluminium. This would not only help to decarbonise individual sectors, but also create a ready market for low-carbon materials. Businesses can accelerate the net-zero transition by making well-informed investment decisions, by evaluating cross-sectoral synergies through such longterm assessments.
The Science Based Targets initiative (SBTi) is an organisation that enables companies and financial institutions to set greenhouse gas (GHG) emissions reduction targets that are in line with the latest climate science. The goal is to help limit global warming to 1.5°C. SBTi helps in developing standards, tools, and guidance that allow businesses to align their decarbonization efforts with scientific climate goals. Over 7,000 companies globally, including many leading automobile manufacturers, have already set emissions reduction targets through the SBTi. As per the SBTi’s Corporate Net-Zero Standard, businesses are required to reduce all possible emissions across their operations and value chains to reach net-zero by 2050.
India is the third-largest automobile market in the world and produced 28.43 million vehicles in FY 2023–24. The country ranks second in two-wheeler production, sixth in passenger vehicle production, and leads in tractor manufacturing globally With rising income levels and growing mobility demand, India’s automobile manufacturing is expected to expand significantly. Our analysis projects that annual vehicle production in India will increase 3.7 times between 2020 and 2050, reaching over 96 million vehicles by 2050.Within this growth, passenger car production is expected to increase nearly ninefold.
Advanced Market Commitments (AMCs) are policy tools that help create demand certainty for emerging technologies by guaranteeing future markets. By committing to purchase new products at predetermined prices, volumes, and timelines, AMCs reduce the risks associated with innovation and help unlock private investment. In the context of the automobile sector, AMCs can be particularly effective in promoting the use of low-carbon materials, such as green steel. For example, auto manufacturers can commit to early purchases of green steel, sending strong demand signals to steel suppliers and incentivizing them to invest in clean production technologies.
How can Carbon Markets Scale Durable Carbon Dioxide Removal in India?
Sustainable rice cultivation in India
EU Carbon Border Adjustment Mechanism
Roadmap for a Net-Zero Power Sector in Gujarat