Council on Energy, Environment and Water Integrated | International | Independent
Suggested Citation: Kumar Jha, Ayush, Prateek Aggarwal, Richik Bandyopadhyay, Disha Agarwal, and Shalu Agrawal. Solarising Agricultural Power Demand by 2030: Financial, Social, and Environmental Gains for Discoms and State Governments. New Delhi, India: Council on Energy, Environment and Water (CEEW).
India's 13 major agrarian states spent over INR 1.3 lakh crore on farm power subsidies in FY 2025, with agricultural electricity demand having grown 87% over the past decade and set to rise further through 2030. This study evaluates four pathways of agricultural solarisation — at 25%, 50%, 75%, and 100% of projected demand — assessing fiscal, tariff, environmental, and employment outcomes for each state.
The analysis shows that supplying farm power through decentralised solar at INR 3–3.5 per kWh, against conventional grid procurement costs of INR 4.5–5.9 per kWh, can structurally lower the cost of serving agricultural feeders. Full solarisation of projected agricultural demand across the 13 states by 2030 would require approximately 191 GW of decentralised solar capacity and could reduce cumulative state subsidy obligations by over INR 3 lakh crore, ease cross-subsidy pressure on commercial and industrial consumers, cut annual emissions by ~160 MtCO₂e, and support ~8 lakh full-time equivalent jobs.
Key Highlights
Agricultural electricity: a growing fiscal obligation
For decades, most Indian states have provided free or heavily subsidised electricity to agricultural consumers. This support has strengthened the livelihoods of millions of farmers and reinforced food security in India, delivering substantial social and economic benefits. However, the existing financing mechanism is now placing increasing pressure on state budgets and the viability of the power sector.
Agriculture accounts for nearly one-fifth of India’s total electricity consumption. The 13 major agrarian states, representing 99 per cent of national agricultural electricity sales, recorded annual farm power subsidies exceeding INR 1.3 lakh crore in financial year (FY) 2025. In several states, this amounted to 4–6 per cent of annual budgets. Agricultural electricity demand has grown by nearly 87 per cent over the past decade (FY 2015–24) and is projected to rise further (MOSPI 2025). The fiscal challenge is driven not only by the scale of subsidies but also by the underlying cost structure.
Agricultural power tariffs remain far below cost, or zero, requiring the gap to be bridged through direct state subsidies and cross-subsidies from commercial and industrial (C&I) consumers. In Maharashtra, for example, commercial consumers pay 50–70 per cent above the average cost of supply, while agricultural consumers pay 43 per cent below it (FY 2024) (Purohit et al. 2025). Industrial tariffs in India (INR 8–10 per kWh) remain higher than those in the United States (INR 5–7 per kWh) (CSEP 2022), raising concerns about competitiveness.
Even when states commit to compensating discoms for revenue gaps, delays in subsidy disbursement routinely strain working capital (Agrawal et al. 2023). This crowds out investment in network strengthening, ultimately undermining supply quality and reliability. As states rationalise cross-subsidies and align tariffs with costof-supply trajectories, a growing share of this burden is shifting directly onto state budgets. Without structural correction, rising demand and procurement costs will significantly increase fiscal exposure by 2030.
Solarisation changes both the cost structure and the energy source
Agricultural solarisation under the Pradhan Mantri Kisan Urja Suraksha Evam Utthan Mahabhiyan Yojana (PMKUSUM) and allied state initiatives is underway across several states. As of January 2026, approximately 765 MW of decentralised grid-connected solar capacity has been established against a target of 10,000 MW. Further, only around 13 lakh grid-connected agricultural pumps have been solarised out of a total target of 35 lakh. Together, this represents progress of 8 per cent and 37 per cent, respectively (MNRE 2024, 2026). While the policy architecture is clearly in place, current deployment remains modest relative to the scale of agricultural electricity demand.
Solarisation provides states with the opportunity to meet agricultural demand at a lower cost. In FY 2024–25, the average power procurement cost (APPC) across the analysed states was INR 4.5–5.9 per kWh (excluding transmission cost). By contrast, decentralised solar power is available at INR 3–3.5 per kWh, nearly 30–40 per cent lower. In states where feeder segregation is complete and irrigation demand aligns with daytime hours, solar can directly substitute a higher-cost grid supply.
By lowering the cost of supply at source, agricultural solarisation narrows the persistent average cost of the supply–aggregate revenue requirement (ACoS–ARR) gap that underpins discom losses. It also reduces the reliance on cross-subsidies from C&I consumers and moderates fiscal pressure on state governments.
Scope of the analysis
This brief evaluates four solarisation pathways–25, 50, 75, and 100 per cent of projected agricultural electricity demand by 2030–across 13 states, using demand projections from the Central Electricity Authority’s (CEA) 20th Electric Power Survey (CEA 2022). The year 2030 aligns with national climate commitments and ongoing resource adequacy planning cycles. Our analysis shows that large-scale agricultural solarisation can materially alter fiscal and distribution trajectories.
What large-scale agricultural solarisation can deliver by 2030
Complete (100 per cent) solarisation of projected agricultural demand across the 13 states would require approximately 191 GW of decentralised solar capacity by 2030. At this scale, our analysis indicates substantial fiscal, tariff, and system-level gains:
Even partial adoption would generate proportionate gains. At 25–50 per cent solarisation, states can realise meaningful fiscal savings while limiting upfront capital requirements.
These outcomes vary across states. Benefits scale with the size of the agricultural load, procurement cost, feeder segregation status, and alignment of irrigation demand with solar hours. We therefore present comparable statelevel trajectories alongside aggregate results (see Table ES1).
Table ES1. State-wise decentralised solar capacity requirements for agriculture and cumulative subsidy savings by 2030 under the 100% solarisation scenario
| State | Projected agricultural demand 2030 (BU) | Required solar capacity (GW) | Cumulative subsidy savings (INR crore) |
|---|---|---|---|
| Andhra Pradesh | 19.1 | 11.5 | 22,002 |
| Bihar | 9.4 | 5.6 | 9,598 |
| Chhattisgarh | 7.7 | 4.6 | 4,638 |
| Gujarat | 25.9 | 15.6 | 11,278 |
| Haryana | 10.9 | 6.5 | 14,206 |
| Karnataka | 29.5 | 17.7 | 44,339 |
| Madhya Pradesh | 37.5 | 22.5 | 36,531 |
| Maharashtra | 40.6 | 24.4 | 24,548 |
| Punjab | 16.2 | 9.8 | 14,552 |
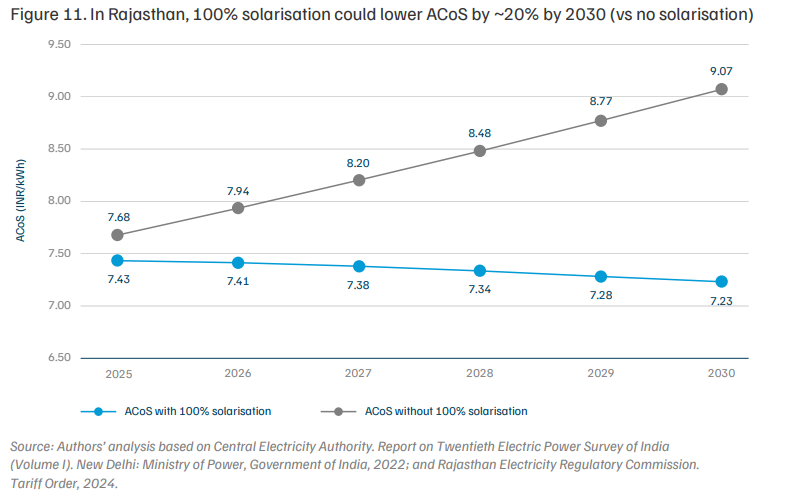
| Rajasthan | 45.4 | 27.3 | 40,099 |
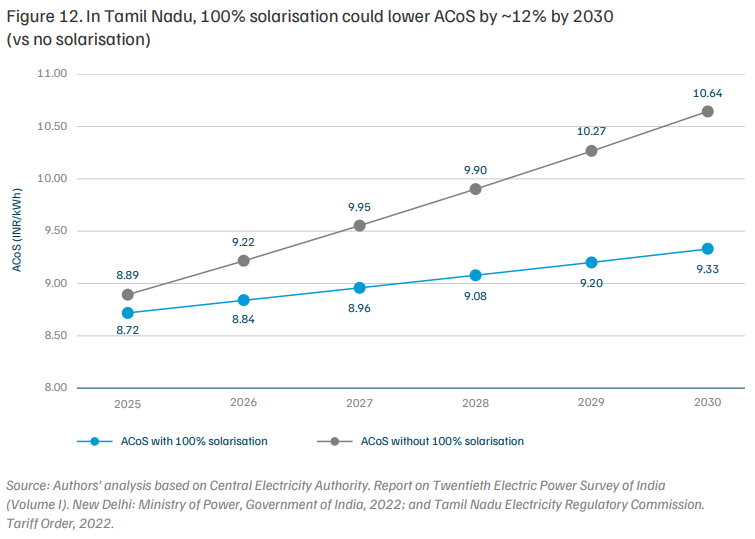
| Tamil Nadu | 22.4 | 13.5 | 18,040 |
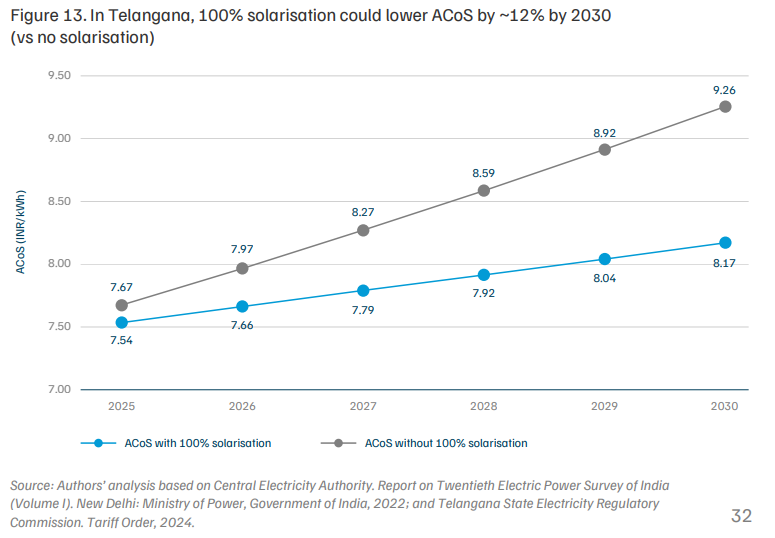
| Telangana | 24.5 | 14.7 | 31,947 |
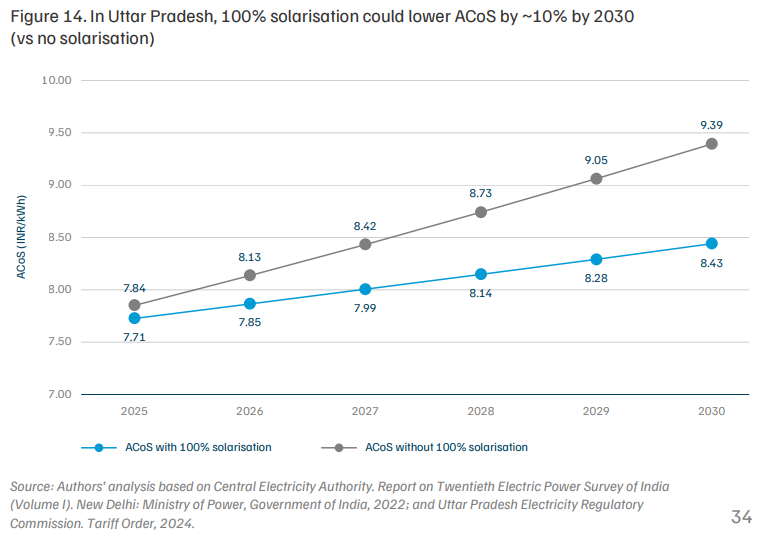
| Uttar Pradesh | 28.0 | 16.8 | 31,200 |
| Total | 317 | 191 | 3,02,978 |
Source: Authors’ analysis
Agricultural consumption is seasonal, while solar generation is variable. A direct aggregate comparison between current procurement costs and solar tariffs does not fully capture system requirements and savings, including the need for balancing and storage during specific periods. However, even after accounting for these requirements, solarisation remains economically compelling.
In several states, discoms could deploy up to 36 GWh (9 GW × 4-hour) of BESS capacity alongside solarisation under current cost assumptions. This would help meet around 4 per cent of projected agricultural demand (317 BU) through storage by 2030, assuming daily cycling. Importantly, even after incorporating reasonable storage investments, agricultural solarisation continues to generate substantial net fiscal gains.
As agricultural demand grows towards 2030, states will need to commit progressively higher fiscal resources to maintain the current supply model. Strategic solarisation, complemented where necessary by targeted storage deployment, will provide states with a credible opportunity to moderate this trajectory.
The window to act is before rising demand and procurement costs lock in higher subsidy levels. Decisions taken over the next few years will determine whether agricultural electricity remains a growing fiscal pressure or becomes part of a deliberate strategy to stabilise state distribution finances.
Agricultural subsidy and cross subsidy pressure are rising
Agriculture has long played a central role in India’s development strategy. Nearly one-fifth of the country’s electricity is consumed in agriculture (PFC 2025), much of it supplied free or at heavily subsidised tariffs (Aggarwal et al. 2020). Affordable power has enabled irrigation expansion, stabilised farm input costs, and supported food security and livelihoods of millions of farmers across states. Subsidised agricultural power has therefore delivered substantial social and economic gains.
Over time, however, prevailing pricing and supply arrangements for agricultural electricity have created persistent stress within the power sector. Tariffs for agricultural consumers are set far below the cost of supply, often through unmetered arrangements, leaving a significant revenue gap (Aggarwal et al. 2020). States finance this gap through direct subsidies and crosssubsidies from other consumers. While regulators have consciously adopted this structure, agricultural supply has become one of the most significant and recurring sources of under-recovery for discoms.
In several agrarian states, including Rajasthan (JVVNL 2025), outstanding subsidy dues remain substantial, reflecting a persistent mismatch between the cost of supplying farm power and its financing. Delays in subsidy disbursement strain discom cash flows, increase reliance on short-term borrowing, and crowd out investment in network strengthening. These constraints subsequently weaken supply quality and reinforce a cycle of operational inefficiency and financial stress (Agrawal et al. 2023).
Recent reforms, such as tighter disclosure requirements (MoP 2024) and advance subsidy-payment provisions under the Revamped Distribution Sector Scheme (RDSS), have improved transparency and fiscal discipline in some states. However, these measures do not alter the underlying exposure of discom finances to rising agricultural demand.
Historically, part of the burden has been absorbed through higher tariffs on commercial and industrial (C&I) consumers (Tyagi and Tongia 2023). While cross-subsidisation reduced immediate fiscal pressure on state budgets, it also increased electricity costs for industry and services, weakened competitiveness, and accelerated the shift towards open access and captive generation. In response, regulators in several states, including Karnataka, Rajasthan, and Maharashtra, have begun rationalising tariffs and outlining trajectories to reduce cross-subsidies (Tripathi and Aggarwal 2025). Analysis by the Energy Transition Preparedness Initiative (ETPI) indicates that several states have aligned domestic tariffs with the average supply cost, while states such as Karnataka have announced a near elimination of cross-subsidy by FY 2028 (Prayas 2024). As this transition progresses, a growing share of the cost of agricultural electricity is shifting directly onto state budgets.
This shift comes at a time when farm power subsidies are already substantial. Across major agrarian states, annual agricultural electricity subsidies exceed INR 1.3 lakh crore. These outlays crowd out other development priorities and increase fiscal exposure to fluctuations in procurement costs and demand growth. Climate variability and rising irrigation needs are likely to intensify these pressures. Without a structural change in how agricultural electricity is supplied, both discom finances and state budgets will remain vulnerable.
Solarisation of agricultural demand offers a structural pathway to reduce subsidy burden by lowering cost of supply.
Agricultural solarisation: A structural pathway to moderate rising agricultural electricity costs
Solarising agricultural demand offers a viable structural shift. Supplying farm power through decentralised solar generation aligned with daytime irrigation can reduce the cost of serving the agricultural load. It displaces higher-cost grid procurement and can avoid a portion of transmission losses and associated charges. For discoms, this narrows the cost-to-serve gap. For states, it reduces the subsidy required per unit of electricity delivered.
India has sought to promote agricultural solarisation through the Pradhan Mantri Kisan Urja Suraksha evam Utthaan Mahabhiyan (PM-KUSUM), which aims to expand solar deployment in the agricultural sector. The scheme comprises three components: Component A, which supports the installation of decentralised gridconnected solar plants; Component B, which promotes standalone solar pumps; and Component C, which enables the solarisation of existing grid-connected agricultural pumps, including feeder-level solarisation.
In states with high agricultural loads, feeder-level solarisation can therefore function as a distributionsector intervention rather than solely a renewable energy measure. By reducing the underlying cost of supplying a structurally subsidised segment, it addresses the source of fiscal pressure rather than merely reallocating it across consumer categories.
Decentralised solar also aligns with emerging grid realities. States with high renewable penetration, such as Rajasthan, can benefit from distributed solar serving local agricultural demand, which eases network stress rather than adding to it. This approach complements grid-scale renewable expansion while addressing a long-standing distribution-sector challenge (Agrawal et al. 2023).
Despite these advantages, progress remains uneven. Agricultural solarisation continues to be implemented largely as a standalone scheme rather than as part of distribution-sector planning. A clear and comparable assessment of the fiscal relief, cost reductions, and system-level benefits achievable at different adoption scales remains limited. This brief seeks to address that gap.
This brief presents a comparable assessment of how agricultural solarisation can alter fiscal and distributionsector outcomes across states by 2030. It aims to inform policy design, regulatory decision-making, and near-term implementation at the state level.
To do so, the brief evaluates 4 solarisation pathways–25, 50, 75, and 100 per cent of projected agricultural electricity demand by 2030–across 13 major agrarian states. Together, these states account for 99 per cent of India’s agricultural electricity consumption. Each pathway is evaluated against a business-as-usual scenario in which agricultural demand is met largely through conventional grid-based supply.
For each state and adoption level, the brief estimates five outcomes:
Presenting these results within a consistent framework enables cross-state comparison and supports more informed target-setting and implementation planning.
State selection
The brief examines 13 major agrarian states that together account for nearly all agricultural electricity consumption in India. Five states–Maharashtra, Rajasthan, Madhya Pradesh, Telangana, and Karnataka–account for nearly 60 per cent of national agricultural power consumption. By focusing on states with high agricultural load and significant fiscal exposure, the analysis identifies where solarisation can have the greatest structural impact.
Figure 1A. Geographic coverage of the 13 states included in the analysis
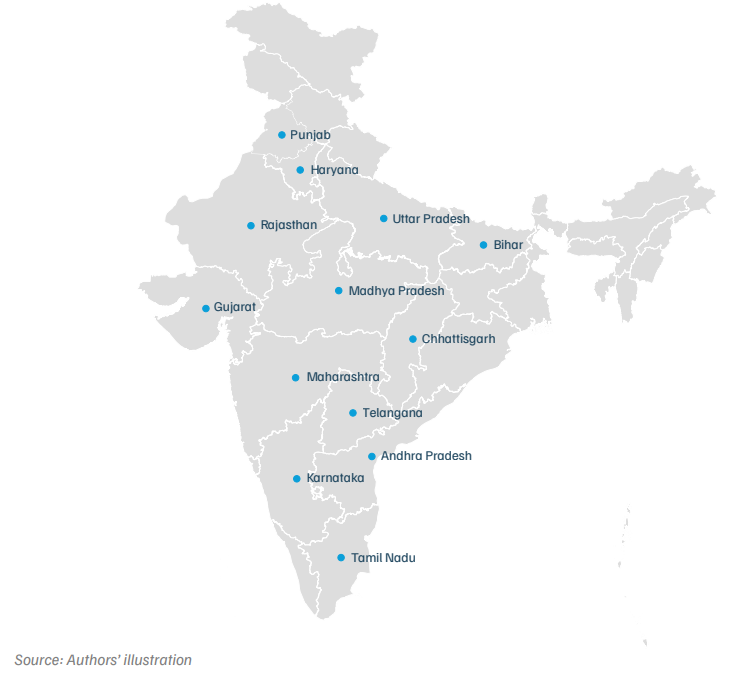
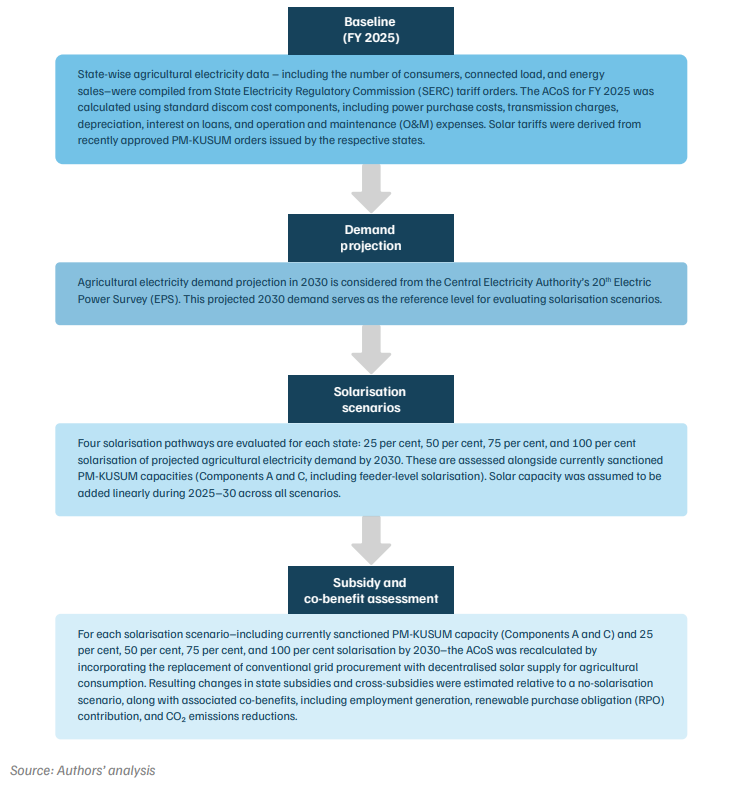
Figure 1B. Methodology used for estimating the benefits of solarising agricultural power demand
This section presents the fiscal, cost-of-supply, and emissions implications of agricultural solarisation across 13 major agrarian states. The results highlight how outcomes vary with agricultural load share, procurement costs, feeder readiness, and existing subsidy exposure.
To facilitate comparison, this section presents results for projected agricultural demand in 2030 under a 100 per cent solarisation scenario, alongside currently sanctioned capacity under PM-KUSUM. Intermediate pathways (25, 50, and 75 per cent) reflect proportionate scaling of impacts.
Study limitations
The analysis is subject to the following limitations:
Full solarisation of agricultural demand by 2030 could reduce cost of supply by 6–24% across states.
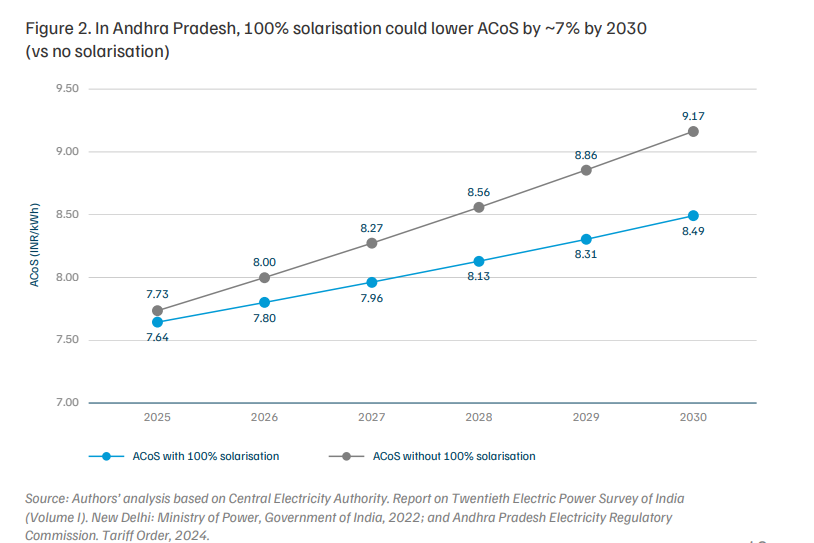
4.1 Andhra Pradesh
| Agri-demand solarisation scenarios (%) | Solar capacity (GW) | Employment potential (FTE) | Emissions abatement potential in 2030 (MtCO2e/year) | Cumulative government subsidy savings by 2030 (INR crore) | Cumulative cross-subsidy savings by 2030 (INR crore) | Contribution to state RPO (%) |
|---|---|---|---|---|---|---|
| 13* | 1.46 | 6,290 | 1.25 | 1.25 | 0 | 2.20 |
| 25 | 2.87 | 12,410 | 2.47 | 2.47 | 0 | 4.40 |
| 50 | 5.75 | 24,820 | 4.94 | 4.94 | 0 | 8.70 |
| 75 | 8.62 | 37,230 | 7.42 | 7.42 | 0 | 13.10 |
| 100 | 11.49 | 49,640 | 9.89 | 9.89 | 0 | 17.40 |
Source: Authors' analysis based on Central Electricity Authority. Report on Twentieth Electric Power Survey of India (Volume I). New Delhi: Ministry of Power, Government of India, 2022; and Andhra Pradesh Electricity Regulatory Commission. Tariff Order, 2024.
*Note: 13 per cent represents agri-demand solarisation against the current sanctioned capacity.
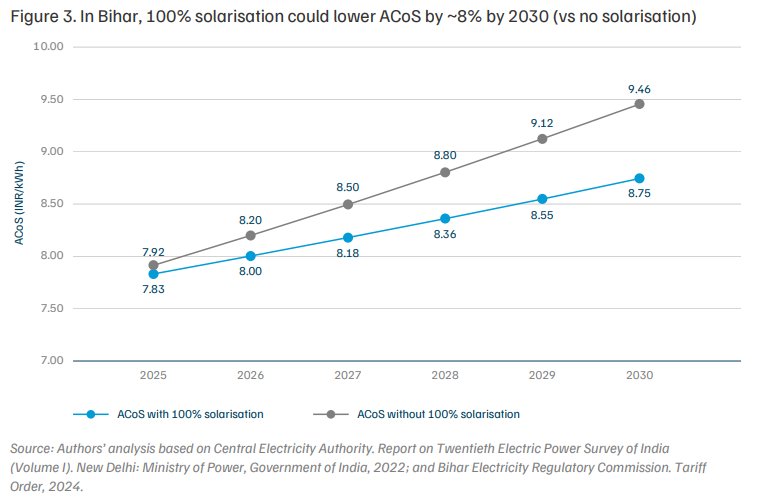
4.2 Bihar
| Agri-demand solarisation scenarios (%) | Solar capacity (GW) | Employment potential (FTE) | Emissions abatement potential in 2030 (MtCO2e/year) | Expected cumulative government subsidy savings by 2030 (INR crore) | Expected cumulative cross-subsidy savings by 2030 (INR crore) | Contribution to state RPO (%) |
|---|---|---|---|---|---|---|
| 18* | 1.02 | 4,421 | 0.88 | 0.88 | 350 | 2.40 |
| 25 | 1.41 | 6,075 | 1.21 | 1.21 | 525 | 3.30 |
| 50 | 2.81 | 12,151 | 2.42 | 2.42 | 1,150 | 6.50 |
| 75 | 4.22 | 18,226 | 3.63 | 3.63 | 1,775 | 9.80 |
| 100 | 5.63 | 24,302 | 4.84 | 4.84 | 2,399 | 13.30 |
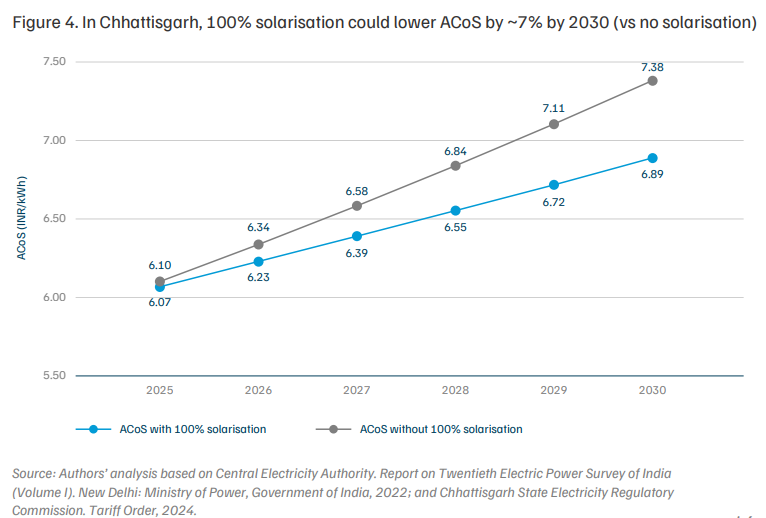
4.3 Chhattisgarh
| Agri-demand solarisation scenarios (%) | Solar capacity (GW) | Employment potential (FTE) | Emissions abatement potential in 2030 (MtCO2e/year) | Expected cumulative government subsidy savings by 2030 (INR crore) | Expected cumulative cross-subsidy savings by 2030 (INR crore) | Contribution to state RPO (%) |
|---|---|---|---|---|---|---|
| 10* | 0.44 | 1,896 | 0.38 | 95 | 21 | 1.50 |
| 25 | 1.15 | 4,983 | 0.99 | 852 | 187 | 3.90 |
| 50 | 2.31 | 9,967 | 1.99 | 2,114 | 464 | 7.80 |
| 75 | 3.46 | 14,950 | 2.98 | 3,376 | 741 | 11.70 |
| 100 | 4.61 | 19,934 | 3.97 | 4,638 | 1,018 | 15.60 |
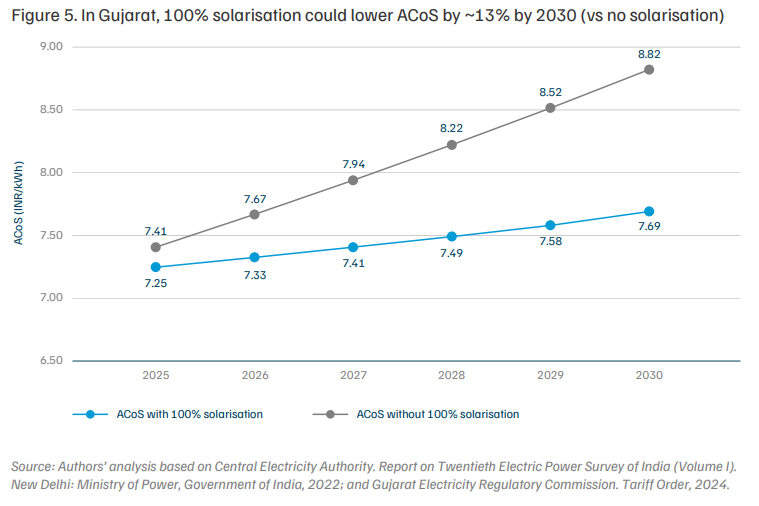
4.4 Gujarat
| Agri-demand solarisation scenarios (%) | Solar capacity (GW) | Employment potential (FTE) | Emissions abatement potential in 2030 (MtCO2e/year) | Expected cumulative government subsidy savings by 2030 (INR crore) | Expected cumulative cross-subsidy savings by 2030 (INR crore) | Contribution to state RPO (%) |
|---|---|---|---|---|---|---|
| 25* | 3.90 | 16,851 | 3.35 | 2,666 | 5,176 | 4.00 |
| 50 | 7.79 | 33,661 | 6.70 | 5,537 | 10,748 | 8.00 |
| 75 | 11.69 | 50,492 | 10.06 | 8,407 | 16,320 | 12.10 |
| 100 | 15.58 | 67,323 | 13.41 | 11,278 | 21,892 | 16.10 |
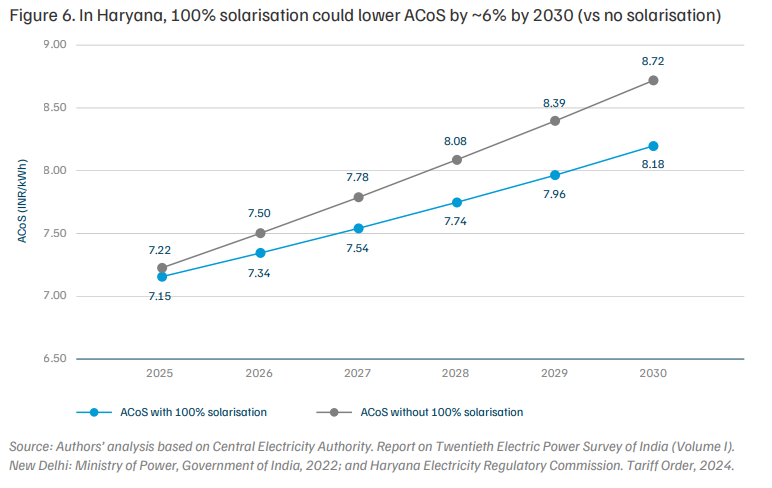
4.5 Haryana
| Agri-demand solarisation scenarios (%) | Solar capacity (GW) | Employment potential (FTE) | Emissions abatement potential in 2030 (MtCO2e/year) | Expected cumulative government subsidy savings by 2030 (INR crore) | Expected cumulative cross-subsidy savings by 2030 (INR crore) | Contribution to state RPO (%) |
|---|---|---|---|---|---|---|
| 3* | 0.18 | 774 | 0.15 | NIL | 0 | 0.30 |
| 25 | 1.63 | 7,039 | 1.40 | 3,176 | 0 | 3.01 |
| 50 | 3.26 | 14,078 | 2.80 | 6,853 | 0 | 6.02 |
| 75 | 4.89 | 21,117 | 4.21 | 10,530 | 0 | 9.03 |
| 100 | 6.52 | 28,156 | 5.61 | 14,206 | 0 | 10.05 |
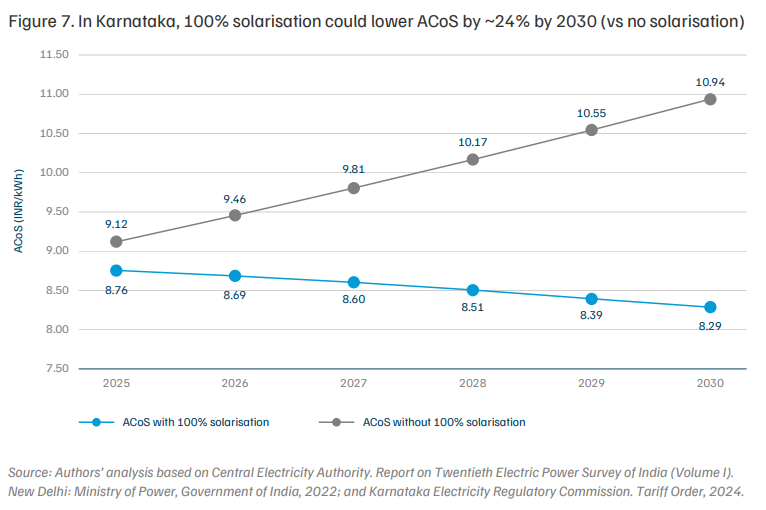
4.6 Karnataka
| Agri-demand solarisation scenarios (%) | Solar capacity (GW) | Employment potential (FTE) | Emissions abatement potential in 2030 (MtCO2e/year) | Expected cumulative government subsidy savings by 2030 (INR crore) | Expected cumulative cross-subsidy savings by 2030 (INR crore) | Contribution to state RPO (%) |
|---|---|---|---|---|---|---|
| 32* | 5.67 | 24,486 | 4.88 | 13,933 | 4,644 | 10.50 |
| 50 | 8.86 | 38,262 | 7.62 | 21,982 | 7,327 | 16.40 |
| 75 | 13.29 | 57,392 | 11.43 | 33,160 | 11,053 | 24.70 |
| 100 | 17.71 | 76,523 | 15.24 | 44,339 | 14,780 | 32.90 |
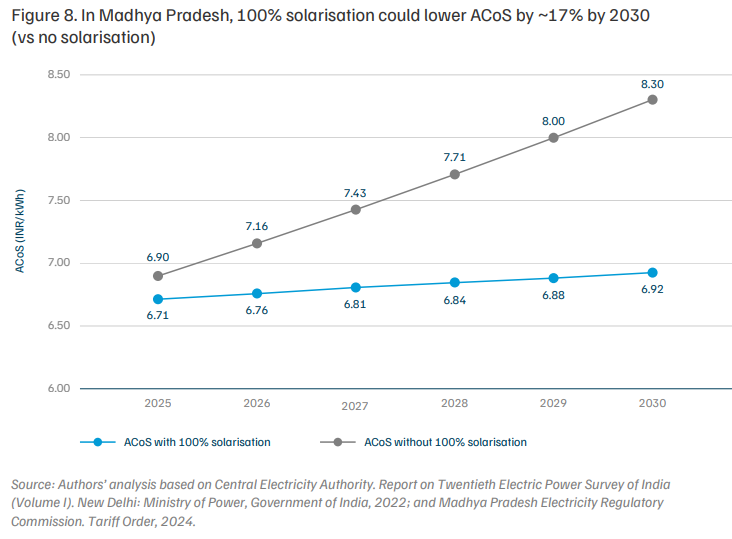
4.7 Madhya Pradesh
| Agri-demand solarisation scenarios (%) | Solar capacity (GW) | Employment potential (FTE) | Emissions abatement potential in 2030 (MtCO2e/year) | Expected cumulative government subsidy savings by 2030 (INR crore) | Expected cumulative cross-subsidy savings by 2030 (INR crore) | Contribution to state RPO (%) |
|---|---|---|---|---|---|---|
| 19* | 4.30 | 18,583 | 3.70 | 6,581 | 813 | 6.40 |
| 25 | 5.63 | 24,309 | 4.84 | 8,799 | 1,088 | 8.40 |
| 50 | 11.25 | 48,618 | 9.68 | 18,043 | 2,230 | 16.80 |
| 75 | 16.88 | 72,927 | 14.53 | 22,287 | 3,373 | 25.20 |
| 100 | 22.51 | 97,236 | 19.37 | 36,531 | 4,515 | 33.60 |
Source: Authors' analysis based on Central Electricity Authority. Report on Twentieth Electric Power Survey of India (Volume I). New Delhi: Ministry of Power, Government of India, 2022; and Madhya Pradesh Electricity Regulatory Commission. Tariff Order, 2024.
*Note: 19 per cent represents agri-demand solarisation against the current sanctioned capacity.
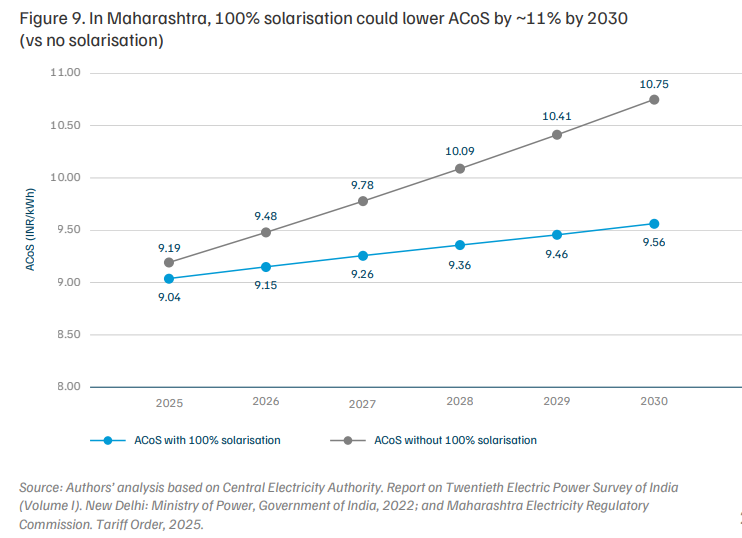
4.8 Maharashtra
| Agri-demand solarisation scenarios (%) | Solar capacity (GW) | Employment potential (FTE) | Emissions abatement potential in 2030 (MtCO2e/year) | Expected cumulative government subsidy savings by 2030 (INR crore) | Expected cumulative cross-subsidy savings by 2030 (INR crore) | Contribution to state RPO (%) |
|---|---|---|---|---|---|---|
| 24* | 5.90 | 25,497 | 5.08 | 5,729 | 4,322 | 5.70 |
| 25 | 6.09 | 26,318 | 5.24 | 5,977 | 4,509 | 5.90 |
| 50 | 12.18 | 52,636 | 10.48 | 12,167 | 9,179 | 11.80 |
| 75 | 18.28 | 78,955 | 15.73 | 18,358 | 13,849 | 17.70 |
| 100 | 24.37 | 1,05,273 | 20.97 | 24,548 | 18,519 | 23.60 |
Source: Authors' analysis based on Central Electricity Authority. Report on Twentieth Electric Power Survey of India (Volume I). New Delhi: Ministry of Power, Government of India, 2022; and Maharashtra Electricity Regulatory Commission. Tariff Order, 2025.
*Note: 24 per cent represents agri-demand solarisation against the current sanctioned capacity.
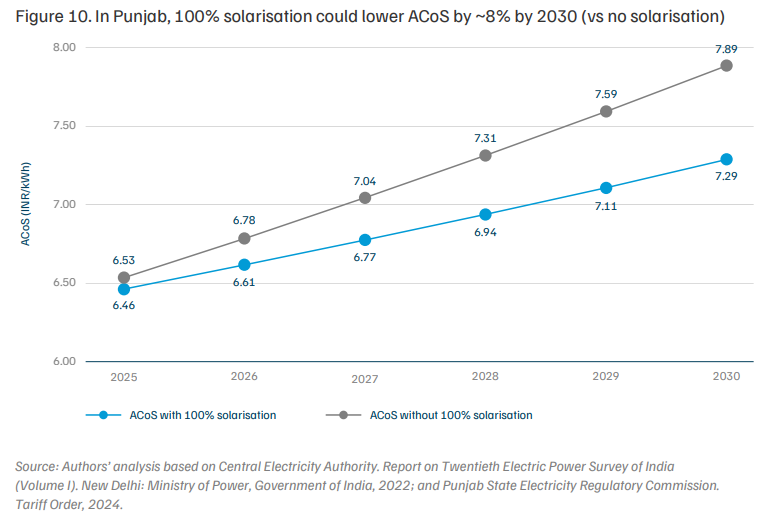
4.9 Punjab
| Agri-demand solarisation scenarios (%) | Solar capacity (GW) | Employment potential (FTE) | Emissions abatement potential in 2030 (MtCO2e/year) | Expected cumulative government subsidy savings by 2030 (INR crore) | Expected cumulative cross-subsidy savings by 2030 (INR crore) | Contribution to state RPO (%) |
|---|---|---|---|---|---|---|
| 25 | 2.44 | 10,537 | 2.10 | 3,286 | 210 | 4.50 |
| 50 | 4.88 | 21,073 | 4.20 | 7,041 | 449 | 8.90 |
| 75 | 7.32 | 31,610 | 6.30 | 10,797 | 689 | 13.40 |
| 100 | 9.76 | 42,146 | 8.40 | 14,552 | 929 | 17.80 |
Source: Authors' analysis based on Central Electricity Authority. Report on Twentieth Electric Power Survey of India (Volume I). New Delhi: Ministry of Power, Government of India, 2022; and Punjab State Electricity Regulatory Commission. Tariff Order, 2024.
*Note: No capacity sanctioned for Punjab under Components A and C (Feeder Level Solarisation) of the PM-KUSUM scheme.
4.10 Rajasthan
| Agri-demand solarisation scenarios (%) | Solar capacity (GW) | Employment potential (FTE) | Emissions abatement potential in 2030 (MtCO2e/year) | Expected cumulative government subsidy savings by 2030 (INR crore) | Expected cumulative cross-subsidy savings by 2030 (INR crore) | Contribution to state RPO (%) |
|---|---|---|---|---|---|---|
| 30* | 8.16 | 35,260 | 7.02 | 7,02 | 4,136 | 10.90 |
| 50 | 13.63 | 58,871 | 11.73 | 11.73 | 6,979 | 18.20 |
| 75 | 20.44 | 88,307 | 17.59 | 17.59 | 10,534 | 27.30 |
| 100 | 27.26 | 1,17,742 | 23.45 | 23.45 | 14,089 | 36.50 |
Source: Authors' analysis based on Central Electricity Authority. Report on Twentieth Electric Power Survey of India (Volume I). New Delhi: Ministry of Power, Government of India, 2022; and Rajasthan Electricity Regulatory Commission. Tariff Order, 2024.
*Note: 30 per cent represents agri-demand solarisation against the current sanctioned capacity, which is more than a 25 per cent demand solarisation scenario; therefore, it is not shown.
4.11 Tamil Nadu
| Agri-demand solarisation scenarios (%) | Solar capacity (GW) | Employment potential (FTE) | Emissions abatement potential in 2030 (MtCO2e/year) | Expected cumulative government subsidy savings by 2030 (INR crore) | Expected cumulative cross-subsidy savings by 2030 (INR crore) | Contribution to state RPO (%) |
|---|---|---|---|---|---|---|
| 25 | 3.37 | 14,550 | 2.90 | 4,311 | 3,823 | 4.40 |
| 50 | 6.74 | 29,099 | 5.80 | 8,887 | 7,881 | 8.90 |
| 75 | 10.10 | 43,649 | 8.69 | 13,463 | 11,939 | 13.30 |
| 100 | 13.47 | 58,198 | 11.59 | 18,040 | 15,997 | 17.80 |
Source: Authors' analysis based on Central Electricity Authority. Report on Twentieth Electric Power Survey of India (Volume I). New Delhi: Ministry of Power, Government of India, 2022; and Tamil Nadu Electricity Regulatory Commission. Tariff Order, 2022.
*Note: Capacity sanctioned under Component A is minimal (3 MW); therefore, there are no tangible benefits.
4.12 Telangana
| Agri-demand solarisation scenarios (%) | Solar capacity (GW) | Employment potential (FTE) | Emissions abatement potential in 2030 (MtCO2e/year) | Expected cumulative government subsidy savings by 2030 (INR crore) | Expected cumulative cross-subsidy savings by 2030 (INR crore) | Contribution to state RPO (%) |
|---|---|---|---|---|---|---|
| 11* | 1.7 | 7,128 | 1.42 | 3,069 | 0 | 2.80 |
| 25 | 3.67 | 15,872 | 3.16 | 7,612 | 0 | 6.30 |
| 50 | 7.35 | 31,745 | 6.32 | 15,724 | 0 | 12.50 |
| 75 | 11.02 | 47,617 | 9.48 | 23,836 | 0 | 18.80 |
| 100 | 14.70 | 63,489 | 12.65 | 31,947 | 0 | 25.00 |
Source: Authors' analysis based on Central Electricity Authority. Report on Twentieth Electric Power Survey of India (Volume I). New Delhi: Ministry of Power, Government of India, 2022; and Telangana State Electricity Regulatory Commission. Tariff Order, 2024.
*Note: 11 per cent represents agri-demand solarisation against the current sanctioned capacity.
4.13 Uttar Pradesh
| Agri-demand solarisation scenarios (%) | Solar capacity (GW) | Employment potential (FTE) | Emissions abatement potential in 2030 (MtCO2e/year) | Expected cumulative government subsidy savings by 2030 (INR crore) | Expected cumulative cross-subsidy savings by 2030 (INR crore) | Contribution to state RPO (%) |
|---|---|---|---|---|---|---|
| 16* | 2.70 | 11,641 | 2.32 | 4,666 | 1,355 | 2.60 |
| 25 | 4.20 | 18,165 | 3.62 | 7,509 | 2,180 | 4.00 |
| 50 | 8.41 | 36,329 | 7.24 | 15,406 | 4,473 | 8.10 |
| 75 | 12.61 | 54,494 | 10.85 | 23,303 | 6,765 | 12.10 |
| 100 | 16.82 | 72,658 | 14.47 | 31,200 | 9,058 | 16.10 |
Source: Authors' analysis based on Central Electricity Authority. Report on Twentieth Electric Power Survey of India (Volume I). New Delhi: Ministry of Power, Government of India, 2022; and Uttar Pradesh Electricity Regulatory Commission. Tariff Order, 2024.
*Note: 16 per cent represents agri-demand solarisation against the current sanctioned capacity.
Agricultural electricity already represents one of the largest recurring fiscal expenditures across the 13 states assessed in this brief. In FY 2025, annual agricultural power subsidies exceeded INR 1.3 lakh crore across these states, with agricultural electricity demand projected to continue rising through 2030. As regulators progressively rationalise cross-subsidies, an increasing share of agricultural supply costs will be borne directly by state budgets rather than remain absorbed by C&I consumers.
Under a business-as-usual trajectory, rising agricultural demand met entirely through conventional grid procurement would substantially increase annual subsidy requirements, exceeding INR 2 lakh crore by FY 2030. This growth would be driven both by higher consumption volumes and exposure to prevailing procurement costs. Agricultural solarisation alters this trajectory by lowering the per-unit cost of supplying agricultural feeders. Full solarisation of agricultural demand across these states by 2030 through decentralised generation would reduce the corresponding annual subsidy requirements, generating cumulative fiscal savings of over INR 3.3 lakh crore during FY 2025–30. In states with large agricultural loads and a significant differential between grid procurement costs and decentralised solar tariffs, these gains are structural rather than incremental.
Two system-level considerations are essential when interpreting these results. First, agricultural demand is seasonal, while solar generation is concentrated during daytime hours; aggregate energy comparisons therefore do not fully capture integration and balancing requirements. Second, higher levels of feeder-level solarisation require closer alignment with distributionlevel resource adequacy planning. Changes in net load profiles, procurement strategies, and balancing arrangements must be incorporated into planning decisions. These factors affect implementation pathways but do not alter the underlying economic case for solarisation.
The 13 states analysed account for nearly all of India’s agricultural electricity consumption, and their supply choices will materially shape the distribution sector’s fiscal trajectory through 2030. Where feeder segregation is already complete, solarisation can be scaled more rapidly. Elsewhere, deployment will need to be aligned with ongoing infrastructure upgrades under the Revamped Distribution Sector Scheme (RDSS) and related programmes.
The window for influencing the subsidy trajectory is before 2030. As agricultural demand continues to grow, delaying structural adjustments increases fiscal exposure for state governments. Solarisation does not replace broader tariff or governance reforms, but it directly addresses one of the largest cost drivers in state power systems while preserving support for farmers.
Without solarisation, state subsidy for agricultural power supply could exceed to INR 2 lakh crore annually by 2030 under business-as-usual trajectory.
This CEEW issue brief (April 2026) analyses the fiscal, environmental, and employment benefits of solarising agricultural electricity demand across 13 Indian states by 2030. It evaluates four adoption pathways — 25% to 100% — and finds that full solarisation could save state governments over INR 3 lakh crore in subsidies, require 191 GW of decentralised solar, cut emissions by ~160 MtCO₂e annually, and support ~8 lakh full-time equivalent jobs.
Most Indian states supply electricity to farmers for free or at heavily subsidised rates, creating a large gap between the cost of supply and revenue recovered. In FY 2025, annual farm power subsidies across the 13 states exceeded INR 1.3 lakh crore — amounting to 4–6% of annual budgets in several states. Delays in subsidy payments strain discom cash flows and crowd out investment in grid infrastructure.
In FY 2024–25, the average power procurement cost for grid supply was INR 4.5–5.9 per kWh. Decentralised solar under PM-KUSUM is available at INR 3–3.5 per kWh — roughly 30–40% lower. By substituting grid procurement with cheaper solar for agricultural feeders, discoms reduce the per-unit cost of serving farmers, directly narrowing the subsidy gap states must fill.
Karnataka, Rajasthan, Madhya Pradesh, Telangana, and Maharashtra have the highest potential gains given their large agricultural loads and high subsidies. Karnataka stands out with a possible 24% reduction in average cost of supply and INR 44,339 crore in cumulative subsidy savings under full solarisation. Rajasthan could save INR 40,099 crore with a 20% ACoS reduction.
As of January 2026, approximately 765 MW of decentralised grid-connected solar capacity has been installed under PM-KUSUM Component A against a 10,000 MW target — just 8% progress. Around 13 lakh grid-connected agricultural pumps have been solarised out of a 35 lakh target under Component C FLS (37%). While the policy framework is in place, deployment remains modest relative to the scale of agricultural electricity demand.
Yes. The study acknowledges that agricultural demand is seasonal and solar generation is daytime-concentrated. To address balancing needs, discoms could deploy up to 36 GWh of battery storage alongside solarisation. Even after incorporating reasonable storage investments, agricultural solarisation continues to generate substantial net fiscal gains for states.
Enabling Corporate India's Clean Energy Transition
Scaling Solar Power for Irrigation in India:
Scaling India’s Data Centre Ecosystem
Anatomy of Distribution Losses in India’s Power Sector:

Vidyut Sakhi HandbookHow to become a Successful Vidyut Sakhi