Council on Energy, Environment and Water Integrated | International | Independent
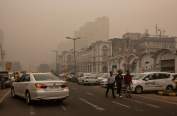
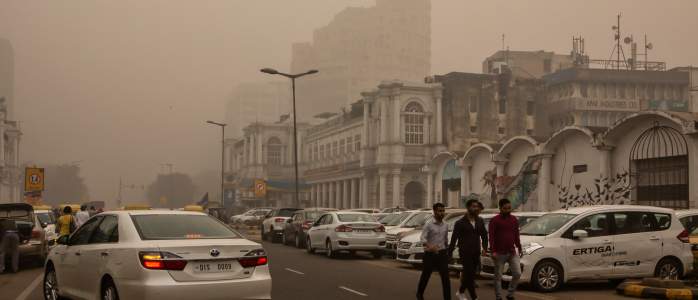
Context: Punjab and Haryana record substantial crop residue burning during both rabi and kharif seasons; however, Delhi experiences far more severe pollution during kharif.
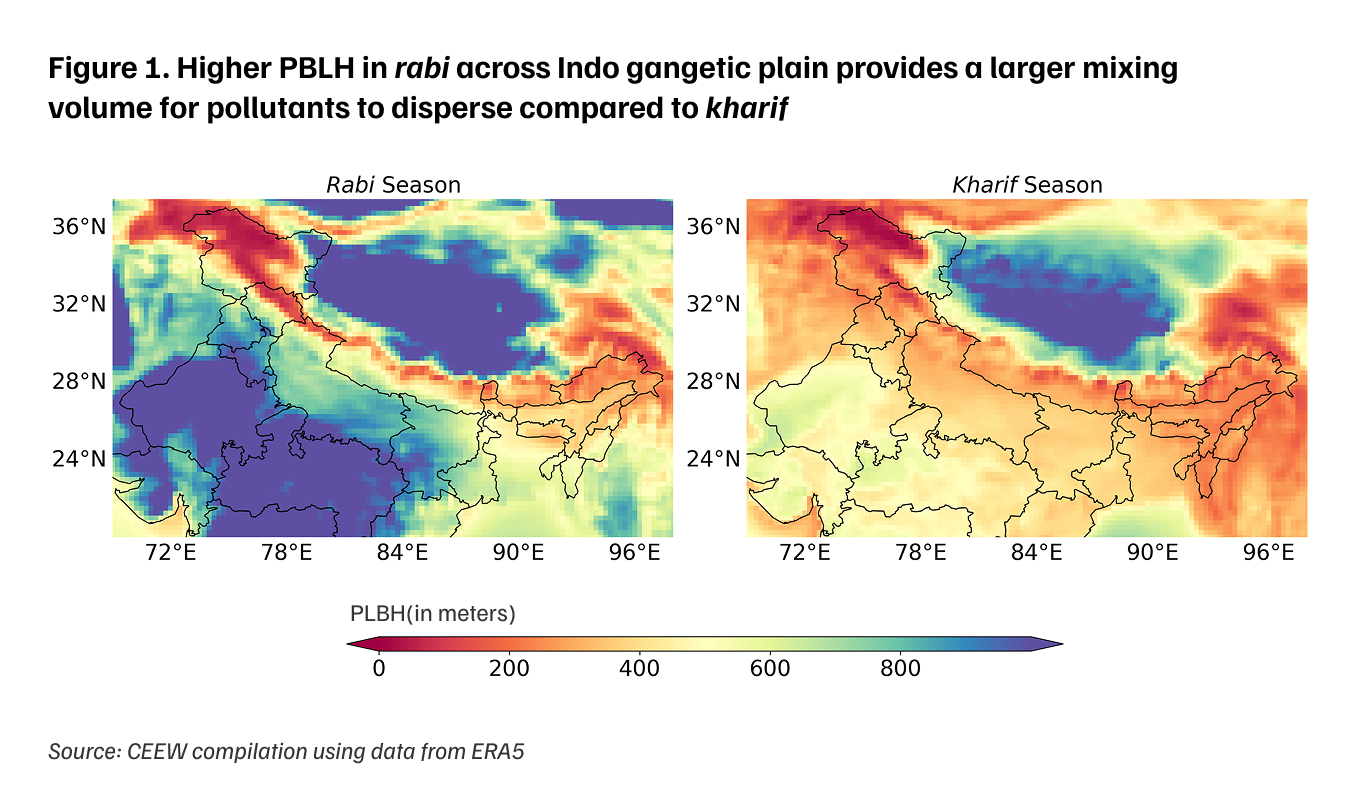
CEEW analysis: Seasonal differences in planetary boundary layer height, wind speed, and wind direction make kharif meteorology far more conducive to trapping and transporting stubble-burning emissions into Delhi.
Way forward: Delhi’s preparedness should increasingly rely on stronger forecasting systems, more accurate fire detection, and improved emissions inventories to minimise influence from adverse meteorological conditions.
Punjab and Haryana have been consistently witnessing around or more than 20,000 fires during the rabi harvest season between April 15 and May 31 every year since 2022. The Visible Infrared Imaging Radiometer Suite (VIIRS) recorded 24,533 and 19,900 fires in 2022 and 2023, respectively, during rabi, in these states. In contrast, the sensors detected 48,555 and 32,118 fires in the kharif seasons, between October 15 and November 30, for the same years. In 2024, for the first time, rabi fires exceeded the kharif number. However, the accuracy of the kharif numbers has come under scrutiny.
Analysis by the Indian Space Research Organisation (ISRO) showed that peak burning time shifted to 5 PM in 2024 compared to 1 PM four years ago, reducing the likelihood of detection by the polar-orbiting satellites. Even if we assume the rabi fire count to be half that of kharif, going by the numbers in 2022 and 2023, why does Delhi get thrice as polluted, with an average PM2.5 recording about 180 ug/m3 in kharif compared to the rabi season? And in the last six years, why has Delhi seen about 35–40 days of daily average PM2.5 exceeding the ‘Very Poor’ threshold (>120 ug/m3) in kharif, and only one to five such days in rabi? The answer lies in meteorological conditions.
Using ERA5 reanalysis data for 2015–2025 across the Indo-Gangetic Plain (IGP), researchers at the Council on Energy, Environment and Water (CEEW) analysed three meteorological parameters — planetary boundary layer height (PBLH), wind speed, and wind direction (at 10 m and 100 m) — to understand how they vary between the two harvest seasons.
Table 1. Description of meteorological parameters selected
| Parameter | Definition | Why it matters |
|---|---|---|
| Planetary boundary layer height (PBLH) | The lowest layer of the atmosphere or the vertical height of the atmosphere up to which pollutants mix. |
Warmer and more convective daytime conditions generally raise the PBLH, increasing the volume of air into which pollutants can mix, preventing pollutant buildup closer to the ground. A lower PBLH means higher accumulation of pollutants near the ground. |
| Wind speed (at 10 m and 100 m) | Speed of the wind closer to the surface at 10 m and at a height of 100 m. | The faster the wind, the better the dispersion of pollutants away from a region, both near the surface and higher up. |
| Wind direction | The direction from which the wind blows. | If the wind direction at a location is from the pollutant source, pollutants are likely to travel towards this location and worsen the air quality. |
Source: Author's analysis
Our analysis shows that across the IGP, the PBLH during rabi is higher than that in kharif. It is greater than 600 m and touches 1000 m at some locations during rabi, whereas it is less than 500 m during kharif (Figure 1). In Delhi, specifically, the average PBLH during rabi is twice that in kharif. This implies that the same pollutant load from crop residue burning has double the volume of air to mix into and dilute during rabi compared to kharif.
Wind speed varies across both seasons and at both altitudes (Figure 2). It is higher by 3–7 km/hr on average during rabi than kharif. In Delhi, the wind speed at 10 m during rabi is slightly higher at ~10 km/hr compared to ~7.5 km/hr during kharif. At 100 m altitude, the difference is ~4 km/hr in rabi's favour.
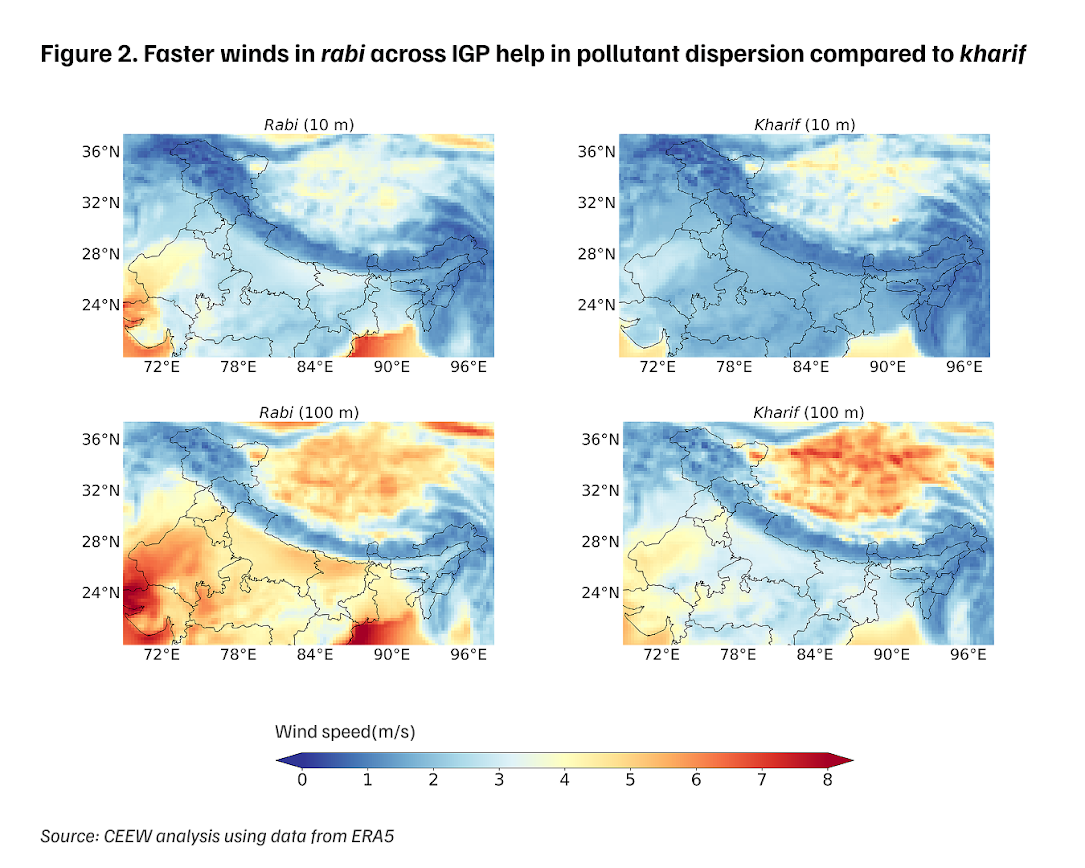
These faster winds near the surface during rabiprevent local pollutant buildup, whereas faster winds at 100 m help disperse the pollutants that originate elsewhere and travel towards Delhi.
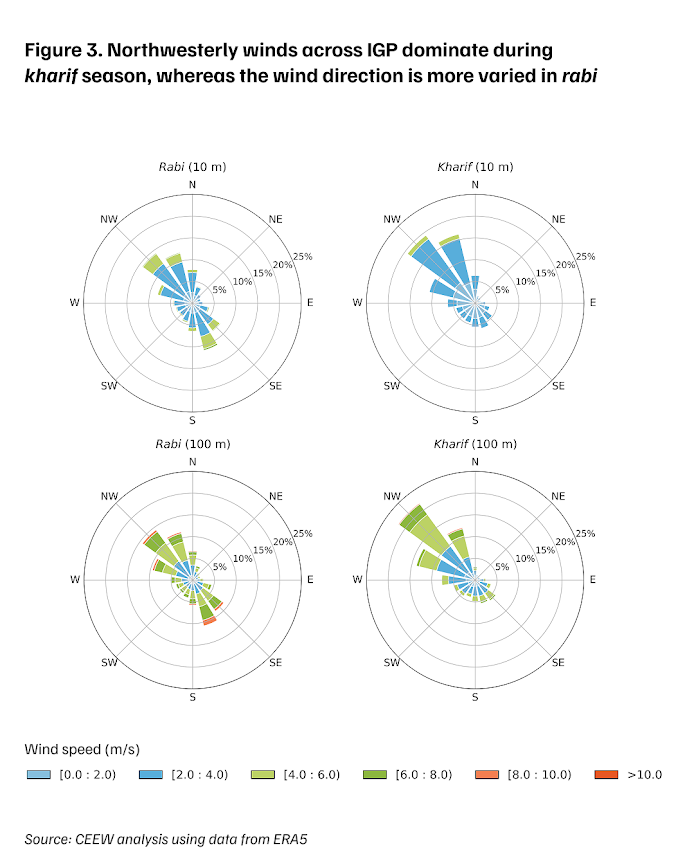
Wind direction is the third critical variable. Wind speed can either disperse pollutants or transport them faster, depending on wind direction and source location. In Delhi’s case, kharif’s northwesterly flow makes the direction especially important (Figure 3). Punjab and Haryana lie directly upwind of Delhi’s northwest. When farm fires are at their peak in October–November, northwesterly winds act as a direct corridor, carrying smoke and particulate matter from the farms towards Delhi.
During rabi, winds arrive in Delhi from northwesterly, south-southeast, and southeasterly directions, producing a more varied flow that does not channel smoke from farm fires directly and persistently towards the city.
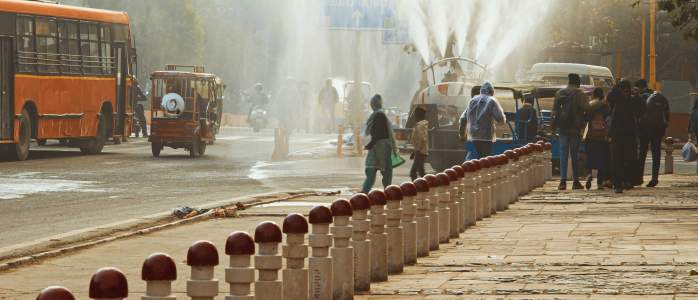
Northwesterly winds carry crop residue burning pollutants from the upwind states of Punjab and Haryana to Delhi during kharif season. A low PBLH traps these incoming pollutants close to the surface rather than allowing them to disperse vertically, while slower surface winds prevent lateral dispersal. These adverse conditions, when combined with Delhi’s emissions from other sources such as vehicles, industries, and construction, push air quality into the ‘Severe’ category.
A change in meteorology, such as a shift in winds, could still lead to an acute pollution episode in Delhi. Fortunately, Delhi has the Air Quality Early Warning System (AQEWS), which provides air quality forecasts days in advance and runs throughout the year. However, the efficiency of this system depends on the accuracy of the emission inventory that goes as an input. Emissions from stubble burning, a critical component of the inventory, are derived from the fire counts detected by satellite-borne sensors like the VIIRS. These sensors cannot detect all farm fires due to limitations in their revisit frequency and resolution. CEEW’s analysis of high-resolution imagery over a 74 sq km area in Punjab revealed that sensors detected only seven out of 169 fires.
The path to accurate fire counts, and hence better inventories and forecasts, lies in the fusion of data from open-source and commercial satellites of different types to balance frequency, resolution, and coverage. An integrated system could also utilise data from satellites like the recently launched NASA-ISRO Synthetic Aperture Radar (NISAR), which can see through clouds using Synthetic Aperture Radar (SAR). Moreover, Earth Fire Alliance's FireSat-like high-frequency thermal systems could improve detection of short-lived fires, though their performance for small agricultural residue burning in north India would need validation.
Delhi’s air pollution preparedness should rely less on the favours of meteorology and more on better forecasting and monitoring systems across seasons.
Evita Merin Xavier is Consultant, Sneha Maria Ignatious is Programme Associate, and Mohammad Rafiuddin is Programme Lead at the Council on Energy, Environment and Water (CEEW). Send your comments to mohammad.rafiuddin@ceew.in


Add new comment